| Kingston SSDNow-V 40GB Boot Drive SNV125-S2/40GB |
| Reviews - Featured Reviews: Storage | ||||||||||||||||||||||||||||||||||||||||||||||||||||||||||||||||||||||||||
| Written by Olin Coles | ||||||||||||||||||||||||||||||||||||||||||||||||||||||||||||||||||||||||||
| Wednesday, 11 November 2009 | ||||||||||||||||||||||||||||||||||||||||||||||||||||||||||||||||||||||||||
Kingston SSDNow-V Boot Drive ReviewFor years, Kingston has sold system memory upgrade kits to help boost personal computer performance. Installing RAM is a simple process, and it usually helped speed up an old PC. Yet, because the processor and memory both operate at level much faster than the average hard disk, the real bottleneck is the primary drive. Solid State Drives are the ideal upgrade for hard drives, and the difference an SSD makes is far noticeable than any memory upgrade. In this article, Benchmark Reviews tests the performance and speed for the ideal SSD starter kit: Kingston's SSDNow V 40GB Boot Drive SSD SNV125-S2/40GB. Early on in their debut, Solid State Drives were planned as included equipment on new computers coming from tier one manufacturers such as Dell, HP, and Apple. In one way or another they made good on their word, but the inflated price for these premium options made SSDs a distant reality. This situation created the perfect condition for a enthusiastic upgrade market. Not surprisingly, manufacturers went after the individual consumer after losing traction with mass system builders, and upgrade kits became the obvious solution for many enthusiasts. Kingston is well known for manufacturing their own memory products, but when it came to the new SSD technology they turned to proven sources such as Samsung or Intel. Until 2009, Solid State Drive (SSD) popularity was only growing in the elite enthusiast circles. That's exactly what Kingston wants to change with their SSDNow V (Value) boot-drive upgrade kit. The principal is simple: install the Windows O/S (Windows 7 would be a good choice), and save you downloads and large media files to a secondary drive. Oddly enough, this is something I've been doing for 10+ years already, and it wasn't for lack of storage space.
Anyone familiar with articles published at Benchmark Reviews is very well aware of our obsession with Solid State Drive technology. They're complex, and every SSD is different than the next. Nothing like Hard Disk Drive technology, which improves as spindle speed and cache buffer are increased, SSDs are the future and because of this their internal architecture is constantly evolving. This is why we offer so much coverage on the topic: it's interesting and exciting. Plus, they can turn the average computer system into a roaring beast. It's not marketing hype; for once the truth is stranger than fiction. Since first making a public debut at the 2007 Consumer Electronics Show, Solid State Drives (SSDs) have been a topic of hot discussion among performance enthusiasts. These nonvolatile flash memory-based drives feature virtually no access time delay and promise a more reliable storage medium with greater performance while operating at a fraction of the power level. Moving into 2008, SSDs became a consumer reality for many performance-minded power users. Now that 2009 has proven how strong the industry support behind Solid State Drive technology is, we should hope that mainstream acceptance moves faster than it did for DDR3 SDRAM. Solid State Drive products are no longer restricted to bleeding edge hardware enthusiasts or wealthy elitists. Heading into 2009, SSD storage devices were available online for nearly $2 per gigabyte of storage capacity while the most popular performance desktop hard drive hovered just above $1/GB. While most consumers are waiting for that day when SSD costs the same as HDD, they seem to be forgetting how Solid State Drives have already surpassed Hard Disk performance in every other regard. Our collection of SSD reviews is a good starting point for comparing the competition. SSD Testing DisclaimerEarly on in our SSD coverage, Benchmark Reviews published an article which detailed Solid State Drive Benchmark Performance Testing. The research and discussion that went into producing that article changed the way we now test SSD products. Our previous perceptions of this technology were lost on one particular difference: the wear leveling algorithm that makes data a moving target. Without conclusive linear bandwidth testing or some other method of total-capacity testing, our previous performance results were rough estimates at best. Our test results were obtained after each SSD had been prepared using DISKPART or Sanitary Erase tools. As a word of caution, applications such as these offer immediate but temporary restoration of original 'pristine' performance levels. In our tests, we discovered that the maximum performance results (charted) would decay as subsequent tests were performed. SSDs attached to TRIM enabled Operating Systems will benefit from continuously refreshed performance, whereas older O/S's will require a garbage collection (GC) tool to avoid 'dirty NAND' performance degradation. It's critically important to understand that no software for the Microsoft Windows platform can accurately measure SSD performance in a comparable fashion. Synthetic benchmark tools such as HD Tach and PCMark are helpful indicators, but should not be considered the ultimate determining factor. That factor should be measured in actual user experience of real-world applications. Benchmark Reviews includes both bandwidth benchmarks and application speed tests to present a conclusive measurement of product performance. About Kingston Digital, Inc.Kingston Digital, Inc. ("KDI") is the Flash memory affiliate of Kingston Technology Company, Inc., the world's largest independent manufacturer of memory products. Established in 2008, KDI is headquartered in Fountain Valley, California, USA. For more information, please visit https://www.kingston.com/ or call 800-337-8410. About Kingston Technology Company, Inc.
Kingston Technology Company, Inc. is the world's largest independent manufacturer of memory products. Kingston designs, manufactures and distributes memory products for desktops, laptops, servers, printers, and Flash memory products for PDAs, mobile phones, digital cameras, and MP3 players. Through its global network of subsidiaries and affiliates, Kingston has manufacturing facilities in California, Malaysia, Taiwan, China and sales representatives in the United States, Europe, Russia, Australia, New Zealand, India, Taiwan, China, and Latin America. Founded in 1987 with a single product offering, Kingston now offers more than 2,000 memory products that support nearly every device that uses memory, from computers, servers and printers to MP3 players, digital cameras and cell phones. In 2006, the company's sales exceeded $3.7 billion. With global headquarters in Fountain Valley, California, Kingston employs more than 3,300 people worldwide. Regarded as one of the "Best Companies to Work for in America" by Fortune magazine, Kingston's tenets of respect, loyalty, flexibility and integrity create an exemplary corporate culture. Kingston believes that investing in its people is essential, and each employee is a vital part of Kingston's success. Kingston serves an international network of distributors, resellers, retailers and OEM customers on six continents. The company also provides contract manufacturing and supply chain management services for semiconductor manufacturers and system OEMs. At the Forefront of Memory: The History of Kingston Kingston Technology grew out of a severe shortage of surface-mount memory chips in the high-tech marketplace in the 1980s. John Tu and David Sun were determined to find a solution. They put their engineering expertise to work and designed a new Single In-Line Memory Module (SIMM) that used readily available, older technology through-hole components. A new industry standard was born - and, on October 17, 1987, so was Kingston Technology. Kingston SSDNow V FeaturesThe SSDNow V Series 40GB Boot Drive is the latest addition to Kingston Digital's V (Value) family of solid-state drives (SSD). The Kingston SSDNow V Series 40GB Boot Drive is one of the best and most cost-effective ways to accelerate any desktop's boot, shutdown and application load times. The Kingston SSDNow V Series 40GB Boot Drive has an MSRP of $115.00 (U.S.) and will begin shipping on November 9, 2009. It is backed by a three-year warranty, 24/7 tech support and legendary Kingston reliability. For more information visit https://www.kingston.com/. Kingston's SSDNow V Series 40GB Boot Drive is designed for novice SSD users looking to increase their current desktop performance. As part of Kingston's goal to provide an easy upgrade path for first-time SSD users as well as do-it-yourself system builders, the drive is also available with a bundle that includes cloning software, 2.5" to 3.5" brackets and SATA data and power cable extenders. The SSDNow V Series 40GB Boot Drive is designed for a desktop system to be used in conjunction with an existing hard-disk drive (HDD). A PC operating system and key applications reside on the SSD while all data such as documents, music, files and photos remain on the HDD. SNV125-S2/40GB Specifications
* Offer available for limited time only. Will begin shipping November 9, 2009. Kingston SSDNow 40GB Boot Drive Kits
First Look: Kingston SSD Boot DriveWhen it comes to the appearance of notebook drives, most people forget that the product you've just bought will be hidden away from view and forgotten once it gets installed. Keeping in mind that this product is also of solid state design, and therefore has no moving parts, it takes extra attention to product presentation in order to help keep consumers feeling comfortable with their premium-priced purchase. Kingston might have borrowed the same internal components as others for their SSDNow Value series , but the outside is bares the always unique Kingston artwork. A textured metal enclosure disassociates itself with so many of the plain black designs we've seen lately, and adds a touch of class to the product line.
Unlike desktop computers which utilize a SATA cable system to connect drive to motherboard, nearly all notebooks are designed to allow the 2.5" drive to slide directly into a connection bay within the system. In addition to notebooks and desktop computer application, this Crucial SSDNow V+ series MLC Solid State Drive can be utilized for mission-critical backups or high-abuse data systems; but its real focus is on high-performance date transfer speeds. Unfortunately, the Kingston SNV125-S2/40GB model does not offer an integrated High-Speed USB 2.0 Mini-B port such as we've seen on older competitor products.
Unlike the average Hard Disk Drive (HDD) storage product, SSD's are nearly impervious to impact damage and do not require or benefit from any kind of special vibration dampening or shock-proof enclosures. Kingston utilizes a textured rough-looking metal enclosure for their SSDNow V Solid State Drive series, which reveals the internal components after removing just four small counter-sunk Torx screws on the underside. Inside the Kingston SSDNow V 40GB SSD Boot Drive rests is a second-generation Intel PC29AS21BA0 controller, capable of improved performance and support for TRIM. The Intel SSD controller still uses ten parallel NAND channels for Flash DRAM.
Standard 2.5" drive bay mounting points are pre-drilled and threaded into the SSDNow V SSD, which allows for quick upgrade or addition into any existing notebook/netbook computer. The mounting positions matched up to the drive bracket on my laptop, and after only a few minutes of drive cloning I was quickly loading the Windows O/S. The Kingston SSD kit we received (SNV125-S2/40GB) also includes a 2.5" to 5.25" converter rails for a 3.5" bay desktop computer installation. Now that you're acquainted with the basic exterior features of the Kingston SSDNow V SSD, it's time to see what the SNV125 series is made of... SSD Testing MethodologySolid State Drives have traveled a long winding course to finally get where they are today. Up to this point in technology, there have been several key differences separating Solid State Drives from magnetic rotational Hard Disk Drives. While the DRAM-based buffer size on desktop HDD's has recently reached 32 MB and is ever-increasing, there is still a hefty delay in the initial response time. This is one key area in which flash-based Solid State Drives continually dominates because they lack moving parts to "get up to speed". However the benefits inherent to SSD's have traditionally fallen off once the throughput begins, even though data reads or writes are executed at a high constant rate whereas the HDD tapers off in performance. This makes the average transaction speed of a SSD comparable to the data burst rate mentioned in HDD tests, albeit usually lower than the HDD's speed. Comparing a Solid State Disk to a standard Hard Disk Drives is always relative; even if you're comparing the fastest rotational spindle speeds. One is going to be many times faster in response (SSD's), while the other is usually going to have higher throughput bandwidth (HDD's). Additionally, there are certain factors which can affect the results of a test which we do our best to avoid.
SSD Testing DisclaimerEarly on in our SSD coverage, Benchmark Reviews published an article which detailed Solid State Drive Benchmark Performance Testing. The research and discussion that went into producing that article changed the way we now test SSD products. Our previous perceptions of this technology were lost on one particular difference: the wear leveling algorithm that makes data a moving target. Without conclusive linear bandwidth testing or some other method of total-capacity testing, our previous performance results were rough estimates at best. Our test results were obtained after each SSD had been prepared using DISKPART or Sanitary Erase tools. As a word of caution, applications such as these offer immediate but temporary restoration of original 'pristine' performance levels. In our tests, we discovered that the maximum performance results (charted) would decay as subsequent tests were performed. SSDs attached to TRIM enabled Operating Systems will benefit from continuously refreshed performance, whereas older O/S's will require a garbage collection (GC) tool to avoid 'dirty NAND' performance degradation. It's critically important to understand that no software for the Microsoft Windows platform can accurately measure SSD performance in a comparable fashion. Synthetic benchmark tools such as HD Tach and PCMark are helpful indicators, but should not be considered the ultimate determining factor. That factor should be measured in actual user experience of real-world applications. Benchmark Reviews includes both bandwidth benchmarks and application speed tests to present a conclusive measurement of product performance. Test System
Drive Hardware TestedThe following storage hardware has been used in our benchmark performance testing, and may be included in portions of this article:
Test Tools
System Speed TestI doubt that when DOS was put to rest, Vladimir Afanasiev ever thought he would see his System Speed Test software used again in professional reviews. This program offers comprehensive system information, but it also has a powerful benchmarking tool for memory, processor, and disks. In terms of disk performance, it measures interface and physical transfer rates, seek and access times at the hardware level, and it does so without delay or interference from Operating System software or running processes. This is why Benchmark Reviews will continue to use this test: it polls its results directly from the hardware layer without the need for an Operating System (such as Windows). System Speed Test does not require a partition to be present for testing, so all of our Random Access Time benchmarks are completed prior to drive formatting. To detect the Random Access Time, each device runs the full test routine a total of five times. The highest and lowest scores were ignored, and the remainder was averaged. This would be prove pointless however, because the access time benchmark for every single SSD recorded identical test results between runs.
Using the System Speed Test software, the top Random Access Time benchmarks places the OCZ Agility-EX, Vertex-EX, Mtron Pro 7500, and ACARD ANS-9010 at the very top of our results. The 0.9 ms performers include: MemoRight GT, Intel X25-E Extreme, Mtron Pro 7000, Mtron MOBI 3500, Intel 80GB X25-M, and the OCZ Summit. With a Random Access Time of 10ms, the following SSDs were included: Corsair X256, OCZ Vertex Turbo, OCZ Vertex, Patriot Torqx, Super Talent UltraDrive ME, Crucial M225, OCZ Agility, and lastly the Mtron MOBI 3000. With a lightning-fast sub 0.1 ms access time, every other SSD is forced to live in the shadow that these nearly-instant products have just created. Some of the slower Random Access Times include the following SSD products: Kingston SSDNow V+ Series (Samsung PB22-J) with 0.14 ms, followed by the 40GB boot-drive SSDNow V at 0.16ms. The Silicon Power SLC SATA-II SSD SP032GBSSD750S25 with 0.17 ms, the OCZ Apex at 0.18 ms, the Patriot Warp v2 with 0.19 ms, and finally the G.Skill Titan finishing at 0.21 ms. There were slower SSD products, but obsolescence removed them from our results. The DRAM cache buffer is common link between request and response time. Solid State Drive devices have the advantage of a nearly instantaneous NAND storage bank responding to an even faster DRAM buffer. Conversely, Hard Disk Drive products depend on a fast spindle speed to reduce the delay before the buffer transmits data. Although the SSDs at the slower end of our Response Time chart may seem less impressive, in reality you couldn't begin to perceive these subtle differences in real-world applications. Still, the slowest SSD product (0.51ms) is 14x more responsive than the fastest desktop hard drive. Hard Disk Drive alternatives are much slower to react, regardless of spindle speed and cache buffer size. Even the very best of the desktop hard drive products, such as Western Digital's VelociRaptor, only produced a best response time of 7.15 ms. The older Western Digital Raptor took 8.53ms to respond, followed by 12.99ms for the Seagate 7200.11, and 15.39ms for the 7200 RPM Hitachi Travelstar 7K100 notebook drive. The worst performer was the standard 5400 RPM notebook drive (Hitachi Travelstar 5K160 HTS541640J9SA00), which recorded a painfully slow 17.41ms Random Access Time. Drive Hardware
ATTO Disk BenchmarkThe ATTO Disk Benchmark program is free, and offers a comprehensive set of test variables to work with. In terms of disk performance, it measures interface transfer rates at various intervals for a user-specified length and then reports read and write speeds for these spot-tests. There are some minor improvements made to the 2.34 version of the program, but the benchmark is still limited to non-linear samples up to 256MB. ATTO Disk Benchmark requires that an active partition be set on the drive being tested. While the bandwidth results are not realistic for determining the maximum drive speeds, ATTO Disk Benchmark is still a good tool for illustrating bandwidth using various file size chunks. Please consider the results displayed by this benchmark to be basic bandwidth performance indicators.
Our basic I/O bandwidth tests begin with the boot-drive SSD connected to the integrated Intel ICH10R Southbridge chip, as the ATTO Disk Benchmark tools performs file transfers ranging from 0.5 KB to 8192 KB. The Kingston SSDNow V 40GB SATA MLC SSD Boot Drive Kit SNV125-S2/40GB model reveals a 197 MBps read plateau starting from roughly 16-8192 KB file chunks, while the 47 MBps write performance plateaus from 2-8192 KB. The dip in read performance appeared in every test, but moved from one chunk size to another.
Drive Hardware
In our next section, Benchmark Reviews compares random access IOPS performance among high-end storage devices using HD Tune Pro... HD Tune Pro BenchmarksIn the past, Benchmark Reviews has avoided HD Tune benchmarks because the software was so similar to others already being used in our articles. However, EFD Software has released several versions of this program, which now adds functionality and features not available in previous revisions. The latest edition of HD Tune Pro allows random access read and write testing, a feature not available to other similar software benchmark tools. HD Tune is a low-level test that will not operate on a drive which contains a partition, so Benchmark Reviews uses DISKPART to prepare hardware and remove any partitions before conducting these tests. Random Access tests are divided into 512b, 4KB, 64KB, 1MB and random size test files sizes. The Random Access test measures the performance of random read or write operations. The amount of data which will be read varies from 512 bytes to 1 MB. Performance is reported in operations per second (IOPS), average access time, and average speed. Because it is our intent to compare one product against another, Benchmark Reviews has focused on random transfer size IOPS performance.
Benchmark Reviews has tested the Kingston SSDNow V 40GB SATA MLC SSD Boot Drive Kit SNV125-S2/40GB against a collection of top-performing desktop storage drives for our random IOPS benchmarks. The 4 KB random IOPS performance in HD Tune measured 6012 for read IO, and 16224 for write. In comparison, the 4KB read IOPS was only slightly behind Corsair's X256 SSD which scored 7444, and the Vertex Turbo's 7272. Both the Vertex Turbo (17358 4KB write IOPS) and Corsair X256 (16244) SSDs are only slightly ahead of the SSDNow V in terms of IOPS write performance.
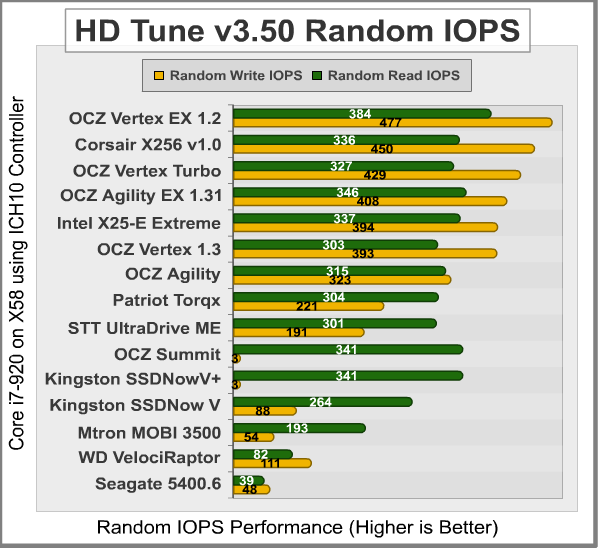
The tight range of IO is an indicator of operational bottlenecks. For example, the WD VelociRaptor WD3000HLFS SATA Hard Disk Drive indicates a read-IOPS range of 10-150 whereas the average SSD might offer 200-1,000. As a direct result, in most cases SSDs will offer a much higher IO over their hard disk counterparts. The random read/write operations per second is charted below:
The OCZ Vertex EX (firmware 1.20) enjoys the benefit of SLC construction that delivers traditionally better IOPS performance than MLC counterparts, and also offers the best measured random IOPS performance of the group with 384 read and 477 write IOPS. The Corsair X256 and OCZ Vertex Turbo (both MLC), along with the SLC Agility EX, all lead the pack of Indilinx-based SSDs which follow behind (Vertex, CT128M225, Torqx, UltraDrive ME, Agility) and performs at near-SLC levels with 327 read and 429 write IOPS. The Intel X25-E Extreme SSD performed well, and produced 337 random read IOPS, and 394 write. Our test results were obtained after each SSD had been prepared using the DISKPART program, and in the case of products using the Indilinx Barefoot controller they were further prepared with the Sanitary Erase application. In our tests, we discovered that the maximum performance results (charted) would decay as subsequent tests were performed. As a word of caution, applications such as Sanitary Erase (SE) and Wiper offer immediate but temporary restoration of original 'pristine' performance levels. Drive Hardware
Benchmark Reviews measures I/O Response Time and IOPS performance using the Iometer tool in our next section... Iometer IOPS PerformanceIometer is an I/O subsystem measurement and characterization tool for single and clustered systems. Iometer does for a computer's I/O subsystem what a dynamometer does for an engine: it measures performance under a controlled load. Iometer was originally developed by the Intel Corporation and formerly known as "Galileo". Intel has discontinued work on Iometer, and has gifted it to the Open Source Development Lab (OSDL). Iometer is both a workload generator (that is, it performs I/O operations in order to stress the system) and a measurement tool (that is, it examines and records the performance of its I/O operations and their impact on the system). It can be configured to emulate the disk or network I/O load of any program or benchmark, or can be used to generate entirely synthetic I/O loads. It can generate and measure loads on single or multiple (networked) systems. Benchmark Reviews has resisted publishing Iometer results because there are hundreds of different configuration variables available, making it impossible to reproduce our tests without having our Iometer configuration file. To measure random I/O response time as well as total I/O's per second, Iometer is set to use 4KB file size chunks over a 100% random sequential distribution. The tests are given a 50% read and 50% write distribution. Our charts show the Read and Write IOPS performance as well as I/O response time (measured in ms). Iometer was configured to test for 120 seconds, and after five tests the average is displayed in our benchmark results. The first tests included random read and write IOPS performance, where a higher I/O is preferred.
In the Random IOPS performance tests the single layer cell (SLC) OCZ Agility EX (3982/3988), Intel X25-E Extreme (3543/3548), and OCZ Vertex EX (3106/3091) outperformed all other products by a wide margin. The second-generation Intel PC29AS21BA0 controller fit inside the 40GB SSDNow V Boot Drive made a huge difference in IOPS performance over the previous version, and the V+. The OCZ Vertex Turbo SSD rendered 1774 read/1770 write I/O's, while the Corsair recorded 1769/1773, both of which are just slightly ahead of a single Vertex 1.3 SSD that produced 1702 for read and write IOPS. Sharing the same Indilinx Barefoot controller and NAND architecture, the Crucial CT128M225 SSD (Firmware 1571) reported a read and write I/O of 1695. The mainstream OCZ Agility SSD trails behind with 1625/1618 I/O's while the OCZ Summit MLC SSD completed 730/733 I/O's. Every other product thereafter performs far beneath the above-listed products, and are not suggested for high input/output applications. The 64GB Kingston SSDNow V+ (which is a rebranded Samsung PB22-J SSD) produced a meager 150 I/O's with Iometer. While offering better IO than any other desktop hard drive (and most first- and second-generation SSDs), the Western Digital VelociRaptor still fell short on IOPS performance compared with several current-generation SSDs and produced only 134/138 IO's. The Mtron MOBI 3000 performed 107 read and write IOPS, while the Western Digital WD5001AALS rendered 86 and the Seagate 7200.11 completing 77. The Seagate Momentus 5400.6, which is a 5400 RPM notebook hard drive, produced 60/59 IO's. The newer Mtron MOBI 3500 rendered 58 IOPS, which was worse than the older 3000 model. The OCZ Apex struggled to complete 9 IOPS, and its identically-designed G.Skill Titan managed only 8 IOPS. Clearly, the twin RAID-0 JMicron controllers are built for speed and not input/output operations. Next comes the average I/O response time tests...
The Iometer random IOPS average response time test results were nearly an inverse order of the IOPS performance results. It's no surprise that SLC drives perform I/O processes far better than their MLC versions, but that gap is slowly closing as controller technology improves the differences and enhances cache buffer space. The Read/Write IOPS performance for the 64GB OCZ Agility-EX SLC SSD was 0.19/0.06 ms, with the Intel X25-E Extreme SSD measuring 0.22/0.06 ms, while the OCZ Vertex EX (firmware 1.20) achieved 0.26/0.06 ms. Both of these premium MLC products share a dramatic lead ahead of the other SSDs tested, althought the Kingston SSDNow V 40GB Boot Drive SNV125-S2/40GB did extremely well with 0.38/0.07ms. The Corsair X256 and OCZ Vertex Turbo SSD both scored 0.50/0.06ms, while the Vertex 1.30 and Crucial CT128M225 SSD both offered 0.52/0.06ms. The mainstream Agility SSD produced 0.55/0.06ms, and the OCZ Summit responded to read requests in 0.78ms while write requests were a bit quicker at 0.59ms. Kingston's SSDNow V+ (Intel X25-M) produced 3.50/3.14 ms. The Western Digital VelociRaptor did very well compared against SSD products, producing 6.59/0.82ms. These times were collectively the best available, as each product measured hereafter performed much slower. The Mtron MOBI 3000 offered a fast 0.42ms read response time, but suffered a slower 8.97ms write response. Both the WD5001AALS and Seagate 7200.11 hard drives performed around 11ms read and 1.2ms write. The Seagate Momentus 5400.6 offered 15.3/1.36ms response times. Mtron's newer MOBI 3500 offered great read response times at 0.19ms, but suffered poor write responses at 17.19ms. The worst was yet to come, as the G.Skill Titan and OCZ Apex offered decent 0.42ms read response times but absolutely unacceptable 127ms write times. Drive Hardware
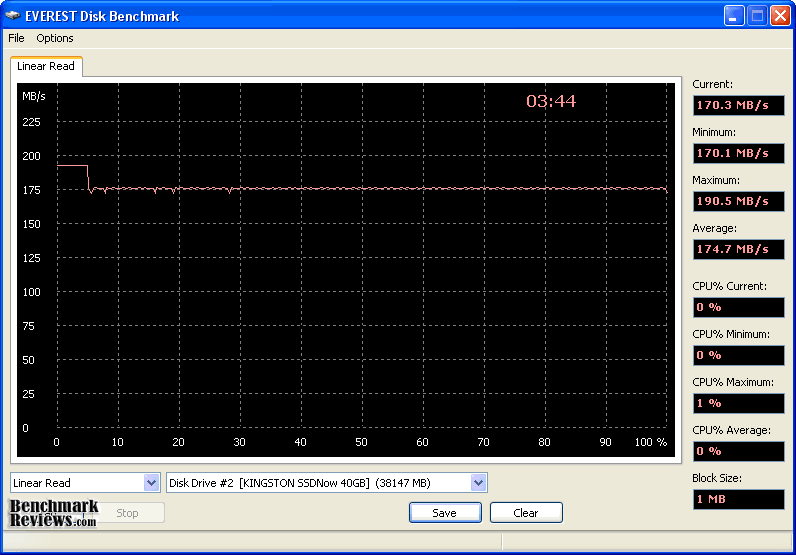
In our next section, we test linear read and write bandwidth performance and compare its speed against several other top storage products using EVEREST Disk Benchmark. Benchmark Reviews feels that linear tests are excellent for rating SSDs, however HDDs are put at a disadvantage with these tests whenever capacity is high. EVEREST Disk BenchmarkMany enthusiasts are familiar with the EVEREST benchmark suite by Lavalys, but very few are aware of the Disk Benchmark tool available inside the program. The EVEREST Disk Benchmark performs linear read and write bandwidth tests on each drive, and can be configured to use file chunk sizes up to 1MB (which speeds up testing and minimizes jitter in the waveform). Because of the full sector-by-sector nature of linear testing, Benchmark Reviews endorses this method for testing SSD products, as detailed in our Solid State Drive Benchmark Performance Testing article. However, Hard Disk Drive products suffer a lower average bandwidth as the capacity draws linear read/write speed down into the inner-portion of the disk platter. EVEREST Disk Benchmark does not require a partition to be present for testing, so all of our benchmarks are completed prior to drive formatting. The high-performance storage products tested with EVEREST Disk Benchmark are connected to the Intel ICH10R SATA controller resident on the Gigabyte GA-EX58-UD4P motherboard. Using the 1MB block size, read performance of the Kingston SSDNow V 40GB SATA MLC SSD Boot Drive Kit SNV125-S2/40GB measured an average 174.7 MBps with a maximum peak of 190.5 MBps. Linear write-to tests were next...
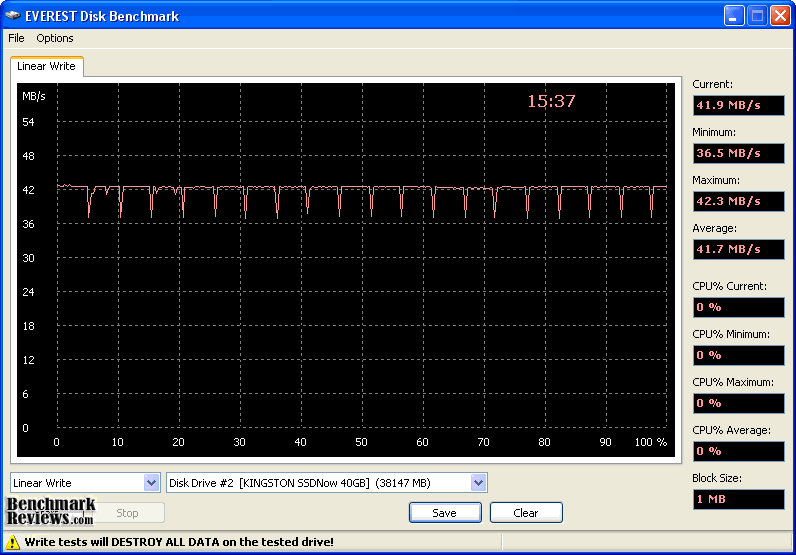
Linear disk benchmarks are superior tools in my opinion, because they scan from the first physical sector to the last. A side affect of many linear write-performance test tools is that the data is erased as it writes to every sector on the drive. Normally this isn't an issue, but it has been shown that partition tables will occasionally play a role in overall SSD performance (HDDs are more mature products and don't suffer this problem). The 64MB buffer and fast NAND flash memory on the Kingston SSDNow-V 40GB Boot Drive SNV125-S2/40GB helped improve results in our linear write testing, as shown in the waveform chart below. Although the chart makes the linear write performance appear unsteady, the results seen here are actually decent compared to most other SSD products we've tested in the past. The 40GB Kingston SSDNow V Boot Drive recorded an average linear write-to speed of 41.7 MBps, with a maximum performance of 42.3 MBps. Not very impressive numbers, and a downright poor write speed for any storage product.
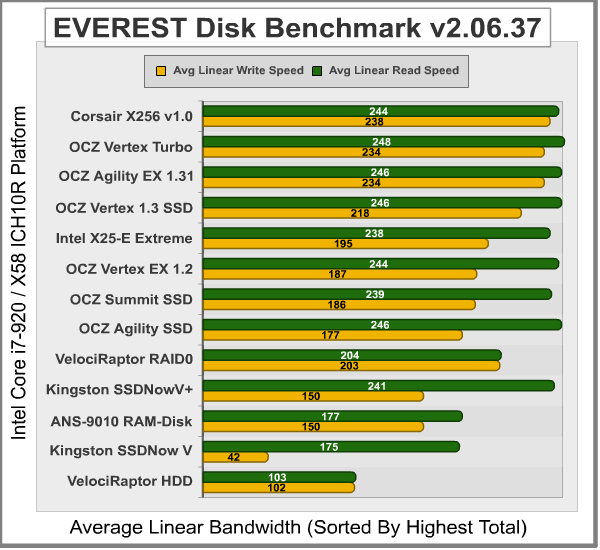
The chart below shows the average linear read and write bandwidth for a cross-section of other SATA drives attached to the Intel ICH10 Southbridge:
Linear bandwidth certainly benefits the Solid State Drive, since there's very little fluctuation in transfer speed. Hard Disk Drive products decline in performance as the spindle reaches the inner-most sectors on the magnetic platter. I personally consider linear tests to be the single most important comparison of storage drive products, although hard disk drive products decrease performance as they reach the edge of the spindle, SSD products operate at a relatively smooth speed from start to finish. Drive Hardware
In the next section, Benchmark Reviews tests sequential performance using the CrystalDiskMark software tool... CrystalDiskMark TestsCrystalDiskMark is a very basic read and write benchmark tool by Crystal Dew World that offers performance speed results using sequential, 512KB random, and 4KB random samples. For our tests, sequential read and write performance was measured using a 1000MB file size, with 50, 100, and 500MB being the other available options. CrystalDiskMark requires that an active partition be set on the drive being tested, and all drives are formatted with NTFS. Benchmark Reviews uses CrystalDiskMark to confirm manufacturer suggested bandwidth speeds. In addition to our other tests, the sequential read and write benchmarks allow us to determine if the maximum stated speed of any storage product is within reasonable specification. In the chart below illustrated below, our sequential read and write performance speeds are organized from highest to lowest based on total bandwidth. Enjoying a noticeable lead atop of our sequential performance chart, both the Intel X25-E Extreme (261/206 MBps) and the OCZ Vertex EX Single-Layer Cell SSD (256/182 MBps) and OCZ Agility EX (258/172 MBps) offer the highest read and write bandwidth performance. Followed closely behind was the OCZ Summit MLC SSD with 128MB cache buffer that produced 227/191 MBps, and the Corsair X256 which scored 255/156. Not far behind the top leaders was the OCZ Apex, and it's twin cousin the G.Skill Titan (not shown). The OCZ Vertex Turbo offered 248/145, which is slightly faster than the Kingston SSDNow V+ and standard Vertex SSD performance of 230/138. The Crucial CT128M225 is essentially identical to the OCZ Vertex, as is the Patriot Torqx and Super Talent UltraDrive ME. The OCZ Agility followed closely behind the other Indilinx Barefoot SSDs and shared the same sequential write speed penalty. The Kingston SSDNow V 40GB SSD Boot Drive Kit SNV125-S2/40GB stood out as a particular exception to the rule... having a fast 184 MBps read speed that would place it ahead of the WD VelociRaptor, and slightly behind the OCZ Agility SSD. The write speed was a different story, however. At 46 MBps, the 40GB SSDNow V is way below the performance of the Seagate 5400.6 notebook hard drive. Although the remaining drives are much older models, the SLC construction keeps the OCZSSD2, Mtron MOBI 3500, and MOBI 3000 all within respectable range. Even though the high-performance VelociRaptor hard drive is made to look low-end by the results charted below, it's actually very encouraging to see that a hard disk can still keep pace with a few SSDs. The WD VelociRaptor offers sequential read and write performance comparable to the Mtron MOBI 3500 and the first-generation OCZ SLC SSD.
Drive Hardware
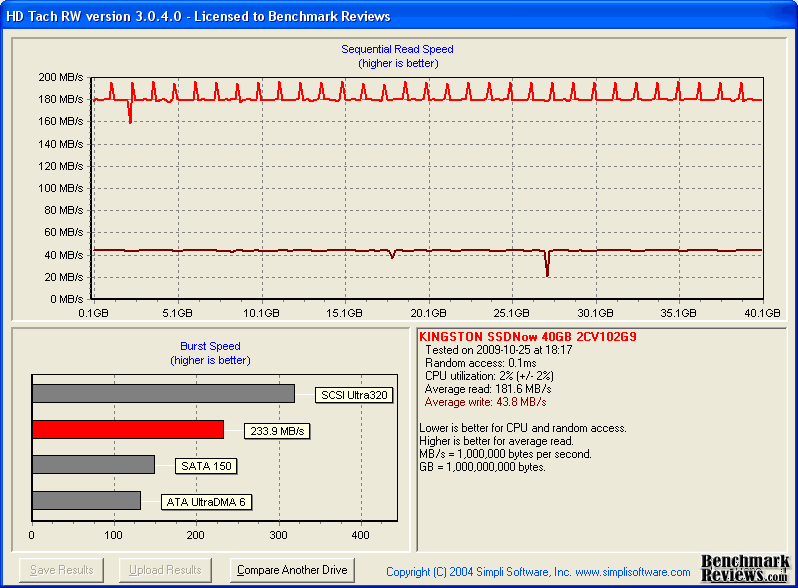
Benchmark Reviews tests and compares buffered transaction speed using HD Tach in the following section... HD Tach RW ResultsAlthough HD Tach (and also HD Tune or Crystal Disk Benchmark) are all excellent tools for measuring Hard Disk Drive products, they fail to offer the same precision with Solid State Drive products. These programs offer only an approximate estimate of bandwidth speed through their quick-result sample-testing mechanisms, as I have proven in the Solid State Drive (SSD) Benchmark Performance Testing article published not long ago. Nevertheless, HD Tach is still useful for offering an alternative perspective at performance, even if it isn't precisely correct when used with SSD architecture. HD Tach is a software program for Microsoft Windows that tests the sequential read, random access and interface burst speeds of the attached storage device. For the record. every single product tested was brand new and never used. HD Tach allows write-bandwidth tests only if no partition is present. Additionally, each and every product was tested five times with the highest and lowest results removed before having the average result displayed here. The graphical user interface (GUI) of the Windows-based benchmark tool HD Tach is very convenient. and allows the test product to be compared against others collected on your system or those registered into the Simpli Software database. HD Tach will not test write performance if a partition is present, so all of our benchmarks are completed prior to drive formatting. In the tests below, Benchmark Reviews utilizes the HD TachRW tool to compare the fastest collection of desktop hard drives and competing SSD's we can get our hands on. Using the Intel ICH10R SATA controller on the Gigabyte GA-EX58-UD4P, HD Tach was used to benchmark the test SSD five times with the best results displayed below. It's important to note that HD Tach's Burst Speed result should be ignored for Solid State Drives due to the cache methods inherent to each memory controller architecture. There are times where this number will be extremely high, which is a result of the optimized cache used for SSD's. The important numbers used for comparison are the sustained read and write bandwidth speeds, which indicate an approximate performance level of the product. Our featured test item, the Kingston SSDNow V 40GB SATA MLC SSD Boot Drive Kit SNV125-S2/40GB, performed at an average 181.6 MBps best sustained average read speed and a best average sustained write bandwidth of only 43.8 MBps. By this point, the results indicate that performance is focused on the SSDs read speed while neglecting writes as a trade-off.
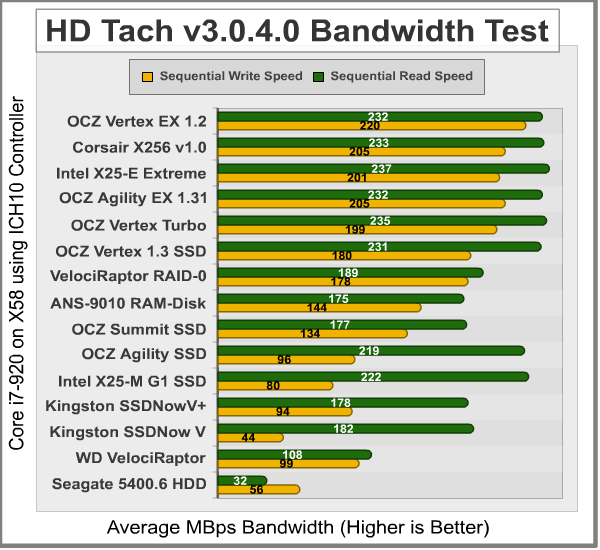
The chart below illustrates the collected averages for benchmark results using HD Tach RW on the Intel ICH10 SATA controller, with the read and write bandwidth results added together to determine rank placement. The first group is a collection of high-performance storage products. With an improved write performance, the SLC Vertex EX finds itself positioned in first place with the Corsair X256, Intel X25-E Extreme, and OCZ Agility EX SSDs all tied second, ahead of the MLC Vertex Turbo and several other Indilinx Barefoot-based SSDs. (Crucial M225, OCZ Vertex, Patriot Torqx, Super Talent UltraDrive, and Agility). A set of Western Digital VelociRaptor hard drives paired into a RAID-0 stripe array come close, but just aren't enough to stave off SSD performance. The ACARD ANS-9010 RAM-Disk, OCZ Summit SSD, OCZ Agility SSD, OCZ Apex SSD, Intel X25-M, and Kingston SSDNow V+ SSD all trail behind in overall performance and finish out the top five positions. Nearly every other storage product trails distantly behind these leaders, which all recorded a combined HD Tach bandwidth to over 300 MBps for each. A single (non RAID-0) VelociRaptor and Seagate 7200.11 hard drive begin the next segment of upper midrange performers, offering nearly 200 MBps of combined bandwidth. Trailed by a closely-packed group consisting of the Patriot Warp v2 SSD, Silicon Power SP032GBSSD750S25, and G.Skill FM-25S2S-64GB, are SSDs generating between 168-172 MBps of combined average bandwidth.
The lower-midrange SSD products begin with the Western Digital Raptor, scoring a combined total bandwidth of 154 MBps delivering half the performance of the leaders. Yesterday's high-performance SSD is today's low-performance drive, and the Mtron MOBI 3500, OCZ OCZSSD2-1S32G SSD, Super Talent MasterDrive MX SSD and Mtron MOBI 3000 all comprise products with less combined performance than Hard Disk Drive alternatives (except in regard to response time). Drive Hardware
Please continue on to the Final Thoughts sections, where the state of SSD testing and Data Storage market sector are put under analysis... SSD vs Hard Disk DriveThe last days of old technology are always better than the first days of new technology. Never has this saying been more true than with the topic of storage technology, specifically in regard to the introduction of Solid State Drive technology a few years ago. The only things standing in the way of widespread Solid State Drive (SSD) adoption are high storage capacity and affordable price of Hard Disk Drive (HDD) devices. Because NAND flash-based SSD technology costs more per gigabyte of capacity than traditional magnetic hard drives, the benefits of immediate response time, transfer speeds, and operational input/output performance often get overlooked. Like most consumer products, it wasn't a question of how much improvement was evident in the new technology, it was price. I'll discuss product costs more in just a moment, but for now consider how each new series of SSD product employs greater performance than the one before it, convincing would-be consumers into waiting for the right time to buy. There's also a gray area surrounding SSD performance benchmarks that has me concerned. You might not know this, but SSDs can be very temperamental towards the condition of their flash NAND. My experience testing dozens of Solid State Drives is that a freshly cleaned device (using an alignment tool) will always outperform the same device once it's been formatted and used. A perfect example is Indilinx Barefoot-based SSDs, which suffers severely degraded performance when writing to 'dirty' flash NAND. The reason that all of this will matters is simple: the performance results reported to consumers in product reviews (such as this one) often report the very best performance scores, and the process used to obtain these results is not applicable to real-world usage. This is where garbage collection techniques such as TRIM become important, so that end-users will experience the same performance levels as we do in our tests.
Garbage Collection (GC) is the current solution for keeping flash NAND in 'clean' condition, while maintaining optimal performance. Windows 7 offers native TRIM support, and most retail SSDs also include this special GC function or at least offer a firmware update that brings the drive up-to-date. For anyone using an Operating System or SSD that does not offer Garbage Collection functionality, you'll be using 'dirty' flash NAND modules and suffering sub-optimal performance for each write-to request. A few SSD manufacturers offers free tools to help restore peak-level performance by scheduling GC to 'clean' used NAND sectors, but these tools add excessive wear to the NAND the same way disk defragmenting tools would. SLC flash modules may resist wear much better than MLC counterparts, but come at the expense of increased production cost. The best solution is a more durable NAND module that offers long-lasting SLC benefits at the cost of MLC construction. Adoption is further stalled because keen consumers aware of this dilemma further continue their delay into the SSD market. Getting back to price, the changes in cost per gigabyte have come as often as changes to the technology itself. At their inception, high-performance models such the 32GB MemoRight GT cost $33 per gigabyte while the entry-level 32GB Mtron MOBI 3000 sold for $14 per gigabyte. While an enjoyable decline in NAND component costs forced consumer SSD prices down low in 2009, the price of SSD products has been on the rise during 2010. Nevertheless, Solid State Drives continue to fill store shelves despite price or capacity, and there are a few SSD products now costing only $2.03 per gigabyte. Although the performance may justify the price, which is getting dangerously close to the $1.00 per gigabyte WD VelociRaptor hard drive, costs may still close some buyers out of the market. Price notwithstanding, the future is in SSD technology and the day when HDDs are obsolete is nearing; but there are still a few bumps in the road to navigate. Kingston SSDNow V ConclusionBenchmark Reviews begins our conclusion with a short summary for each of the areas that we rate. The first section is performance, which considers how effective the Kingston SSDNow V 40GB Boot Drive SSD performs in operations against direct competitor products. For reference, Kingston specifies that the model SNV125-S2/40GB Solid State Drive should offer a maximum 170 MBps read and 40 MBps write performance. In many of our benchmark tests, the 40GB SSDNow V Boot Drive SSD performed at or above this rating. The SNV125-S2/40GB model offered its highest performance of 197/47 MBps in ATTO Benchmark, trailed by 184/46 MBps in Crystal DiskMark, then 182/44 MBps in HD-Tach, and finally 175/42 MBps read/write in Everest. IOPS performance was extremely high in Iometer and HD-Tune, and the Kingston 40GB Boot Drive SSD trailed only three products (all SLC SSDs): the Agility EX (firmware 1.31), Intel X25-E Extreme, and OCZ Vertex EX. Solid State Drives are low-visibility products: you see them just long enough to install and then they're forgotten. Despite this, Kingston has taken the added step of upgrading the SSD enclosure from the standard black painted chassis used on nearly all other SSD products, and uses a textured metal finish. Because Solid State Drives, like their Hard Disk Drive counterparts, are meant to place function before fashion, anything above and beyond a simple metal shell is more than what's expected of the appearance. To this end I still wish manufacturers would return to using sealed plastic enclosures (such as the MOBI 3000) to prevent moisture or electrical shock damage, though the trend doesn't seem likely. Construction is probably the strongest feature credited to the entire SSD product segment, and Kingston Solid State Drive products are no exception. Solid State Drives are by nature immune to most abuses, but add to this a hard metal shell and you have to wonder what it would take to make this drive fail. If a Kingston SSDNow V+ product fails during the limited 3-year warranty period, end-users can contact Kingston Technology via the company support website. Fortunately, there's also a toll-free telephone number for support or customer service questions (800-435-0640). Benchmark Reviews has tested the 40GB Kingston SSDNow V Solid State Boot Drive, and the performance results were surprising. Based on the results of several benchmark tests, the SSDNow V "Boot Drive" delivers a noteworthy 0.16 ms response time which assures a nearly-instant reaction time, and the SNV125-S2/40GB model showed absolutely no sign of data read/write stuttering during our tests. The second-generation Intel PC29AS21BA0 SSD controller really improved IOPS performance over earlier predecessors and matching high-dollar SLC counterparts. As for speed, the read-to performance was very good and averaged 180MBps, but write-to speed lagged well behind every other product tested with only an average of 45 MBps. For most users, especially casual computer users or gamers, this won't matter in the least big. For those who plan to save files to the 40GB Kingston SSD Boot Drive, you should consider something with a little more capacity. As of November 2009, the Kingston 40GB SSDNow Value Solid State Boot Drive is currently sold at NewEgg for $129.99 with another $20 off for a mail-in rebate. Further searching with our Price Comparison Tool found better pricing on the SNV125-S2/40GB model for around $105, so make sure to shop around for the best deal. Clearly, the Kingston SSDNow V 40GB is one of the best deals going for Solid State Drives. For what it is, and what it's meant to do, the Kingston SSDNow V 40GB 'Boot Drive' SSD is an amazing value. With only 40GB of storage capacity, this SSD will hold the Operating System and a large installation base of games and applications, but music and video should be stored elsewhere (which is a good idea anyway). The 180MBps read speed is dead-average for consumer SSDs at this time, but the 45MBps write speeds we received were the lowest ever reported. Putting capacity into perspective, it might not matter if the sustained write speeds were ever lower because it's not as if there will be many situations where it becomes a drawback. In conclusion, the Kingston SNV125-S2/40GB Boot Drive is an excellent 'first-SSD' upgrade. Desktop and notebook users alike can take advantage of Solid State Drive performance without the price tag that normally comes with it. Pros:
|
||||||||||||||||||||||||||||||||||||||||||||||||||||||||||||||||||||||||||