OCZ Vertex Turbo SSD
With generation 3 guidelines for the 6.0 GBps SATA interface already being used in prototype motherboards for show at the not-so-distant 2010 CES in January, it's understandable to see the speeds of Solid State Drive products increase so quickly with each new model. The Indilinx Barefoot controller has become the backbone chip for over a dozen different SSD models, first introduced in the OCZ Vertex SSD, and now make a return appearance in the OCZ Vertex Turbo SSD series.
Identical to the popular OCZ Vertex SSD in every aspect except NAND selection, the Vertex Turbo SSD series offers the same Indilinx 'Barefoot' controller and 64MB of DRAM buffer, but now boasts ultra-fast 270/200 MBps read and write speeds. Benchmark Reviews tests the reaction time and bandwidth performance for the 120GB OCZ Vertex Turbo SSD OCZSSD2-1VTXT120G model against over two dozen other storage products in this article.
Anyone familiar with articles published at Benchmark Reviews is very well aware of our obsession with Solid State Drive technology. They're complex, and every SSD is different than the next. Nothing like Hard Disk Drive technology, which improves as spindle speed and cache buffer are increased, SSDs are the future and because of this their internal architecture is constantly evolving. This is why we offer so much coverage on the topic: it's interesting and exciting. Plus, they can turn the average computer system into a roaring beast. It's not marketing hype; for once the truth is stranger than fiction.

Since first making a public debut at the 2007 Consumer Electronics Show, Solid State Drives (SSD's) have been a topic of hot discussion among performance enthusiasts. These nonvolatile flash memory-based drives feature virtually no access time delay and promise a more reliable storage medium with greater performance while operating at a fraction of the power level. Moving into 2008, SSDs became a consumer reality for many performance-minded power users. Now that 2009 has proven how strong the industry support behind Solid State Drive technology is, we should hope that mainstream acceptance moves faster than it did for DDR3 SDRAM.
Solid State Drive products are no longer restricted to bleeding edge hardware enthusiasts or wealthy elitists. Heading into 2009, SSD storage devices were available online for nearly $2 per gigabyte of storage capacity while the most popular performance desktop hard drive hovered just above $1/GB. While most consumers are waiting for that day when SSD costs the same as HDD, they seem to be forgetting how Solid State Drives have already surpassed Hard Disk performance in every other regard. Our collection of SSD reviews is a good starting point for comparing the competition.
SSD Testing Disclaimer
Early on in our SSD coverage, Benchmark Reviews published an article which detailed Solid State Drive Benchmark Performance Testing. The research and discussion that went into producing that article changed the way we now test SSD products. Our previous perceptions of this technology were lost on one particular difference: the wear leveling algorithm that makes data a moving target. Without conclusive linear bandwidth testing or some other method of total-capacity testing, our previous performance results were rough estimates at best.
Our test results were obtained after each SSD had been prepared using DISKPART or Sanitary Erase tools. As a word of caution, applications such as these offer immediate but temporary restoration of original 'pristine' performance levels. In our tests, we discovered that the maximum performance results (charted) would decay as subsequent tests were performed. SSDs attached to TRIM enabled Operating Systems will benefit from continuously refreshed performance, whereas older O/S's will require a garbage collection (GC) tool to avoid 'dirty NAND' performance degradation.
It's critically important to understand that no software for the Microsoft Windows platform can accurately measure SSD performance in a comparable fashion. Synthetic benchmark tools such as HD Tach and PCMark are helpful indicators, but should not be considered the ultimate determining factor. That factor should be measured in actual user experience of real-world applications. Benchmark Reviews includes both bandwidth benchmarks and application speed tests to present a conclusive measurement of product performance.
OCZ Technology Group, a member of JEDEC, designs, develops and manufactures ground-breaking, high performance memory and computer components that set industry standards. OCZ products are the first choice for users needing high-reliability, ultra-high performance solutions. In 2007, PC Power & Cooling and Hypersonic PC were brought into the OCZ Technology Group, forming a well-rounded, highly innovative organization that places the company at the forefront of high-end computing. All of OCZ Technology Group's products are available through its worldwide network of distributors, online resellers and retail stores.
Vertex Turbo Features
OCZ Vertex Turbo Series provides a cutting-edge design for enthusiasts looking to transform their desktops or laptops. Enabled by a proprietary firmware and 64MB of 180MHz DRAM cache, the Vertex Turbo Edition ramps up performance levels to new heights, while providing the snappy computing, longer battery life, and shorter boot-ups users have enjoyed from the original. The Vertex Turbo delivers best-in-class read and write speeds clocking in at up to 270MB/s read and 210MB/s write along with the lower power consumption and superior durability compared to conventional hard drives.
The tried-and-true architecture and performance of the original Vertex has been upgraded to meet the demands of enthusiasts and other performance-seeking users who benefit from SSD technology. The Vertex Turbo Series maximizes the potential for ultimate productivity and state-of-the-art computing experience, by increasing both the host clock-speed and the SDR DRAM Cache to 180MHz versus 166MHz on the original series.
Available in capacities of 30GB (32), 60GB (64), 120GB (128), and 250GB (256), Vertex Turbo SSDs offers ample room for all your data and comes backed with an industry leading 3 Year Warranty and OCZ's exemplary service and support.
|
Series
|
Vertex EX
|
Agility EX
|
Vertex Turbo
|
Summit
|
Vertex
|
Apex
|
Agility
|
Solid 2
|
Solid
|
|
Capacities (GB)
|
64, 128
|
64
|
32, 64, 128, 256
|
32, 64, 128, 256
|
32, 64, 128, 256
|
64, 128, 256
|
32, 64, 128
|
64, 128
|
32, 64, 128, 256
|
|
NAND
|
SLC
|
SLC
|
MLC
|
MLC
|
MLC
|
MLC
|
MLC
|
MLC
|
MLC
|
|
Controller
|
Indilinx
|
Indilinx
|
Indilinx
|
Samsung
|
Indilinx
|
Dual JMicron
|
Indilinx
|
Indilinx
|
JMicron
|
|
Cache
|
64MB
|
64MB
|
64MB
|
128MB
|
64MB
|
N/A
|
64MB
|
N/A
|
N/A
|
|
Read Speed
|
Up to 260MB/s
|
Up to 255MB/s
|
Up to 270MB/s
|
Up to 220MB/s
|
Up to 250MB/s
|
Up to 230MB/s
|
Up to 230MB/s
|
Up to 125MB/s
|
Up to 155MB/s
|
|
Write Speed
|
Up to 210MB/s
|
Up to 195MB/s
|
Up to 200MB/s
|
Up to 200MB/s
|
Up to 160MB/s
|
Up to 160MB/s
|
Up to 135MB/s
|
Up to 100MB/s
|
Up to 90MB/s
|
|
Firmware Jumper
|
Yes
|
Yes
|
Yes
|
No
|
Yes
|
No
|
Yes
|
Yes
|
No
|
As of October 2009 the OCZ SSD family includes the following products from top to bottom:
-
OCZ Vertex EX SLC enterprise SSD featuring read performance up to 260 MBps and write bandwidth up to 210 MBps. High Reliability is based on 6, 12, 16-bits/sector correctable by the internal BCH mode.
-
OCZ Agility EX SLC enterprise SSD featuring read performance up to 255 MBps and write bandwidth up to 195 MBps. High Reliability is based on 6, 12, 16-bits/sector correctable by the internal BCH mode.
-
OCZ Vertex Turbo Series premium enthusiast SSD featuring read performance up to 270 MBps and write bandwidth up to 200 MBps. High Reliability is based on 6, 12, 16-bits/sector correctable by the internal BCH mode.
-
32GB OCZ Vertex (OCZSSD2-1VTXT30G)
-
64GB OCZ Vertex (OCZSSD2-1VTXT60G)
-
128GB OCZ Vertex (OCZSSD2-1VTXT120G)
-
256GB OCZ Vertex (OCZSSD2-1VTXT250G)
-
OCZ Summit Series MLC enthusiast/enterprise SSD featuring read performance up to 220 MBps and write bandwidth up to 200 MBps. High Reliability is based on 6, 12, 16-bits/sector correctable by the internal BCH mode.
-
64GB OCZ Summit (OCZSSD2-1SUM60G)
-
128GB OCZ Summit (OCZSSD2-1SUM120G)
-
256GB OCZ Summit (OCZSSD2-1SUM250G)
-
OCZ Vertex Series premium SSD featuring read performance up to 250 MBps and write bandwidth up to 160 MBps. High Reliability is based on 6, 12, 16-bits/sector correctable by the internal BCH mode.
-
32GB OCZ Vertex (OCZSSD2-1VTX30G)
-
64GB OCZ Vertex (OCZSSD2-1VTX60G)
-
128GB OCZ Vertex (OCZSSD2-1VTX120G)
-
256GB OCZ Vertex (OCZSSD2-1VTX250G)
-
OCZ Apex Series SSD with new RAID-0 internal architecture featuring read performance up to 230 MBps and write bandwidth up to 160 MBps. High reliability is based on the internal 15bit BCH mode.
-
32GB OCZ Apex (OCZSSD2-1APX30G)
-
64GB OCZ Apex (OCZSSD2-1APX60G)
-
128GB OCZ Apex (OCZSSD2-1APX120G)
-
256GB OCZ Apex (OCZSSD2-1APX250G)
-
OCZ Agility Series mainstream SSD featuring read performance up to 230 MBps and write bandwidth up to 135 MBps. High Reliability is based on 6, 12, 16-bits/sector correctable by the internal BCH mode.
-
32GB OCZ Agility (OCZSSD2-1AGT30G)
-
64GB OCZ Agility (OCZSSD2-1AGT60G)
-
128GB OCZ Agility (OCZSSD2-1AGT120G)
-
OCZ Solid 2 Series mainstream consumer SSD featuring read performance up to 125 MBps and write bandwidth up to 100 MBps. High reliability is based on the internal BCH 15bit ECC.
-
OCZ Solid Series value SSD featuring read performance up to 155 MBps and write bandwidth up to 90 MBps. High reliability is based on the internal BCH 15bit ECC.
-
32GB OCZ Solid (OCZSSD2-1SLD30G)
-
64GB OCZ Solid (OCZSSD2-1SLD60G)
-
128GB OCZ Solid (OCZSSD2-1SLD120G)
-
256GB OCZ Solid (OCZSSD2-1SLD250G)
OCZSSD2-1VTXT120G Specifications
-
Available in 32GB, 64GB, 128GB, and 256GB capacities
-
Read: up to 270 MB/sec
-
Write: up to 200 MB/sec
-
Seek: <.1ms
-
Onboard Cache: 180MHz 64MB
-
Slim 2.5" Design
-
99.8 x 69.63 x 9.3mm
-
Lightweight 77g
-
Operating Temp: 0C ~ +70C
-
Storage Temp: -45C ~ +85C
-
Low Power Consumption
-
Shock Resistant 1500G
-
MTBF 1.5 million hours
-
3-Year warranty
First Look: Vertex Turbo SSD
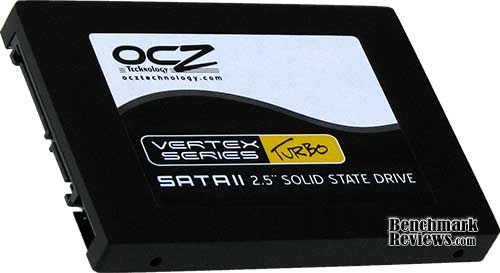
When it comes to the appearance of notebook drives, it must be understood that the product you're looking at will be hidden away from plain view once it gets installed. Keeping in mind that this product is solid state, and therefore has no moving parts, it takes some extra-special attention to product presentation in order to help keep the consumer feeling comfortable with their premium purchase. OCZ does their very best to make each new SSD product as appealing as the last, and even though the Vertex Turbo is a premium high-performance SSD it's essentially identical to every other Solid State Drive product OCZ makes.
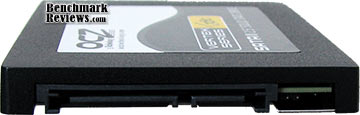
Unlike desktop computers which utilize a SATA cable system to connect drive to motherboard, nearly all notebooks allow the 2.5" drive to simply slide directly into a connection bay within the system. In addition to notebooks and desktop computer usage, this OCZ Vertex Turbo MLC Solid State Drive can be utilized for mission-critical backups or high-abuse data systems, but it's real focus is high-performance speed. Most Indilinx-based SSDs include a two-pin jumper for flashing firmware updates onto the controller, which is obsolete with newer firmware (that updates without a jumper shunt). One unfortunate omission from all recent OCZ SSD products is the integrated High-Speed USB 2.0 Mini-B seen on Solid State Drive product models elsewhere.
Unlike the average Hard Disk Drive (HDD) storage product, SSD's are nearly impervious to impact damage and do not require or benefit from any kind of special vibration dampening or shock-proof enclosures. OCZ utilizes a flat-black metal enclosure for nearly all of their Solid State Drive products, including the Vertex Turbo SSD series, which reveals the internal components after removing just four small counter-sunk screws on the underside.
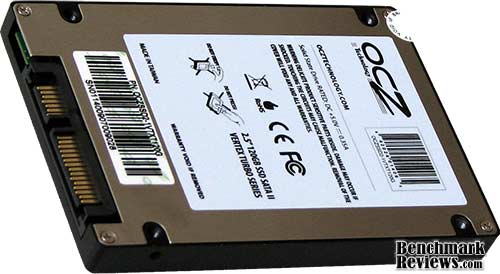
Standard 2.5" drive bay mounting points are pre-drilled and threaded into the Vertex Turbo SSD, which allows for quick upgrade or addition into any existing notebook or desktop system. The mounting positions matched up to the drive bracket on my laptop, and after only a few minutes of drive cloning I was quickly loading Windows O/S. The OCZ Vertex Turbo SSD does not include a 2.5" to 5.25" converter tray with the kit, as we've seen other manufacturers begin to include.
Now that you're acquainted with the basic exterior features of the OCZ Vertex Turbo SSD, it's time to peek inside the OCZSSD2-1VTXT120G enclosure and inspect the internal components...
Indilinx Barefoot SSD Components
OCZ has designed their Vertex Turbo Solid State Drive to use the exact same architecture and components as the previous OCZ Vertex SSD series which it will eventually replace, with the NAND flash modules being the only difference between the two products. Benchmark Reviews has discovered that OCZ does not use one single brand of NAND for the Vertex Turbo series, and that the modules could be from one of several different major manufacturers, depending on the model and construction date. For this Internal Components section, we have re-used content from the original OCZ Vertex series review.
Intermittent and delayed response cycles (stuttering) from Solid State Drive products is not entirely wide-spread among all MLC SSDs, but it has become a big-enough issue among most affordable SSD products that many are well-aware of the phenomenon. Consumers first experienced the bitter taste of stuttering SSD performance with the OCZ Core Series (v1) SSD, although it has also been reported with the G.Skill MLC SSD and Patriot Warp v2. The phenomenon occurs when the drives buffer is filled faster than it can read or write data, and was prevalent among first-generation JMicron JMF602 SSD controllers.
In our OCZ Apex SSD article, Benchmark Reviews detailed how the JMicron JMB390 RAID controller managing a pair of JMF602(B) SSD controllers into a RAID-0 striped array was able to overcome the 'stutter' experienced in MLC drives... at least in read-from functions. OCZ has returned to traditional methods of delivering performance with their latest and greatest Solid State Drive: the OCZ Vertex Turbo. But how will the Vertex Turbo SSD produce read-from and write-to bandwidth on par with the RAID-0 Apex without all the new architecture? The secret lies within a larger buffer, and the retirement of JMicron controllers (at least for this product series) in place of the new Indilinx ARM7 micro-controller.

To the untrained eye, the OCZ Vertex Turbo SSD looks like every other Solid State Drive you've probably seen when the internal components have been exposed. There's a collective bank of NAND modules, usually with Samsung markings, followed by the SATA controller chip. OCZ had decided to use Indilinx to deliver the SATA controller interface, since their 'Barefoot' chip was production-ready to be paired with a large cache months ago, while JMicron is still a few months away with their successor to the JMF602B chip.

While the internal NAND flash DRAM on the OCZ Vertex is comprised of Samsung K9HCG08U1M-PCB00 IC parts (pictured below) which bare the branding mark K9HCG08U1M PCB0, the Vertex Turbo premium high-performance series SSD uses several different manufactures to supply the fastest NAND modules available. These lead-free RoHS-compliant 48-pin ICs are multi-layer, with one IC directly atop another to offer 64GB in 8x organization for the 120GB OCZSSD2-1VTXT120G model.

Indilinx claims that their IDX110M00-FC 'Barefoot' chip offer a maximum read speed 230 MBps and supports the capacity up to 512GB with multi-level cell (MLC) NAND flash, but really this limit was based off of early generation chips. The Indilinx (IDX110) Barefoot SSD controller chip is touted as delivering bandwidth over 200 MBps and random input-output (IO) of 20,000/s into various servers such as on-line transaction processing (OLTP) and streaming server units. These figures are NAND-flash dependant, which is why Vertex Turbo series SSDs offer improved speed when compared to the original Vertex series.

A single Elpida 64MB SDRAM module is marked with S51321CBH-7BTT-F, but the actual Elpida part number is EDS51321CBH, which is a 133MHz (CL3-3-3) mobile RAM component. This 64MB cache buffer helps improve small write-to performance and removes the 'stuttering' effect from the entire Vertex (and Vertex Turbo) SSD series.

In the next section, Benchmark Reviews begins performance testing the OCZ Vertex Turbo Solid State Drive, and we determine just how well the new Indilinx Barefoot-based SSD compares to the previous best-performing competition.
SSD Testing Methodology
Solid State Drives have traveled a long winding course to finally get where they are today. Up to this point in technology, there have been several key differences separating Solid State Drives from magnetic rotational Hard Disk Drives. While the DRAM-based buffer size on desktop HDD's has recently reached 32 MB and is ever-increasing, there is still a hefty delay in the initial response time. This is one key area in which flash-based Solid State Drives continually dominates because they lack moving parts to "get up to speed".
However the benefits inherent to SSD's have traditionally fallen off once the throughput begins, even though data reads or writes are executed at a high constant rate whereas the HDD tapers off in performance. This makes the average transaction speed of a SSD comparable to the data burst rate mentioned in HDD tests, albeit usually lower than the HDD's speed.
Comparing a Solid State Disk to a standard Hard Disk Drives is always relative; even if you're comparing the fastest rotational spindle speeds. One is going to be many times faster in response (SSD's), while the other is usually going to have higher throughput bandwidth (HDD's). Additionally, there are certain factors which can affect the results of a test which we do our best to avoid.
EDITORS NOTE: After November 2009 Benchmark Reviews will begin testing storage devices using the Microsoft Windows 7 Operating System. Although the Marvell SATA 6Gb/s (SATA-III) controller is available on select motherboards, our testing indicates that SSD devices perform better on the Intel ICH-10 Southbridge.
SSD Testing Disclaimer
Early on in our SSD coverage, Benchmark Reviews published an article which detailed Solid State Drive Benchmark Performance Testing. The research and discussion that went into producing that article changed the way we now test SSD products. Our previous perceptions of this technology were lost on one particular difference: the wear leveling algorithm that makes data a moving target. Without conclusive linear bandwidth testing or some other method of total-capacity testing, our previous performance results were rough estimates at best.
Our test results were obtained after each SSD had been prepared using DISKPART or Sanitary Erase tools. As a word of caution, applications such as these offer immediate but temporary restoration of original 'pristine' performance levels. In our tests, we discovered that the maximum performance results (charted) would decay as subsequent tests were performed. SSDs attached to TRIM enabled Operating Systems will benefit from continuously refreshed performance, whereas older O/S's will require a garbage collection (GC) tool to avoid 'dirty NAND' performance degradation.
It's critically important to understand that no software for the Microsoft Windows platform can accurately measure SSD performance in a comparable fashion. Synthetic benchmark tools such as HD Tach and PCMark are helpful indicators, but should not be considered the ultimate determining factor. That factor should be measured in actual user experience of real-world applications. Benchmark Reviews includes both bandwidth benchmarks and application speed tests to present a conclusive measurement of product performance.
Test System
Drive Hardware Tested
-
-
Crucial / Lexar 32GB 2.5" SATA-2 SSD CT32GBFAB0
-
Crucial / Lexar 120GB SATA-II SSD CT128M225 (Firmware 1571)
-
-
-
Hitachi Travelstar 5K160 2.5" 40GB SATA 5,400 RPM HDD HTS541640J9SA00 (8MB Cache Buffer)
-
Hitachi Travelstar 7K100 2.5" 60GB SATA 7,200 RPM HDD HTS721060G9SA00 (8MB Cache Buffer)
-
-
Kingston 80GB SATA SSD SSDSA2MH080G1GC
-
-
-
-
-
-
-
-
-
-
-
-
-
-
-
-
-
-
Samsung 64GB 2.5" SATA-2 SSD MCCOE64G5MPP-0VA
-
Seagate Momentus 5400.6 320GB ST9320325AS 2.5" 5,400 RPM SATA-II Hard Disk Drive
-
Seagate 7200.11 500GB 3.5" ST3500320AS 7,200 RPM SATA-II Hard Disk Drive (32MB Cache Buffer)
-
-
-
-
-
Western Digital Raptor 74GB 3.5" WD740ADFD 10,000 RPM SATA Hard Disk Drive (16MB Cache Buffer)
-
Western Digital VelociRaptor 150GB WD1500HLFS 10,000 RPM SATA Hard Disk Drive (16MB Cache Buffer)
-
Western Digital VelociRaptor 300GB WD3000HLFS 10,000 RPM SATA Hard Disk Drive (16MB Cache Buffer)
Test Tools
-
System Speed Test v4.78 by Vladimir Afanasiev: Accurately measures random access response time
-
ATTO Disk Benchmark v2.34: Spot-tests static file size chunks for basic I/O bandwidth
-
HD Tune Pro v3.5 by EFD Software: Measured random access IOPS and speed
-
Iometer 2006.07.27 by Intel Corporation: Tests IOPS performance and I/O response time
-
EVEREST Ultimate Edition v5.00.1650 by Lavalys: Disk Benchmark component tests linear read and write bandwidth speeds
-
CrystalDiskMark v2.2 by Crystal Dew World: Sequential speed benchmark spot-tests various file size chunks
-
HD Tach RW v3.0.4.0 by Simpli Software: Measures approximate buffered read and write bandwidth speeds
System Speed Test
I doubt that when DOS was put to rest, Vladimir Afanasiev ever thought he would see his System Speed Test software used again in professional reviews. This program offers comprehensive system information, but it also has a powerful benchmarking tool for memory, processor, and disks. In terms of disk performance, it measures interface and physical transfer rates, seek and access times at the hardware level, and it does so without delay or interference from Operating System software or running processes. This is why Benchmark Reviews will continue to use this test: it polls its results directly from the hardware without the need for Windows!
System Speed Test does not require a partition to be present for testing, so all of our Random Access Time benchmarks are completed prior to drive formatting. To detect the Random Access Time, each device runs the full test routine a total of five times. The highest and lowest scores were ignored, and the remainder was averaged. This would be prove pointless however, because the access time benchmark for every single SSD recorded identical test results between runs.

Using the System Speed Test software, the top Random Access Time benchmarks places the OCZ Vertex EX, Mtron Pro 7500, and ACARD ANS-9010 at the very top of our results. The 0.9 ms performers include: MemoRight GT, Intel X25-E Extreme, Mtron Pro 7000, Mtron MOBI 3500, Intel 80GB X25-M, and the OCZ Summit. With a Random Access Time of 10ms, the following SSDs were included: OCZ Vertex Turbo, OCZ Vertex, Patriot Torqx, Super Talent UltraDrive ME, Crucial M225, OCZ Agility, and lastly the Mtron MOBI 3000. With a lightning-fast sub 0.1 ms access time, every other SSD is forced to live in the shadow that these nearly-instant products have just created.
Some of the slower Random Access Times include the following SSD products: Kingston SSDNow V+ Series (Intel X25-M SSD) with 0.14 ms, The Silicon Power SLC SATA-II SSD SP032GBSSD750S25 with 0.17 ms, the OCZ Apex at 0.18 ms, the Patriot Warp v2 with 0.19 ms, and finally the G.Skill Titan finishing at 0.21 ms. There were slower SSD products, but obselecence removed them from our results.
The DRAM cache buffer is common link between request and response time. Solid State Drive devices have the advantage of a nearly instantaneous NAND storage bank responding to an even faster DRAM buffer. Conversely, Hard Disk Drive products depend on a fast spindle speed to reduce the delay before the buffer transmits data.
Although the SSDs at the slower end of our Response Time chart may seem less impressive, in reality you couldn't begin to perceive these subtle differences in real-world applications. Still, the slowest SSD product (0.51ms) is 14x more responsive than the fastest desktop hard drive. Hard Disk Drive alternatives are much slower to react, regardless of spindle speed and cache buffer size.
Even the very best of the desktop hard drive products, such as Western Digital's VelociRaptor, only produced a best response time of 7.15 ms. The older Western Digital Raptor took 8.53ms to respond, followed by 12.99ms for the Seagate 7200.11, and 15.39ms for the 7200 RPM Hitachi Travelstar 7K100 notebook drive. The worst performer was the standard 5400 RPM notebook drive (Hitachi Travelstar 5K160 HTS541640J9SA00), which recorded a painfully slow 17.41ms Random Access Time.
Drive Hardware
ATTO Disk Benchmark
The ATTO Disk Benchmark program is free, and offers a comprehensive set of test variables to work with. In terms of disk performance, it measures interface transfer rates at various intervals for a user-specified length and then reports read and write speeds for these spot-tests. There are some minor improvements made to the 2.34 version of the program, but the benchmark is still limited to non-linear samples up to 256MB. ATTO Disk Benchmark requires that an active partition be set on the drive being tested.
While the bandwidth results are not realistic for determining the maximum drive speeds, ATTO Disk Benchmark is still a good tool for illustrating bandwidth using various file size chunks. Please consider the results displayed by this benchmark to be basic bandwidth performance indicators.

Our basic I/O bandwidth tests begin with the OCZ Vertex Turbo connected to the integrated Intel ICH10R Southbridge chip, as the ATTO Disk Benchmark tools performs file transfers ranging from 0.5 KB to 8192 KB. The 120GB SATA SSD OCZSSD2-1VTXT120G model reveals a 261 MBps read plateau from 128-8192 KB file chunks, while the 203 MBps write performance plateaus from 32-8192 KB.
Generally speaking, hard drive products like the WD VelociRaptor reach their performance plateau 'earlier' around the 16-32KB chunk range, however SSD products pick-up performance around the 64-128KB file chunk range.
Drive Hardware
In our next section, Benchmark Reviews compares random access IOPS performance among high-end storage devices using HD Tune Pro...
HD Tune Pro Benchmarks
In the past, Benchmark Reviews has avoided HD Tune benchmarks because the software was so similar to others already being used in our articles. However, EFD Software has released several versions of this program, which now adds functionality and features not available in previous revisions. The latest edition of HD Tune Pro allows random access read and write testing, a feature not available to other similar software benchmark tools. HD Tune is a low-level test that will not operate on a drive which contains a partition, so Benchmark Reviews uses DISKPART to prepare hardware and remove any partitions before conducting these tests.
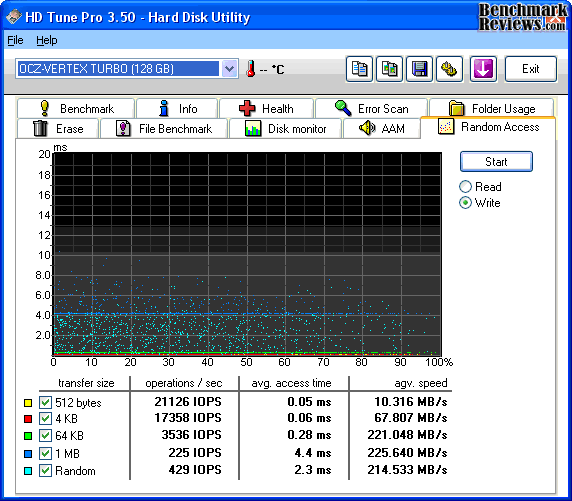
Random Access tests are divided into 512b, 4KB, 64KB, 1MB and random size test files sizes. The Random Access test measures the performance of random read or write operations. The amount of data which will be read varies from 512 bytes to 1 MB. Performance is reported in operations per second (IOPS), average access time, and average speed. Because it is our intent to compare one product against another, Benchmark Reviews has focused on random transfer size IOPS performance.
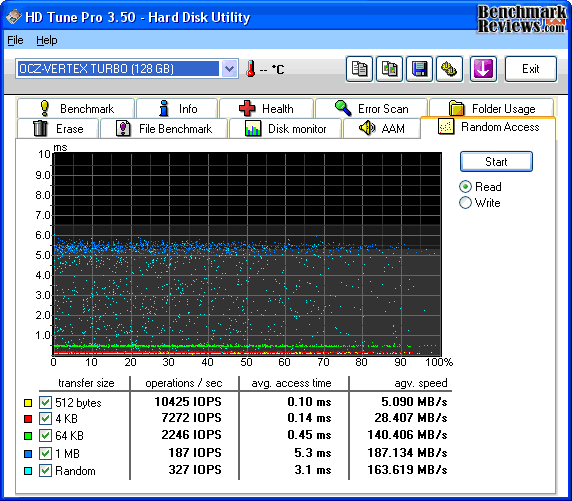
Benchmark Reviews has tested the OCZ Vertex Turbo against a collection of top-performing storage drives for our random IOPS benchmarks. The 4 KB random IOPS performance in HD Tune measured 7272 for read IO, and 5166 for write.
The tight range of IO is an indicator of operational bottlenecks. For example, the WD VelociRaptor WD3000HLFS SATA Hard Disk Drive indicates a read-IOPS range of 10-150 whereas the average SSD might offer 200-1,000. As a direct result, in most cases SSDs will offer a much higher IO over their hard disk counterparts.

In the chart above, the OCZ Vertex EX (firmware 1.20) enjoys the benefit of SLC construction, which delivers traditionally better IOPS performance than MLC counterparts, and offers the best measured random IOPS performance of the group with 384 read and 477 write IOPS. The OCZ Vertex Turbo (MLC) leads the pack of Indilinx-based SSDs which follow (Vertex, CT128M225, Torqx, UltraDrive ME, Agility) and performs at near-SLC levels with 327 read and 429 write IOPS.
Our test results were obtained after each SSD had been prepared using the DISKPART program, and in the case of products using the Indilinx Barefoot controller they were further prepared with the Sanitary Erase application. In our tests, we discovered that the maximum performance results (charted) would decay as subsequent tests were performed. As a word of caution, applications such as Sanitary Erase (SE) and Wiper offer immediate but temporary restoration of original 'pristine' performance levels.
Drive Hardware
-
Crucial / Lexar 120GB SATA-II SSD CT128M225 (Firmware 1571)
-
-
-
-
-
-
-
-
Seagate Momentus 5400.6 320GB ST9320325AS 2.5" 5,400 RPM SATA-II Hard Disk Drive
-
Seagate 7200.11 500GB 3.5" ST3500320AS 7,200 RPM SATA-II Hard Disk Drive (32MB Cache Buffer)
-
-
Benchmark Reviews measures I/O Response Time and IOPS performance using the Iometer tool in our next section...
Iometer IOPS Performance
Iometer is an I/O subsystem measurement and characterization tool for single and clustered systems. Iometer does for a computer's I/O subsystem what a dynamometer does for an engine: it measures performance under a controlled load. Iometer was originally developed by the Intel Corporation and formerly known as "Galileo". Intel has discontinued work on Iometer, and has gifted it to the Open Source Development Lab (OSDL).
Iometer is both a workload generator (that is, it performs I/O operations in order to stress the system) and a measurement tool (that is, it examines and records the performance of its I/O operations and their impact on the system). It can be configured to emulate the disk or network I/O load of any program or benchmark, or can be used to generate entirely synthetic I/O loads. It can generate and measure loads on single or multiple (networked) systems.
Benchmark Reviews has resisted publishing Iometer results because there are hundreds of different configuration variables available, making it impossible to reproduce our tests without having our Iometer configuration file. To measure random I/O response time as well as total I/O's per second, Iometer is set to use 4KB file size chunks over a 100% random sequential distribution. The tests are given a 50% read and 50% write distribution. Our charts show the Read and Write IOPS performance as well as I/O response time (measured in ms). Iometer was configured to test for 120 seconds, and after five tests the average is displayed in our benchmark results. The first tests included random read and write IOPS performance, where a higher I/O is preferred.

In these tests the single layer cell (SLC) OCZ Vertex EX rendered 3106/3091 I/O's and outperformed all other products. The ultra-premium OCZ Vertex Turbo SSD offers 1774/1770 I/O's, which is just slightly ahead of a single Vertex 1.3 SSD that rendered 1702 for read and write IOPS. Sharing the same Indilinx Barefoot controller and NAND architecture, the Crucial CT128M225 SSD (Firmware 1571) reported a read and write I/O of 1695. The mainstream OCZ Agility SSD trails behind with 1625/1618 I/O's while the OCZ Summit MLC SSD completed 730/733 I/O's. Every other product thereafter performs far beneath the above-listed products, and are not suggested for high input/output applications.
While offering better IO than any other desktop hard drive (and most first- and second-generation SSDs), the Western Digital VelociRaptor still fell short on IOPS performance compared with several current-generation SSDs and produced only 134/138 IO's. The Mtron MOBI 3000 performed 107 read and write IOPS, while the Western Digital WD5001AALS rendered 86 and the Seagate 7200.11 completing 77. The Seagate Momentus 5400.6, which is a 5400 RPM notebook hard drive, produced 60/59 IO's. The newer Mtron MOBI 3500 rendered 58 IOPS, which was worse than the older 3000 model. The OCZ Apex struggled to complete 9 IOPS, and its identically-designed G.Skill Titan managed only 8 IOPS. Clearly, the twin RAID-0 JMicron controllers are built for speed and not input/output operations. Next comes the average I/O response time tests...

The Iometer random IOPS average response time test results were nearly an inverse order of the IOPS performance results. It's no surprise that SLC drives perform I/O processes far better than their MLC versions, but that gap is slowly closing as controller technology improves the differences and enhances cache buffer space. In our Read/Write IOPS performance the SLC OCZ Vertex EX achieves a dramatic lead ahead of the other SSDs tested.
OCZ's Vertex EX (firmware 1.20) offered the fastest read and write response time, measuring 0.26/0.06ms, and showing strength in write requests. The OCZ Vertex Turbo SSD scored 0.50/0.06ms, while the Vertex 1.30 and Crucial CT128M225 SSD both offered 0.52/0.06ms. The mainstream Agility SSD produced 0.55/0.06ms, and the OCZ Summit responded to read requests in 0.78ms while write requests were a bit quicker at 0.59ms. The Western Digital VelociRaptor did very well compared against SSD products, producing 6.59/0.82ms. These times were collectively the best available, as each product measured hereafter performed much slower.
The Mtron MOBI 3000 offered a fast 0.42ms read response time, but suffered a slower 8.97ms write response. Both the WD5001AALS and Seagate 7200.11 hard drives performed around 11ms read and 1.2ms write. The Seagate Momentus 5400.6 offered 15.3/1.36ms response times. Mtron's newer MOBI 3500 offered great read response times at 0.19ms, but suffered poor write responses at 17.19ms. The worst was yet to come, as the G.Skill Titan and OCZ Apex offered decent 0.42ms read response times but absolutely unacceptable 127ms write times.
Drive Hardware
-
Crucial / Lexar 120GB SATA-II SSD CT128M225 (Firmware 1571)
-
-
-
-
-
-
-
-
Seagate Momentus 5400.6 320GB ST9320325AS 2.5" 5,400 RPM SATA-II Hard Disk Drive
-
Seagate 7200.11 500GB 3.5" ST3500320AS 7,200 RPM SATA-II Hard Disk Drive (32MB Cache Buffer)
-
-
In our next section, we test linear read and write bandwidth performance of the OCZ Vertex Turbo SSD and compare its speed against several other top storage products using EVEREST Disk Benchmark. Benchmark Reviews feels that linear tests are excellent for rating SSDs, however HDDs are put at a disadvantage with these tests whenever capacity is high.
EVEREST Disk Benchmark
Many enthusiasts are familiar with the EVEREST benchmark suite by Lavalys, but very few are aware of the Disk Benchmark tool available inside the program. The EVEREST Disk Benchmark performs linear read and write bandwidth tests on each drive, and can be configured to use file chunk sizes up to 1MB (which speeds up testing and minimizes jitter in the waveform). Because of the full sector-by-sector nature of linear testing, Benchmark Reviews endorses this method for testing SSD products, as detailed in our Solid State Drive Benchmark Performance Testing article. However, Hard Disk Drive products suffer a lower average bandwidth as the capacity draws linear read/write speed down into the inner-portion of the disk platter. EVEREST Disk Benchmark does not require a partition to be present for testing, so all of our benchmarks are completed prior to drive formatting.
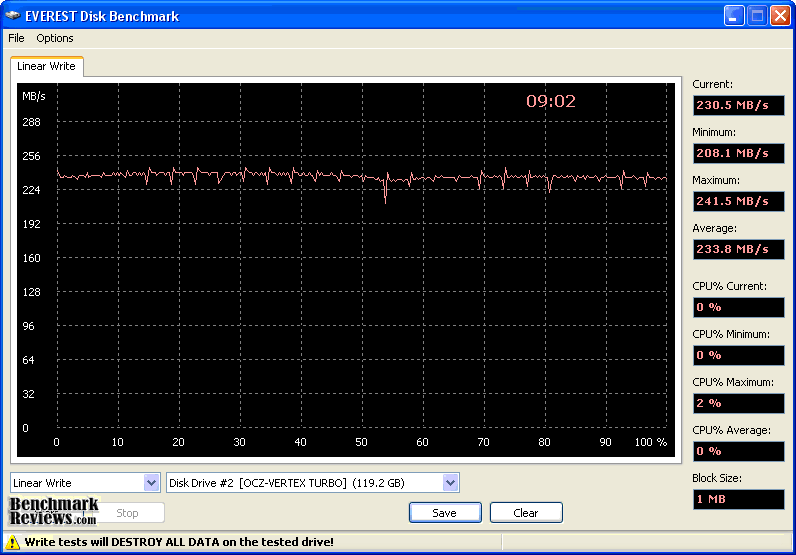
The high-performance storage products tested with EVEREST Disk Benchmark are connected to the Intel ICH10R SATA controller resident on the Gigabyte GA-EX58-UD4P motherboard. Using the 1MB block size, read performance of the OCZ Vertex Turbo 120GB SATA SSD OCZSSD2-1VTXT120G measured an average 248.2 MBps with a maximum peak of 248.6 MBps. Linear write-to tests were next...

Linear disk benchmarks are superior tools in my opinion, because they scan from the first physical sector to the last. A side affect of many linear write-performance test tools is that the data is erased as it writes to every sector on the drive. Normally this isn't an issue, but it has been shown that partition tables will occasionally play a role in overall SSD performance (HDDs are more mature products and don't suffer this problem). The 64MB buffer and extremely fast NAND flash memory on the Vertex Turbo helped improve results in our linear testing, as shown in the waveform chart below.
Although the chart makes the linear write performance appear unsteady, the results seen here are actually very good compared to most other HDD products we've tested in the past. The OCZ Vertex Turbo SSD recorded an average linear write-to speed of 233.8 MBps , with a maximum performance of 251.5 MBps.
The chart below shows the average linear read and write bandwidth for a cross-section of other SATA drives attached to the Intel ICH10 Southbridge:

Linear bandwidth certainly benefits the Solid State Drive, since there's very little fluctuation in transfer speed. Hard Disk Drive products decline in performance as the spindle reaches the inner-most sectors on the magnetic platter. I personally consider linear tests to be the single most important comparison of storage drive products, although hard disk drive products decrease performance as they reach the edge of the spindle, SSD products operate at a relatively smooth speed from start to finish.
Drive Hardware
In the next section, Benchmark Reviews tests sequential performance using the CrystalDiskMark software tool...
CrystalDiskMark Tests
CrystalDiskMark is a very basic read and write benchmark tool by Crystal Dew World that offers performance speed results using sequential, 512KB random, and 4KB random samples. For our tests, sequential read and write performance was measured using a 1000MB file size, with 50, 100, and 500MB being the other available options. CrystalDiskMark requires that an active partition be set on the drive being tested, and all drives are formatted with NTFS.
Benchmark Reviews uses CrystalDiskMark to confirm manufacturer suggested bandwidth speeds. In addition to our other tests, the sequential read and write benchmarks allow us to determine if the maximum stated speed of any storage product is within reasonable specification. In the chart below illustrated below, our sequential read and write performance speeds are organized from highest to lowest based on total bandwidth.
Enjoying a noticeable lead atop of our sequential performance chart, the OCZ Vertex EX Single-Layer Cell SSD offers the highest bandwidth and performed at 256 MBps read and 182 MBps write. Followed closely behind by the OCZ Summit MLC SSD with 128MB cache buffer. Not far behind the top leaders is the OCZ Apex, and it's twin cousin the G.Skill Titan (not shown). The OCZ Vertex Turbo offered 248/145, which is slightly faster than the standard Vertex SSD performance of 230/138. The Crucial CT128M225 is essentially identical to the OCZ Vertex, as is the Patriot Torqx and Super Talent UltraDrive ME. The OCZ Agility followed closely behind the other Indilinx Barefoot SSDs and shared the same sequential write speed penalty.
Although the remaining drives are much older models, the SLC construction keeps the OCZSSD2, Mtron MOBI 3500, and MOBI 3000 all within respectable range. Even though the high-performance VelociRaptor hard drive is made to look low-end by the results charted below, it's actually very encouraging to see that a hard disk can still keep pace with a few SSDs. The WD VelociRaptor offers sequential read and write performance comparable to the Mtron MOBI 3500 and the first-generation OCZ SLC SSD.

Drive Hardware
-
Crucial / Lexar 120GB SATA-II SSD CT128M225 (Firmware 1571)
-
-
-
-
-
-
-
-
-
Seagate Momentus 5400.6 320GB ST9320325AS 2.5" 5,400 RPM SATA-II Hard Disk Drive
-
-
Benchmark Reviews tests and compares buffered transaction speed using HD Tach in the following section...
HD Tach RW Results
Although HD Tach (and also HD Tune or Crystal Disk Benchmark) are all excellent tools for measuring Hard Disk Drive products, they fail to offer the same precision with Solid State Drive products. These programs offer only an approximate estimate of bandwidth speed through their quick-result sample-testing mechanisms, as I have proven in the Solid State Drive (SSD) Benchmark Performance Testing article published not long ago. Nevertheless, HD Tach is still useful for offering an alternative perspective at performance, even if it isn't precisely correct when used with SSD architecture.
HD Tach is a software program for Microsoft Windows that tests the sequential read, random access and interface burst speeds of the attached storage device. For the record. every single product tested was brand new and never used. HD Tach allows write-bandwidth tests only if no partition is present. Additionally, each and every product was tested five times with the highest and lowest results removed before having the average result displayed here. The graphical user interface (GUI) of the Windows-based benchmark tool HD Tach is very convenient. and allows the test product to be compared against others collected on your system or those registered into the Simpli Software database. HD Tach will not test write performance if a partition is present, so all of our benchmarks are completed prior to drive formatting.
In the tests below, Benchmark Reviews utilizes the HD TachRW tool to compare the fastest collection of desktop hard drives and competing SSD's we can get our hands on. Using the Intel ICH10R SATA controller on the Gigabyte GA-EX58-UD4P, HD Tach was used to benchmark the test SSD five times with the best results displayed below. It's important to note that HD Tach's Burst Speed result should be ignored for Solid State Drives due to the cache methods inherent to each memory controller architecture. There are times where this number will be extremely high, which is a result of the optimized cache used for SSD's.
The important numbers used for comparison are the sustained read and write bandwidth speeds, which indicate an approximate performance level of the product. Our featured test item, the 120GB OCZ Vertex Turbo, performed at an average 233.2 MBps best sustained read speed and a best average of 159.4 MBps sustained write bandwidth. Our test results were very different among benchmarks, so the average result is displayed below.

The chart below illustrates the collected averages for benchmark results using HD Tach RW on the Intel ICH10 SATA controller, with the read and write bandwidth results added together to determine rank placement. The first group is a collection of high-performance storage products. With an improved write performance, the SLC Vertex EX finds itself positioned in first place and well ahead of the MLC Vertex Turbo and several other Indilinx Barefoot-based SSDs. (Crucial CT128M225, OCZ Vertex, Patriot Torqx, Super Talent UltraDrive, and Agility). A set of Western Digital VelociRaptor hard drives paired into a RAID-0 stripe array come close, but just aren't enough to stave off SSD performance.
The ACARD ANS-9010 RAM-Disk, OCZ Summit SSD, OCZ Agility SSD, OCZ Apex SSD, and Intel X25-M SSD all trail behind in overall performance and finish out the top five positions. Nearly every other storage product trails distantly behind these leaders, which all recorded a combined HD Tach bandwidth to over 300 MBps for each.
A single (non RAID-0) VelociRaptor and Seagate 7200.11 hard drive begin the next segment of upper midrange performers, offering nearly 200 MBps of combined bandwidth. Trailed by a closely-packed group consisting of the Patriot Warp v2 SSD, Silicon Power SP032GBSSD750S25, and G.Skill FM-25S2S-64GB, are SSDs generating between 168-172 MBps of combined average bandwidth.

The lower-midrange SSD products begin with the Western Digital Raptor, scoring a combined total bandwidth of 154 MBps delivering half the performance of the leaders. Yesterday's high-performance SSD is today's low-performance drive, and the Mtron MOBI 3500, OCZ OCZSSD2-1S32G SSD, Super Talent MasterDrive MX SSD and Mtron MOBI 3000 all comprise products with less combined performance than Hard Disk Drive alternatives (except in regard to response time).
Drive Hardware
-
-
Crucial / Lexar 120GB SATA-II SSD CT128M225 (Firmware 1571)
-
-
-
-
-
-
-
-
Seagate Momentus 5400.6 320GB ST9320325AS 2.5" 5,400 RPM SATA-II Hard Disk Drive
-
Seagate 7200.11 500GB 3.5" ST3500320AS 7,200 RPM SATA-II Hard Disk Drive (32MB Cache Buffer)
-
-
Western Digital VelociRaptor 150GB WD1500HLFS 10,000 RPM SATA Hard Disk Drive (16MB Cache Buffer) configured in RAID-0
-
Please continue on to the Final Thoughts sections, where the state of SSD testing and Data Storage market sector are put under analysis...
SSD vs Hard Disk Drive
The last days of old technology are always better than the first days of new technology. Never has this saying been more true than with the topic of storage technology, specifically in regard to the introduction of Solid State Drive technology a few years ago. The only things standing in the way of widespread Solid State Drive (SSD) adoption are high storage capacity and affordable price of Hard Disk Drive (HDD) devices. Because NAND flash-based SSD technology costs more per gigabyte of capacity than traditional magnetic hard drives, the benefits of immediate response time, transfer speeds, and operational input/output performance often get overlooked. Like most consumer products, it wasn't a question of how much improvement was evident in the new technology, it was price. I'll discuss product costs more in just a moment, but for now consider how each new series of SSD product employs greater performance than the one before it, convincing would-be consumers into waiting for the right time to buy.
There's also a gray area surrounding SSD performance benchmarks that has me concerned. You might not know this, but SSDs can be very temperamental towards the condition of their flash NAND. My experience testing dozens of Solid State Drives is that a freshly cleaned device (using an alignment tool) will always outperform the same device once it's been formatted and used. A perfect example is Indilinx Barefoot-based SSDs, which suffers severely degraded performance when writing to 'dirty' flash NAND. The reason that all of this will matters is simple: the performance results reported to consumers in product reviews (such as this one) often report the very best performance scores, and the process used to obtain these results is not applicable to real-world usage. This is where garbage collection techniques such as TRIM become important, so that end-users will experience the same performance levels as we do in our tests.
| Manufacturer |
Indilinx |
Intel |
JMicron |
Samsung |
Toshiba |
SandForce |
Marvell |
| Controller |
IDX110M00-FC |
PC29AS21AA0 |
JMF612 |
S3C29RBB01-YK40 |
T6UG1XBG |
SandForce SF-1200 |
88SS9174-BJP2 |
| Max Cache |
64MB |
16MB |
128KB+256MB |
128MB |
128MB |
Integrated |
128MB |
| Max Capacity |
256GB |
160GB |
256GB |
256GB |
512GB |
512GB |
256GB |
| Read/Write Speed |
230/170 MBps |
250/70 MBps |
250/200 MBps |
220/200 MBps |
230/180 MBps |
260/260 MBps |
355/215 MBps |
| Interface |
SATA-II 3-Gbps |
SATA-II 3-Gbps |
SATA-II 3-Gbps |
SATA-II 3-Gbps |
SATA-II 3-Gbps |
SATA-II 3-Gbps |
SATA-III 6-Gbps |
| Garbage Collection |
GC/TRIM |
None |
TRIM |
GC/TRIM |
GC/TRIM |
GC/TRIM |
GC/TRIM |
|
|
|
|
|
|
Chart By:
|
BmR |
Garbage Collection (GC) is the current solution for keeping flash NAND in 'clean' condition, while maintaining optimal performance. Windows 7 offers native TRIM support, and most retail SSDs also include this special GC function or at least offer a firmware update that brings the drive up-to-date. For anyone using an Operating System or SSD that does not offer Garbage Collection functionality, you'll be using 'dirty' flash NAND modules and suffering sub-optimal performance for each write-to request. A few SSD manufacturers offers free tools to help restore peak-level performance by scheduling GC to 'clean' used NAND sectors, but these tools add excessive wear to the NAND the same way disk defragmenting tools would. SLC flash modules may resist wear much better than MLC counterparts, but come at the expense of increased production cost. The best solution is a more durable NAND module that offers long-lasting SLC benefits at the cost of MLC construction. Adoption is further stalled because keen consumers aware of this dilemma further continue their delay into the SSD market.
Getting back to price, the changes in cost per gigabyte have come as often as changes to the technology itself. At their inception, high-performance models such the 32GB MemoRight GT cost $33 per gigabyte while the entry-level 32GB Mtron MOBI 3000 sold for $14 per gigabyte. While an enjoyable decline in NAND component costs forced consumer SSD prices down low in 2009, the price of SSD products has been on the rise during 2010. Nevertheless, Solid State Drives continue to fill store shelves despite price or capacity, and there are a few SSD products now costing only $2.03 per gigabyte. Although the performance may justify the price, which is getting dangerously close to the $1.00 per gigabyte WD VelociRaptor hard drive, costs may still close some buyers out of the market. Price notwithstanding, the future is in SSD technology and the day when HDDs are obsolete is nearing; but there are still a few bumps in the road to navigate.
Vertex Turbo Conclusion
Benchmark Reviews begins each conclusion with a short summary for each of the areas we rate. The first is presentation, which takes product packaging into consideration to the extent that it provides adequate packing material and delivers consumer information for an informed purchase. Since the American economy in the midst of an economic recession, many manufacturers are having to pull out some very creative ideas to help market their products. Add onto this the fact that SSD technology already carries a premium price tag over the alternative, and you can understand why product presentation becomes so important. OCZ takes the ultra-premium Vertex Turbo SSD series packaging back to basics with a rather overused black and white appearance featuring critical product information and specifications for the untrained consumer.
Solid State Drives are a lot like spark plugs: you see them just long enough to install, and then they're forgotten. OCZ keeps production costs down on the Vertex Turbo SSD Series with a uniform black painted enclosure identical to all of their other SSD products, and uses an adhesive label for each product series with underside specifications. There really isn't very much to expect from the appearance of Solid State Drives, because like their Hard Disk Drive counterpart they are meant to place function before fashion. To this end I still wish manufacturers would begin using sealed plastic enclosures to prevent moisture or electrical shock damage, although the trend doesn't seem likely.
Construction is probably the strongest feature credited to the entire SSD product line, and OCZ products have never been an exception. Solid State Drives are by nature immune to most abuses, but add to this a hard metal shell and you have to wonder what it would take to make this drive fail. If an OCZ Vertex Turbo SSD Series product does happen to fail during the extended 3-year warranty period, end-users can contact OCZ via the company website or extensive support forums. Fortunately, there's also a toll-free telephone number for support or customer service questions (800-459-1816).
Benchmark performance results place the ultra-premium OCZ Vertex Turbo SSD directly behind the SLC Vertex EX server series SSD, and slightly ahead of the original MLC Vertex and Summit series. Based on the large collection of tests conducted, the OCZ Vertex Turbo offers bandwidth performance roughly 5-10% ahead of the Vertex (firmware 1.30) series. A noteworthy 0.10 ms response time assure a nearly-instant reaction, and the Vertex Turbo SSD showed absolutely no sign of data read/write stuttering during our tests. ATTO Disk Benchmark tool reported an impressive 261 MBps maximum read bandwidth in our tests and 203 MBps maximum write, both of which are dead-on with the OCZ maximum speed specifications. EVEREST's linear full-sector bandwidth performance was a steady 248 MBps read-from, and an impressive 234 MBps write-to speed. While all of these benchmarks indicate the general bandwidth 'speed' was the highest among MLC SSDs available, input/output performance results were also very high compared to ultra-premium SLC SSDs. Iometer indicated a random read and write IOPS around 1774/1770, which is well above every other MLC products tested.
As of September 2009, the OCZ Vertex Turbo series of Solid State Drives is sold at NewEgg in several capacities. The 30GB OCZSSD2-1VTXT30G model sells for $155, while the 60GB OCZSSD2-1VTXT60G model is listed for $249. The 120GB version Benchmark Reviews tested for this article, model OCZSSD2-1VTXT120G, is available for $439. OCZ claims that a larger 250GB Vertex Turbo SSD will be available in the very near future using part number OCZSSD2-1VTXT250G, but after two months on the market the Turbo series is limited to 120GB. Compared against the original OCZ Vertex series SSD which is sold for $139 (30GB), $221 (60GB), $369 (120GB), and $705 (250GB), the Vertex Turbo series looks to offer comparable value while updating the Vertex series with even better performance.
Since MLC Solid State Drive products are the most consumer-affordable products of the genre, it's nice that OCZ's Vertex Turbo series is closing the gap between MLC and more expensive SLC SSDs. The Indilinx Barefoot controller has proven itself to be a very popular chip for SSD makers, and the OCZ Vertex Turbo takes performance to a new level. It may take some extra effort to receive pristine-level NAND performance on a full-time basis until native TRIM support in enabled, but the MLC SSD market has never seen a faster portable storage product. The OCZ Vertex Turbo series is a premium high-performance Solid State Drive recommended to enthusiasts wanting the absolute best performance from their computer system.
Pros:
+ Impressive 248 MBps read and 234 write bandwidth with EVEREST
+ 64MB Cache buffer overcomes 'stuttering' data problem
+ Extremely low 0.10 ms random access time
+ Lightweight compact storage solution
+ Resistant to extreme shock impact
+ Up to 256 GB of SSD capacity
+ 3-Year OCZ product warranty with free support forum
+ Low power consumption may extend battery life
Cons:
- Metal case is heavier and less durable than plastic
- Lacks integrated USB 2.0 Mini-B data connection
- Expensive enthusiast-level product
Ratings:
-
Presentation: 8.75
-
Appearance: 8.75
-
Construction: 9.75
-
Functionality: 9.75
-
Value: 8.00
Final Score: 9.0 out of 10.
Excellence Achievement: Benchmark Reviews Golden Tachometer Award.
Questions? Comments? Benchmark Reviews really wants your feedback. We invite you to leave your remarks in our Discussion Forum.
EDITORS NOTE: After November 2009 Benchmark Reviews will begin testing storage devices using the Microsoft Windows 7 Operating System. Although the Marvell SATA 6Gb/s (SATA-III) controller is available on select motherboards, our testing indicates that SSD devices perform better on the Intel ICH-10 Southbridge.
Related Articles:
|
