| OCZ Vertex SSD RAID-0 Performance |
| Reviews - Featured Reviews: Storage | |||||||||||||||||||||||||||||||||||||||||||||||||||||||||||||||||||||||||||||||||||||||||||||||||||||||||||||||||||||||||||||||
| Written by Olin Coles | |||||||||||||||||||||||||||||||||||||||||||||||||||||||||||||||||||||||||||||||||||||||||||||||||||||||||||||||||||||||||||||||
| Friday, 03 April 2009 | |||||||||||||||||||||||||||||||||||||||||||||||||||||||||||||||||||||||||||||||||||||||||||||||||||||||||||||||||||||||||||||||
OCZ Vertex RAID-0 PerformanceEDITORS NOTE: This article supplements our OCZ Vertex 120GB SATA SSD OCZSSD2-1VTX120G review. This might sound like we're bragging, but Benchmark Reviews has been testing Solid State Drive products longer than most consumers have known them to exist. On the other hand, performance enthusiasts have been keeping notes on SSD technology for a while now. SSD products are not mainstream, not yet, but that day isn't very far off anymore. Lower power consumption and heat output are the least impressive benefits of Solid State Drives. The real payoff is in the practically instant response time and high-performance throughput. OCZ may not have created the Solid State Drive, but they've done more to bring SSD technology mainstream than any other company in the industry. Once SSDs could outperform their HDD counterpart, it was all about price and capacity. Adding up to 64MB of Elpida DRAM to the buffer has permanently solved stuttering problems, making raw performance the last bottleneck. An Indilinx 'Barefoot' internal controller commands the bank of Samsung K9HCG08U1M DRAM modules, allowing a single OCZ Vertex SSD to offer impressive capacity with unmatched performance. But what if we put two Vertex SSDs into a striped RAID-0 array? Benchmark Reviews tests the speed and bandwidth of two OCZSSD2-1VTX120G SSDs against the fastest storage products on the planet in this OCZ Vertex SSD RAID-0 performance article.
Since first making a commercial public debut at the 2007 Consumer Electronics Show, Solid State Drives (SSD's) have been a topic of hot discussion among performance enthusiasts. These nonvolatile flash memory-based drives feature virtually no access time delay and promise a more reliable storage medium with greater performance while operating at a fraction of the power level. Moving into 2008, SSDs became a consumer reality for many performance-minded power users. Now that 2009 has revealed promising industry support for Solid State Drive technology, we should hope that mainstream acceptance moves faster than DDR3 SDRAM has. Back in November 2007, after experiencing the SuperComputing Conference SC07, finding Solid State Drives on sale anywhere was a real challenge. One year later, and online stores are offering dozens of SSD models at reasonable prices. Solid State Drives are rapidly changing the computing landscape, and many enthusiasts are using SSD technology in their primary systems to help boost performance. Benchmark Reviews has tested nearly all of the products available to the retail market in this sector, and several do well while others fall flat. It used to be that performance was the largest hurdle for mass storage NAND Solid State Drives, followed by stability, and later price. Solid State Drive products are no longer restricted to bleeding edge hardware enthusiasts or wealthy elitists. Heading into 2009, SSD storage devices were available online for nearly $2 per gigabyte of storage capacity while the most popular performance desktop hard drive hovered just above $1/GB. While most consumers are waiting for that day when SSD costs the same as HDD, they seem to be forgetting how Solid State Drives have already surpassed Hard Disk performance in every other regard. Our collection of SSD reviews is a good starting point for comparing the competition. According to a Q1 2008 report by the semiconductor market research firm iSuppli, the SSD market will grow at an annualized average of 124 percent during the four-year period from 2008 until 2012. iSuppli now projects SSD sales to increase by an additional 35 percent in 2009 over what it projected last year, 51 percent more in 2010, and 89 percent more in 2011, and continue to show dramatic increases in subsequent years. Disclaimer: SSD BenchmarksBenchmark Reviews recently published an article which details Solid State Drive (SSD) Benchmark Performance Testing. The research and discussion that went into producing that article changed the way we now test SSD products. Our previous perceptions of this technology were lost on one particular difference: the wear leveling algorithm that makes data a moving target. Without conclusive linear bandwidth testing or some other method of total-capacity testing, our previous performance results were rough estimates at best. It's critically important to understand that no software for the Microsoft Windows platform can accurately measure SSD performance in a comparable fashion. Synthetic benchmark tools such as HD Tach and ATTO Disk Benchmark are helpful indicators, but should not be considered the ultimate determining factor. That factor should be measured in actual user experience of real-world applications. Benchmark Reviews includes both bandwidth benchmarks and application speed tests to present a conclusive measurement of product performance. About the company: OCZ Technology
|
|||||||||||||||||||||||||||||||||||||||||||||||||||||||||||||||||||||||||||||||||||||||||||||||||||||||||||||||||||||||||||||||


|
Series |
Vertex EX |
Summit |
Vertex Turbo |
Vertex |
Apex |
Agility |
Core v2 |
Solid |
|
Capacities (GB) |
64, 128 |
32, 64, 128, 256 |
32, 64, 128, 256 |
32, 64, 128, 256 |
64, 128, 256 |
32, 64, 128 |
32, 64, 128, 256 |
32, 64, 128, 256 |
|
NAND |
SLC |
MLC |
MLC |
MLC |
MLC |
MLC |
MLC |
MLC |
|
Controller |
Indilinx |
Samsung |
Indilinx |
Indilinx |
Dual JMicron |
Indilinx |
JMicron |
JMicron |
|
Cache |
64MB |
128MB |
64MB |
64MB |
N/A |
64MB |
N/A |
N/A |
|
Read Speed |
Up to 260MB/s |
Up to 220MB/s |
Up to 270MB/s |
Up to 250MB/s |
Up to 230MB/s |
Up to 230MB/s |
Up to 170MB/s |
Up to 155MB/s |
|
Write Speed |
Up to 210MB/s |
Up to 200MB/s |
Up to 200MB/s |
Up to 160MB/s |
Up to 160MB/s |
Up to 135MB/s |
Up to 98MB/s |
Up to 90MB/s |
|
Firmware Jumper |
No |
No |
Yes |
Yes |
No |
Yes |
No |
No |
As of August 2009 the OCZ SSD family includes the following products from top to bottom:
-
OCZ Vertex EX SLC enterprise SSD featuring read performance up to 260 MBps and write bandwidth up to 210 MBps. High Reliability is based on 6, 12, 16-bits/sector correctable by the internal BCH mode.
-
64GB OCZ Vertex EX (OCZSSD2-1VTXEX60G)
-
128GB OCZ Vertex EX (OCZSSD2-1VTXEX120G)
-
-
OCZ Vertex Turbo Series premium enthusiast SSD featuring read performance up to 270 MBps and write bandwidth up to 200 MBps. High Reliability is based on 6, 12, 16-bits/sector correctable by the internal BCH mode.
-
32GB OCZ Vertex (OCZSSD2-1VTXT30G)
-
64GB OCZ Vertex (OCZSSD2-1VTXT60G)
-
128GB OCZ Vertex (OCZSSD2-1VTXT120G)
-
256GB OCZ Vertex (OCZSSD2-1VTXT250G)
-
-
OCZ Summit Series MLC enthusiast/enterprise SSD featuring read performance up to 220 MBps and write bandwidth up to 200 MBps. High Reliability is based on 6, 12, 16-bits/sector correctable by the internal BCH mode.
-
64GB OCZ Summit (OCZSSD2-1SUM60G)
-
128GB OCZ Summit (OCZSSD2-1SUM120G)
-
256GB OCZ Summit (OCZSSD2-1SUM250G)
-
-
OCZ Vertex Series premium SSD featuring read performance up to 250 MBps and write bandwidth up to 160 MBps. High Reliability is based on 6, 12, 16-bits/sector correctable by the internal BCH mode.
-
32GB OCZ Vertex (OCZSSD2-1VTX30G)
-
64GB OCZ Vertex (OCZSSD2-1VTX60G)
-
128GB OCZ Vertex (OCZSSD2-1VTX120G)
-
256GB OCZ Vertex (OCZSSD2-1VTX250G)
-
-
OCZ Apex Series SSD with new RAID-0 internal architecture featuring read performance up to 230 MBps and write bandwidth up to 160 MBps. High reliability is based on the internal 15bit BCH mode.
-
32GB OCZ Apex (OCZSSD2-1APX30G)
-
64GB OCZ Apex (OCZSSD2-1APX60G)
-
128GB OCZ Apex (OCZSSD2-1APX120G)
-
256GB OCZ Apex (OCZSSD2-1APX250G)
-
-
OCZ Agility Series mainstream SSD featuring read performance up to 230 MBps and write bandwidth up to 135 MBps. High Reliability is based on 6, 12, 16-bits/sector correctable by the internal BCH mode.
-
32GB OCZ Agility (OCZSSD2-1AGT30G)
-
64GB OCZ Agility (OCZSSD2-1AGT60G)
-
128GB OCZ Agility (OCZSSD2-1AGT120G)
-
-
OCZ Core v2 Series mainstream consumer SSD featuring read performance up to 170 MBps and write bandwidth up to 98 MBps. High reliability is based on the internal BCH 15bit ECC.
-
32GB OCZ Core (OCZSSD2-2C30G)
-
64GB OCZ Core (OCZSSD2-2C60G)
-
128GB OCZ Core (OCZSSD2-2C120G)
-
256GB OCZ Core (OCZSSD2-2C250G)
-
-
OCZ Solid Series value SSD featuring read performance up to 155 MBps and write bandwidth up to 90 MBps. High reliability is based on the internal BCH 15bit ECC.
-
32GB OCZ Solid (OCZSSD2-1SLD30G)
-
64GB OCZ Solid (OCZSSD2-1SLD60G)
-
128GB OCZ Solid (OCZSSD2-1SLD120G)
-
256GB OCZ Solid (OCZSSD2-1SLD250G)
-
OCZSSD2-1VTX120G Specifications
-
Available in 30GB, 60GB, 120GB, 250GB capacities
-
Read: up to 200 MB/sec
-
Write (120-250GB): up to 160 MB/sec
-
Seek: <.1ms
-
Onboard Cache: (30-60GB) - 32MB / (120-250GB) - 64MB
-
Slim 2.5" Design
-
100.2 x 70 x 9.3mm
-
Lightweight 77g
-
Operating Temp: -10C ~ +70C
-
Storage Temp: -55C ~ +140C
-
Low Power Consumption
-
Shock Resistant 1500G
-
Internal RAID 0 Support
-
MTBF 1.5 million hours
-
2 year warranty
First Look: OCZ Vertex SSD
The OCZ Vertex Series SSD introduces a new controller to help deliver the manufacturer-rated bandwidth speeds. On the outside, this 120GB SSD (model OCZSSD2-1VTX120G) looks like all of the other Solid State Drive products OCZ offers in their current product family.
When it comes to the appearance of notebook drives, it must be understood that the product you're looking at will be hidden away from plain view once installed. Keeping in mind that this product is solid state, and therefore offers no amount of noticeable physical activity, it takes some special attention to presentation in order to help keep the consumer feeling comfortable with their premium purchase. Unlike the Hard Disk Drive (HDD) storage products, SSD's are practically impervious to impact damage and do not require special vibration dampening or shock-proof enclosures. OCZ utilizes a metal enclosure for the Vertex series, which fastens with four small counter-sunk screws on the underside.

Standard 2.5" drive bay mounting points are pre-drilled and threaded into the Vertex SSD, which allows for quick upgrade or addition into any existing notebook or desktop system. The mounting positions matched up to the drive bracket on my laptop, and after only a few minutes of drive cloning I was quickly loading Windows XP.

Unlike desktop computers which utilize a SATA cable system to connect drive to motherboard, nearly all notebooks allow the 2.5" drive to simply slide directly into a connection bay within the system. In addition to notebooks and desktop computer usage, this OCZ Vertex Solid State Drive can be utilized for mission-critical backups or high-abuse data systems. One unfortunate omission from the Vertex series was the integrated High-Speed USB 2.0 Mini-B seen on the Core v2 SSD.
Now that you're acquainted with the basic exterior features of the Vertex SSD, it's time to peek inside the OCZSSD2-1VTX120G enclosure and inspect the internal components...
Vertex SSD Internal Components
Intermittent and delayed response cycles (stuttering) from Solid State Drive products is not entirely wide-spread among all MLC SSDs, but it has become a big-enough issue among most affordable SSD products that many are well-aware of the phenomenon. Consumers first experienced the bitter taste of stuttering SSD performance with the OCZ Core Series (v1) SSD, although it has also been reported with the G.Skill MLC SSD and Patriot Warp v2. The phenomenon occurs when the drives buffer is filled faster than it can read or write data, and was prevalent among first-generation JMicron JMF602 SSD controllers.
In the last SSD review, we detailed how OCZ's Apex features a JMicron JMB390 RAID controller managing a pair of JMF602(B) SSD controllers into a RAID-0 striped array to overcome the 'stutter' experienced in MLC drives. OCZ has returned to traditional methods of delivering performance with their latest and greatest Solid State Drive: the OCZ Vertex. But how will the Vertex SSD produce read-from and write-to bandwidth on par with the RAID-0 Apex without all the new architecture? The secret lies within a larger buffer, and the retirement of JMicron controllers (at least for this product) in place of the new Indilinx ARM7 micro-controller.

To the untrained eye, the OCZ Verted SSD looks like every other Solid State Drive you've probably seen when the internal components have been exposed. There's a collective bank of DRAM, usually with Samsung markings, followed by the SATA controller chip. OCZ had decided to use Indilinx to deliver the SATA controller interface, since their 'Barefoot' chip was production-ready to be paired with a large cache months ago, while JMicron is still a few months away with their successor to the JMF602B chip.

The internal DRAM is comprised of Samsung K9HCG08U1M-PCB00 IC parts, which bare the branding mark K9HCG08U1M PCB0. These lead-free RoHS-compliant 48-pin ICs are multi-layer, with one IC directly atop another. Each IC has an operating voltage of 2.7-3.6V, with a 25ns speed rating. The K9HCG08U1M parts offer 64GB in 8x organization.

Indilinx claims that their IDX110M00-FC 'Barefoot' chip offer a maximum read speed 230 MBps and supports the capacity up to 512GB with multi-level cell (MLC) NAND flash. The Indilinx (IDX110) Barefoot SSD controller chip is touted as delivering bandwidth over 200 MBps and random input-output (IO) of 20,000/s into various servers such as on-line transaction processing (OLTP) and streaming server units.

A single Elpida 64MB SDRAM module is marked with S51321CBH-7BTT-F, but the actual Elpida part number is EDS51321CBH, which is a 133MHz (CL3-3-3) mobile RAM component. This 64MB cache buffer helps improve small write-to performance and removes the 'stuttering' effect from the Vertex SSD.

The test sample Benchmark Reviews received for our benchmarks came with version 9 firmware, but we were later halted and asked to use v10 firmware. This revision was a little too much for SATA-II controllers, so back to v9 we went. At the time of publication, the v9 firmware we used in this article is the same as what OCZ will use for retail products.
In the next section, Benchmark Reviews begins performance testing the Vertex Solid State Drive, and we determine just how well the new Indilinx Barefoot-based SSD compares to the previous best-performing competition.
Disclaimer: SSD Testing
EDITORS NOTE 05/10/2009: Benchmark Reviews has re-tested the OCZ Vertex with the latest v1.10 firmware, which includes TRIM support, and the resulting performance was generally identical to the previous firmware. Please remember that TRIM is a Windows 7 supported feature, and does not improve performance on Windows XP or Vista Operating Systesm.
Benchmark Reviews recently published an article which details Solid State Drive (SSD) Benchmark Performance Testing. The research and discussion that went into producing that article changed the way we now test SSD products. Our previous perceptions of this technology were lost on one particular difference: the wear leveling algorithm that makes data a moving target. Without conclusive linear bandwidth testing or some other method of total-capacity testing, our previous performance results were rough estimates at best.
It's critically important to understand that no software for the Microsoft Windows platform can accurately measure SSD performance in a comparable fashion. Synthetic benchmark tools such as HD Tach and ATTO Disk Benchmark are helpful indicators, but should not be considered the ultimate determining factor. That factor should be measured in actual user experience of real-world applications. Benchmark Reviews includes both bandwidth benchmarks and application speed tests to present a conclusive measurement of product performance.
SSD Testing Methodology
Solid State Drives have traveled a long winding course to finally get where they are today. Up to this point in technology, there have been several key differences separating Solid State Drives from magnetic rotational Hard Disk Drives. While the DRAM-based buffer size on desktop HDD's has recently reached 32 MB and is ever-increasing, there is still a hefty delay in the initial response time. This is one key area in which flash-based Solid State Drives continually dominates because they lack moving parts to "get up to speed".
However the benefits inherent to SSD's have traditionally fallen off once the throughput begins, even though data reads or writes are executed at a high constant rate whereas the HDD tapers off in performance. This makes the average transaction speed of a SSD comparable to the data burst rate mentioned in HDD tests, albeit usually lower than the HDD's speed.
Comparing a Solid State Disk to a standard Hard Disk Drives is always relative; even if you're comparing the fastest rotational spindle speeds. One is going to be many times faster in response (SSD's), while the other is usually going to have higher throughput bandwidth (HDD's). Additionally, there are certain factors which can effect the results of a test which we do our best to avoid.
Test System
-
Motherboard: Gigabyte GA-EX58-UD4P (Intel X58/ICH10R Chipset) with version F6b BIOS
-
Processor: Intel Core i7-920 BX80601920 2.667 GHz
-
System Memory: 6GB Tri-Channel DDR3
-
Operating System: Windows XP Professional SP-3 (optimized to 16 processes at idle)
Drive Hardware
-
Crucial / Lexar 32GB 2.5" SATA-2 SSD CT32GBFAB0
-
Hitachi Travelstar 5K160 2.5" 40GB SATA 5,400 RPM HDD HTS541640J9SA00 (8MB Cache Buffer)
-
Hitachi Travelstar 7K100 2.5" 60GB SATA 7,200 RPM HDD HTS721060G9SA00 (8MB Cache Buffer)
-
Kingston 80GB SATA SSD SSDSA2MH080G1GC
-
OCZ Vertex 120GB SATA SSD OCZSSD2-1VTX120G (Firmware v1275)
-
Samsung 64GB 2.5" SATA-2 SSD MCCOE64G5MPP-0VA
-
Seagate 7200.11 500GB 3.5" ST3500320AS 7,200 RPM SATA-II Hard Disk Drive (32MB Cache Buffer)
-
Western Digital Raptor 74GB 3.5" WD740ADFD 10,000 RPM SATA Hard Disk Drive (16MB Cache Buffer)
-
Western Digital VelociRaptor 150GB WD1500HLFS 10,000 RPM SATA Hard Disk Drive (16MB Cache Buffer)
Test Tools
-
EVEREST Ultimate Edition v5.00.1650 by Lavalys: Disk Benchmark component tests linear read and write bandwidth speed
-
ATTO Disk Benchmark v2.34: Spot-tests static file size chunks for IOPS benchmarking
-
HD Tach RW v3.0.4.0 by Simpli Software: Approximate buffered read and write bandwidth speed
-
PCMark05 by Futurmark Corporation: Synthetic measurement of real-world productivity
-
System Speed Test v4.78 by Vladimir Afanasiev: Accurately measures random access response time
System Speed Test
EDITORS NOTE 05/10/2009: Benchmark Reviews has re-tested the OCZ Vertex with the latest v1.10 firmware, which includes TRIM support, and the resulting performance was generally identical to the previous firmware. Please remember that TRIM is a Windows 7 supported feature, and does not improve performance on Windows XP or Vista Operating Systesm.
I doubt that when DOS was put to rest, Vladimir Afanasiev ever thought he would see his System Speed Test software used again in professional reviews. This program offers comprehensive system information, but it also has a powerful benchmarking tool for memory, processor, and disks. In terms of disk performance, it measures interface and physical transfer rates, seek and access times at the hardware level, and it does so without delay or interference from Operating System software or running processes. This is why Benchmark Reviews will continue to use this test: it polls its results directly from the hardware without the need for Windows!
To detect the Random Access Time, each device runs the full test routine a total of five times. The highest and lowest scores were ignored, and the remainder was averaged. This would be prove pointless however, because the access time benchmark for every single SSD recorded identical test results between runs.

Using the System Speed Test software, the top Random Access Time benchmarks place the Mtron Pro 7500 SSD at the very top of our results. With a lightning-fast 0.08 ms access time, every other SSD is forced to live in the shadow that the MSP-SATA7525 has just created. The other sub-0.1ms top performers include: MemoRight GT, Mtron Pro 7000, Mtron MOBI 3500, Intel 80GB X25-M, OCZ Vertex and Mtron MOBI 3000.
The mi-level Random Access Times fall between 0.14ms and 0.23ms, and include: OCZ SATA-II OCZSSD2-1S64G, Samsung MCCOE64G5MPP, Silicon Power SP032GBSSD750S25, OCZ Apex OCZSSD2-1APX120G, G.Skill FM-25S2S-64GB, Patriot Warp PE128GS25SSDR and the original OCZ OCZSSD64GB.
At the slower end of our SSD Response Time chart is the original SATA Silicon Power SP064GBSSD25SV10, OCZ Core Series, Crucial's CT32GBFAB0, and the Super Talent MasterDrive MX finishing out the list. In reality you couldn't begin to perceive these subtle differences, and MLC or SLC construction has a lot to do with Random Access Time. It is understandable then, that the newer SSD products do not maintain the lightning fast response time that much more expensive SLC products do. Still, the slowest SSD product (0.51ms) is 14x more responsive than the fastest desktop hard drive.
It's also worth keeping in mind that Hard Disk Drive alternatives are much slower to react. Even the very best of the desktop hard drive products, Western Digital's VelociRaptor 150GB WD1500HLFS, could produce 7.15ms at its best. The Western Digital Raptor took 8.53ms to respond, followed by 12.99ms for the Seagate 7200.11, and 15.39ms for the 7200 RPM Hitachi Travelstar 7K100 notebook drive. The worst performer was the standard 5400 RPM notebook drive (Hitachi Travelstar 5K160 HTS541640J9SA00), which recorded a painfully slow 17.41ms Random Access Time.
Drive Hardware
- Crucial / Lexar 32GB 2.5" SATA-2 SSD CT32GBFAB0
- G.Skill 64GB 2.5" SATA-2 SSD FM-25S2S-64GB
- Hitachi Travelstar 5K160 2.5" 40GB SATA 5,400 RPM HDD HTS541640J9SA00 (8MB Cache Buffer)
- Hitachi Travelstar 7K100 2.5" 60GB SATA 7,200 RPM HDD HTS721060G9SA00 (8MB Cache Buffer)
- Intel 80GB X25-M SATA SSD SSDSA2MH080G15E
- Kingston 80GB SATA SSD SSDSA2MH080G1GC
- MemoRight GT 64GB 2.5" SATA SSD MR25.2-064S
- Mtron Pro 7500 32GB SATA-II SSD MSP-SATA7525
- Mtron Pro 7000 16GB 2.5-Inch 16GB SSD SATA7025
- Mtron MOBI 3000 16GB 2.5" SATA SSD MSD-SATA3025
- Mtron MOBI 3500 64GB 3.5" SATA SSD MSD-SATA3535-064
- OCZ 64GB 2.5" SATA SSD OCZSSD64GB
- OCZ SATA-II 32GB 2.5" SSD OCZSSD2-1S32G
- OCZ Core Series SATA-II SSD OCZSSD2-1C64G
- OCZ SATA-II 64GB 2.5" SSD OCZSSD2-1S64G
- OCZ Apex 120GB SATA SSD OCZSSD2-1APX120G
- OCZ Vertex 120GB SATA SSD OCZSSD2-1VTX120G (Firmware v1275)
- Patriot Warp 128GB SATA-II SSD PE128GS25SSDR
- Samsung 64GB 2.5" SATA-2 SSD MCCOE64G5MPP-0VA
- Seagate 7200.11 500GB 3.5" ST3500320AS 7,200 RPM SATA-II Hard Disk Drive (32MB Cache Buffer)
- Super Talent MasterDrive MX 60GB 2.5" SATA-II SSD FTM60GK25H
- Silicon Power 64GB 2.5" SATA SSD SP064GBSSD25SV10
- Silicon Power 32GB SLC SATA-II SSD SP032GBSSD750S25
- Western Digital Raptor 74GB 3.5" WD740ADFD 10,000 RPM SATA Hard Disk Drive (16MB Cache Buffer)
- Western Digital VelociRaptor 150GB WD1500HLFS 10,000 RPM SATA Hard Disk Drive (16MB Cache Buffer)
ATTO Disk Benchmark Results
EDITORS NOTE: ATTO Disk Benchmark is not designed to be used as bandwidth speed tool, as the final results are determined by user-set variables. Benchmark Reviews uses ATTO Disk Benchmark as a tool for illustrating basic IOPS load performance at various chunk load sizes. Please read the Solid State Drive Benchmark Performance Testing article to understand how the benchmarks used in this article should be interpreted.
EDITORS NOTE 05/10/2009: Benchmark Reviews has re-tested the OCZ Vertex with the latest v1.10 firmware, which includes TRIM support, and the resulting performance was generally identical to the previous firmware. Please remember that TRIM is a Windows 7 supported feature, and does not improve performance on Windows XP or Vista Operating Systesm.
The ATTO Disk Benchmark program is free, and offers a comprehensive set of test variables to work with. In terms of disk performance, it measures interface transfer rates at various intervals for a user-specified length and then reports read and write speeds for these spot-tests. There are some minor improvements made to the 2.34 version of the program, but the benchmark is still limited to non-linear samples up to 256MB. While the bandwidth results are no realistic for determining the maximum drive speeds, ATTO Disk Benchmark is still a good tool for illustrating the bandwidth at different file size chunks. Please consider the results displayed by this benchmark to be basic IOPS performance indicators.
Beginning with the integrated Intel ICH10R Southbridge chip connected to the OCZ Vertex, the ATTO Disk Benchmark tools performs file transfers ranging from 0.5 KB to 8192 KB. This 120GB OCZSSD2-1VTX120G part shows a 249 MBps read plateau from 256-8192 KB file chunks, while the 127 MBps write performance plateaus from 128-8192 KB. This isn't nearly as good as we experienced with the OCZ Apex SSD, but still very good none the less.

Although OCZ has integrated a 64MB buffer on the Vertex SSD, it still have lukewarm writer performance with small file chunks. The larger buffer helps, but the two internal SSD controllers found handling a RAID-0 striped array on the OCZ Apex SSD did better. OCZ uses ATTO to define maximum read and write bandwidth for the OCZSSD2-1VTX120G, which is stated as 200 MBps read and 160 MBps write bandwidth. While the read performance is well-above that figure and nearing 250 MBps, the write performance is considerably less at around 137 MBps according to ATTO. So that's what the single OCZ Vertex looks like; now let's look at a striped RAID-0 set of solid state drives:

Compared to a single Vertex SSD configuration, the RAID-0 SSDs don't plateau performance until the 256 KB sized file chunks. A single Vertex offered 249 MBps maximum read performance, while the RAID-0 Vertex recorded a 438 MBps top speed. That's not quite 100% of a single Vertex SSD, but 76% isn't bad considering overhead and throughput managment. Moving on to the read-from performance, a single Vertex SSD gave a best speed of 137 MBps while the RAID-0 Vertex SSDs offered an impressive 358 MBps for 161% improvement!
Drive Hardware
-
OCZ Vertex 120GB SATA SSD OCZSSD2-1VTX120G (Firmware v1275)
-
2x OCZ Vertex 120GB SATA SSD RAID-0 Striped Set (Firmware v1275)
In our next section, we test linear read and write bandwidth performance of the OCZ Vertex and compare its speed against several other top storage products. Benchmark Reviews feels that linear tests are the best method for testing SSD products, as detailed in our Solid State Drive Benchmark Performance Testing article.
EVEREST Disk Benchmark
EDITORS NOTE 05/10/2009: Benchmark Reviews has re-tested the OCZ Vertex with the latest v1.10 firmware, which includes TRIM support, and the resulting performance was generally identical to the previous firmware. Please remember that TRIM is a Windows 7 supported feature, and does not improve performance on Windows XP or Vista Operating Systesm.
Many enthusiasts are familiar with the EVEREST benchmark suite by Lavalys, but very few are aware of the Disk Benchmark tool available inside the program. The EVEREST Disk Benchmark (version 2.06.37) performs linear read and write bandwidth tests on each drive, and can be configured to use file chunk sizes up to 1MB (which speeds up testing and minimizes jitter in the waveform). Because of the full sector-by-sector nature of linear testing, Benchmark Reviews endorses this method for testing SSD products, as detailed in our Solid State Drive Benchmark Performance Testing article.
The SSD products tested with EVEREST Disk Benchmark are connected to the Intel ICH10R SATA controller resident on the Gigabyte GA-EX58-UD4P motherboard. Using the 1MB block size, our read performance measured an average 247.3 MBps and forms a near-perfect line as it scans across all sectors. At some point in the waveform, maximum read performance peaked at 249.7 MBps, indicating how well the Indilinx 'Barefoot' controller has improved over the previous designs by other manufacturers (like JMicron).
Linear disk benchmarks are superior tools in my opinion, because they scan from the first physical sector to the last. A side effect of many linear write-performance test tools is that the data is erased as it writes to every sector on the drive. Normally this isn't an issue, but it has been shown that partition tables will occasionally play a role in overall performance. The large 64MB buffer helped our linear testing, as shown in the waveform chart below.


Although the chart makes the linear write performance appear unsteady, the results seen here are actually very good compared to other SSD products we've tested in the past. Read-from performance was a speedy 247.3 MBps on averate, with 249.7 MBps maximum. The OCZ Vertex easily outperforms the stated 160 MBps specification for write-to bandwidth, as our tests resulted in a 225.2 MBps average with a 242.7 MBps maximum peak write bandwidth. Let's move on to the RAID-0 Vertex results...
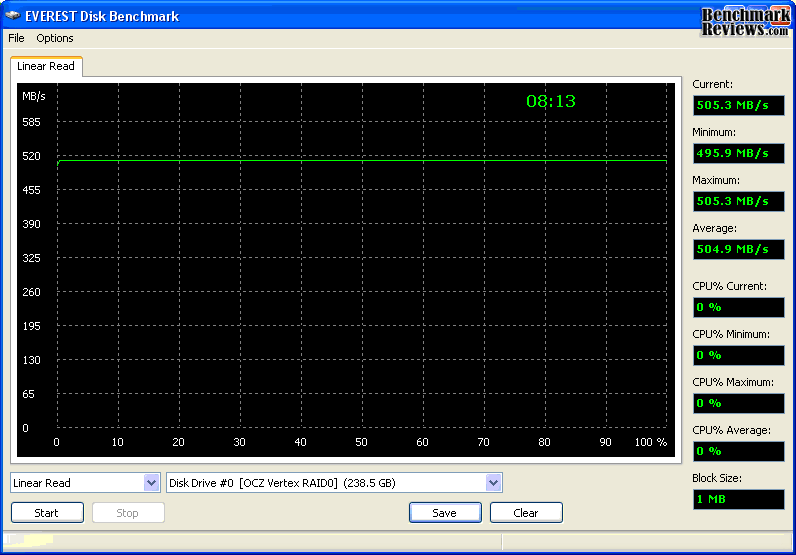
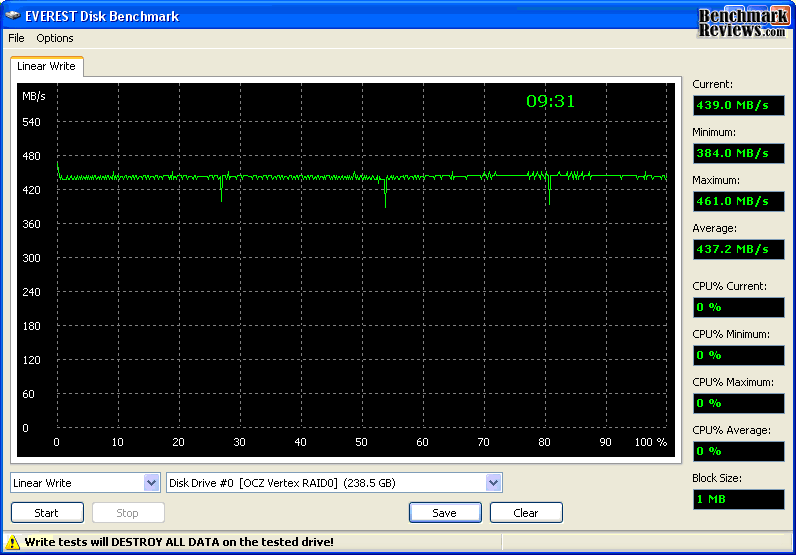
The single-SSD OCZ Vertex results were already impressive, with 247.3 MBps average read speed and 225.2 MBps write bandwidth. Putting two OCZ Vertex SSDs into a striped RAID-0 array really let the technology shine, as the bandwidth scores were as high as Benchmark Reviews has seen. The RAID-0 Vertex set performed at 504.9 MBps average read speed, while write performance was 437.2 MBps. That amounts to 104% read speed improvement, and 94% write performance.
The chart below shows the average linear read and write bandwidth for a cross-section of drives attached to the Intel ICH10 Southbridge. I personally consider this the single most important comparison of storage drive products, and although the Apex SSD is a bit crippled by the complex RAID-0 write-to performance, all of the others are spot-on.
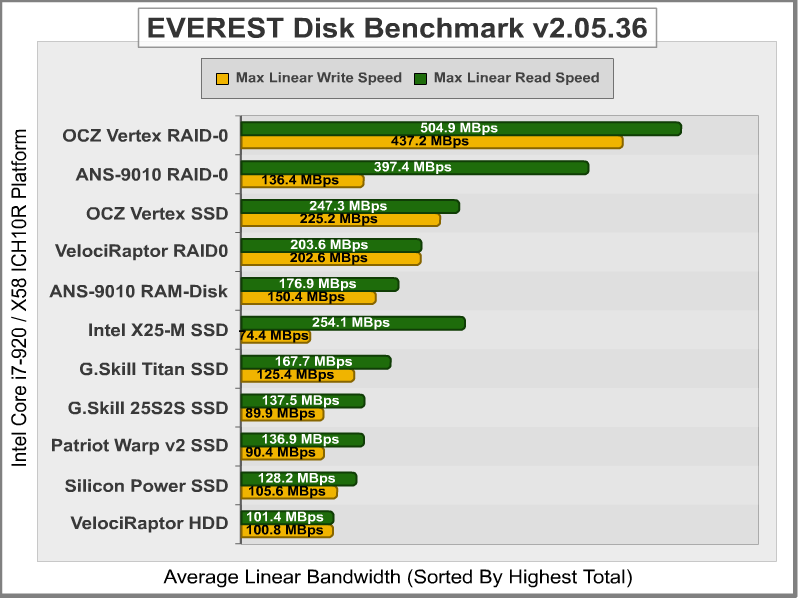
Linear bandwidth certainly benefits the Solid State Drive, since there's very little fluctuation in transfer speed. Hard Disk Drive products decline in performance as the spindle reaches the inner-most sectors on the magnetic platter.
Drive Hardware
-
OCZ Apex 120GB SATA SSD OCZSSD2-1APX120G
-
Seagate 7200.11 500GB 3.5" ST3500320AS 7,200 RPM SATA-II Hard Disk Drive (32MB Cache Buffer)
-
Western Digital Raptor 74GB 3.5" WD740ADFD 10,000 RPM SATA Hard Disk Drive (16MB Cache Buffer)
-
Western Digital VelociRaptor 150GB WD1500HLFS 10,000 RPM SATA Hard Disk Drive (16MB Cache Buffer)
In the next section, Benchmark Reviews tests the buffered transaction performance for the OCZ Vertex SSD using HD-Tach, and compare the results to dozens of other products.
Iometer IOPS Performance
EDITORS NOTE 06/01/2009: Benchmark Reviews added the Iometer results to this article after it was originally published, as a result of reader requests and suggestions.
Iometer is an I/O subsystem measurement and characterization tool for single and clustered systems. Iometer does for a computer's I/O subsystem what a dynamometer does for an engine: it measures performance under a controlled load. Iometer was originally developed by the Intel Corporation and formerly known as "Galileo". Intel has discontinued work on Iometer, and has gifted it to the Open Source Development Lab (OSDL).
Iometer is both a workload generator (that is, it performs I/O operations in order to stress the system) and a measurement tool (that is, it examines and records the performance of its I/O operations and their impact on the system). It can be configured to emulate the disk or network I/O load of any program or benchmark, or can be used to generate entirely synthetic I/O loads. It can generate and measure loads on single or multiple (networked) systems.
Benchmark Reviews has resisted publishing Iometer results because there are hundreds of different configuration variables available, making it impossible to reproduce our tests without having our Iometer configuration file. To measure random I/O response time as well as total I/O's per second, Iometer is set to use 4KB file size chunks over a 100% random sequential distribution. The tests are given a 50% read and 50% write distribution. Our charts show the Read and Write IOPS performance as well as I/O response time (measured in ms).

Iometer was configured to test for 120 seconds, and after five tests the average is displayed in our benchmark results. The first tests included random read and write IOPS performance, where a higher I/O is preferred. In this test the single layer cell OCZ Vertex EX rendered 3106/3091 I/O's and outperformed all other products. A set of RAID-0 Vertex (v1.10 firmware) 120GB MLC SSDs performed at 1517/1515, which is just slightly ahead of a single Vertex SSD which renders 1197 for read and write IOPS. The OCZ Summit MLC SSD completed 730/733 IO's. All other products performed far beneath this group, and are not suggested for high input/output applications.
The Mtron MOBI 3000 performed 107 read and write IOPS, while the Western Digital WD5001AALS rendered 86 and the Seagate 7200.11 completing 77. The newer Mtron MOBI 3500 rendered 58 IOPS, which was worse than the older 3000 model. The OCZ Apex strugged to complete 9 IOPS, and its identically-designed G.Skill Titan managed o nly 8 IOPS. Clearly, the twin RAID-0 JMicron controllers are built for speed and not input/output operations. Next came the average I/O response time tests...

The Iometer random IOPS average response time test results were nearly an inverse order of the IOPS performance results. It's no surprise that SLC drives perform I/O processes far better than their MLC versions, but that gap is slowly closing as controller technology improves the differences and enhances cache buffer space. In our Read/Write IOPS performance the SLC OCZ Vertex EX achieves a dramatic lead ahead of the other SSDs tested.
OCZ's Vertex EX offered the fastest read and write response time, measuring 0.26/0.06ms, and showing strength in write requests. The RAID-0 set of Vertex MLC SSD's scored 0.58/0.07ms, dramatically improving the write-to response time over a single Vertex SSD which offered 0.42/0.77ms. The OCZ Summit responded to read requests in 0.78ms while write requests were a bit quicker at 0.59ms. These times were collectively the best available, as each product measured hereafter performed much slower.
The Mtron MOBI 3000 offered a fast 0.42ms read response time, but suffered a slower 8.97ms write response. Both the WD5001AALS and Seagate 7200.11 hard drives performed around 11ms read and 1.2ms write. Mtron's newer MOBI 3500 offered great read response times at 0.19ms, but suffered poor write responses at 17.19ms. The worst was yet to come, as the G.Skill Titan and OCZ Apex offered decent 0.42ms read response times but absulutely unacceptable 127ms write times.
Drive Hardware
-
Seagate 7200.11 500GB 3.5" ST3500320AS 7,200 RPM SATA-II Hard Disk Drive (32MB Cache Buffer)
-
Western Digital Cavier 500GB WD5001AALS 7,200 RPM SATA_II Hard Disk Drive (16MB Cache Buffer)
HD Tach RW Benchmark Results
EDITORS NOTE 05/10/2009: Benchmark Reviews has re-tested the OCZ Vertex with the latest v1.10 firmware, which includes TRIM support, and the resulting performance was generally identical to the previous firmware. Please remember that TRIM is a Windows 7 supported feature, and does not improve performance on Windows XP or Vista Operating Systesm.
Although HD Tach (and also HD Tune or Crystal Disk Benchmark) are all excellent tools for measuring Hard Disk Drive products, they fail to offer the same precision with Solid State Drive products. These programs offer only an approximate estimate of bandwidth speed through their quick-result sample-testing mechanisms, as I have proven in the Solid State Drive (SSD) Benchmark Performance Testing article published not long ago. Nevertheless, HD Tach is still useful for offering an alternative perspective at performance, even if it isn't precisely correct when used with SSD architecture.
HD Tach is a software program for Microsoft Windows that tests the sequential read, random access and interface burst speeds of the attached storage device. For the record. every single product tested was brand new and never used. HD Tach allows write-bandwidth tests only if no partition is present. Additionally, each and every product was tested five times with the highest and lowest results removed before having the average result displayed here. The graphical user interface (GUI) of the Windows-based benchmark tool HD Tach is very convenient. and allows the test product to be compared against others collected on your system or those registered into the Simpli Software database.
In the tests below, Benchmark Reviews utilizes the HD TachRW tool to compare the fastest collection of desktop drives and competing SSD's we can get our hands on. Using the Intel ICH10R SATA controller on the Gigabyte GA-EX58-UD4P, HD Tach was used to benchmark the test SSD five times with the best results displayed below. It's important to note that HD Tach's Burst Speed result should be ignored for Solid State Drives due to the cache methods inherent to each memory controller architecture. There are times where this number will be extremely high, which is a result of the optimized cache used for SSD's.
The important numbers used for comparison are the sustained read and write bandwidth speeds, which indicate an approximate performance level of the product. Our featured test item, the OCZ Vertex 120GB SATA SSD OCZSSD2-1VTX120G, performed at an average 236.6 MBps best sustained read speed and a best of 162.6 MBps sustained write bandwidth.

Looking at the peak maximum's charted in these illustrations, the OCZ Vertex had a very consistent read speed nearing 240 MBps while the write-to performance occasionally reached 225 MBps. Unfortunately though, HD Tach doesn't offer very consistent test results for the write-to performance on the Vertex SSD.


Compared against the stated specification of 200/160, our read results appear way beyond the conservative range OCZ set, but the write performance falls a little short of the advertised maximum speed. Keep in mind that HD Tach is only capable of offering approximate estimates for SSD products, as evidenced by the three very different write-to performances for the Vertex tests taken only minutes apart. The range of 131.3 to 162.6 MBps is a little wider than I would like for a test tool, but I've already warned that HD Tach is meant for Hard Drive products, hence the name. Now let's see how badly HD Tach reacts to a RAID-0 set of Vertex SSDs:

I've said it before, and I'm about to say it again: HD Tach is not a reliable tool for testing SSD performance. Taking a look at the single-Vertex versus RAID-0 Vertex SSD performance, you can see exactly what I mean. Judging from the HD Tach results, you might think that read-from performance in RAID-0 is worse than a single SSD, but it's not. I'll agree that the write-to bandwidth is better real world applications, just as it is in HD Tach, but otherwise the software isn't accurate and should be disregarded.
The chart below illustrates the collected averages for benchmark results using HD Tach RW on the Intel ICH10 SATA controller, with the read and write bandwidth results added together to determine rank placement. The first group is a collection of high-performance storage products. Positioned in first place and well above the RAID-0 performance a set of Western Digital VelociRaptor hard drives can offer, the OCZ Vertex outperforms every single storage drive product by a significant margin.
The OCZ Apex and Intel X25-M SSD both trail behind in overall performance and finish out the top four positions. Nearly every other storage product trails distantly behind these leaders, which all recorded a combined HD Tach bandwidth to over 300 MBps for each.
A single (non RAID-0) VelociRaptor and Seagate 7200.11 hard drive begin the next segment of upper midrange performers, offering nearly 200 MBps of combined bandwidth. Trailed by a closely-packed group consisting of the Patriot Warp v2 SSD, Silicon Power SP032GBSSD750S25, and G.Skill FM-25S2S-64GB, are SSDs generating between 168-172 MBps of combined average bandwidth.
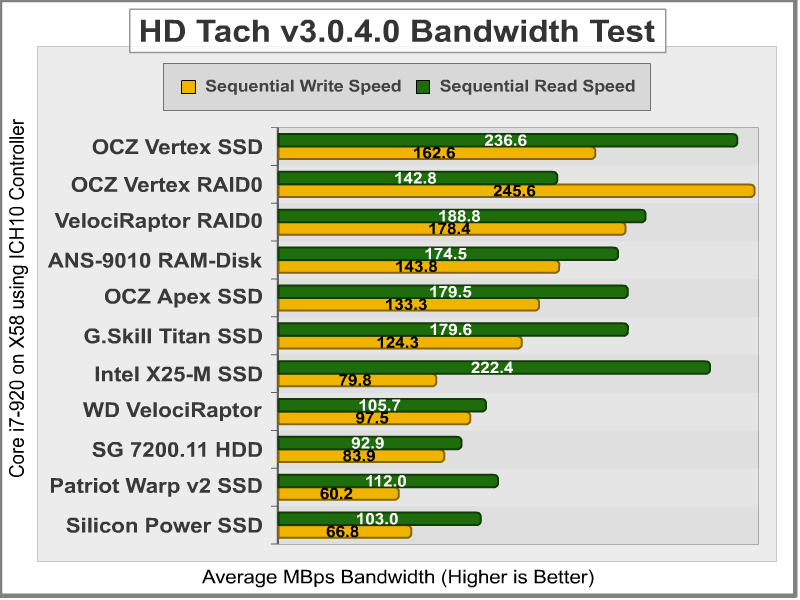
The lower-midrange SSD products begin with the Western Digital Raptor, scoring a combined total bandwidth of 154 MBps delivering half the performance of the leaders. Yesterday's high-performance SSD is today's low-performance drive, and the Mtron MOBI 3500, OCZ OCZSSD2-1S32G SSD, Super Talent MasterDrive MX SSD and Mtron MOBI 3000 all comprise products with less combined performance than Hard Disk Drive alternatives (except in regard to response time).
Drive Hardware
- OCZ Apex 120GB SATA SSD OCZSSD2-1APX120G
- OCZ Vertex 120GB SATA SSD OCZSSD2-1VTX120G (Firmware v1275)
-
Seagate 7200.11 500GB 3.5" ST3500320AS 7,200 RPM SATA-II Hard Disk Drive (32MB Cache Buffer)
-
Western Digital Raptor 74GB 3.5" WD740ADFD 10,000 RPM SATA Hard Disk Drive (16MB Cache Buffer)
-
Western Digital VelociRaptor 150GB WD1500HLFS 10,000 RPM SATA Hard Disk Drive (16MB Cache Buffer)
In our next section, the entire collection of SSD products Benchmark Reviews has tested will be timed for a Windows XP startup benchmark. Please continue to see how SSD's effect startup performance.
Windows XP Startup
EDITORS NOTE 05/10/2009: Benchmark Reviews has re-tested the OCZ Vertex with the latest v1.10 firmware, which includes TRIM support, and the resulting performance was generally identical to the previous firmware. Please remember that TRIM is a Windows 7 supported feature, and does not improve performance on Windows XP or Vista Operating Systesm.
After several SSD product reviews in which I recorded Windows XP startup time data, I have repeatedly omitted my results from the article for lack of enough comparison data. In all honesty, I cannot make this an interesting subject. Most of you reading this article have already watched the video of a Windows computer starting up in mere seconds when it used a Solid State Drive, so it wouldn't be very exciting to show it again. Instead, I have recorded the length of time it took for my Dell Inspiron 6400 notebook computer to startup with each drive. Here are the specifications on the notebook:
-
Dell Inspiron 6400 Notebook
-
Intel Core Duo T2300 @ 1.66 GHz
-
2GB DDR2 667 MHz System Memory
-
Windows XP Professional SP3 (identical image cloned to each drive)

This "test" is going to be useful to laptop computer users only, primarily because I did not test the desktop hard drives. The only hard drive included was the high-performance 7200 RPM Hitachi Travelstar 7K100, which recorded a 28-second load time from the moment I pressed the power button to the moment the Windows Login screen was displayed.
The primary purpose of this test was to demonstrate that a Solid State Drive could in fact cut the Windows load time in half, but there are other factors to consider. It's important to note that this particular Dell notebook consumes almost 11 seconds on the BIOS pre-loading and POST (Power-On Self Test) routine prior to actually beginning to load Microsoft Windows XP, so it's not realistic to think that my results would match another system identically.
Drive Hardware
-
Crucial / Lexar 32GB 2.5" SATA-2 SSD CT32GBFAB0
-
Hitachi Travelstar 5K160 2.5" 40GB SATA 5,400 RPM HDD HTS541640J9SA00 (8MB Cache Buffer)
-
Hitachi Travelstar 7K100 2.5" 60GB SATA 7,200 RPM HDD HTS721060G9SA00 (8MB Cache Buffer)
-
Kingston 80GB SATA SSD SSDSA2MH080G1GC
-
OCZ Vertex 120GB SATA SSD OCZSSD2-1VTX120G (Firmware v1275)
-
Samsung 64GB 2.5" SATA-2 SSD MCCOE64G5MPP-0VA
In the next section, I begin to summarize my final thoughts on the OCZ Vertex series SSD as well as Solid State Drives in general. Please continue on to see what I think of SSD technology in todays consumer market.
Heat Output Results
Solid State Drives are not quite a household technology (yet), and because of this the marketing propaganda has become as high-pressure as any political campaign. Benchmark Reviews has tested SSD products from many manufacturers (to name a few: Crucial, G.Skill, Intel, MemoRight, Mtron, OCZ, Patriot, Samsung, Super Talent, and Silicon Power) and each has taken full advantage of the vast new technology improvements offered by their products. Some manufacturers have made claims that other websites have taken to the mat, and wrestled with a topic (such as power consumption), only to later be criticized for improperly testing the hardware. Well, we don't intend on repeating the mistakes of our mega-site affiliates, which is why we plan to approach new methodology in small bites.
There have been television shows made famous on the principal of dispelling rumors and myth. This section is not exactly meant to imitate that concept, although we do separate fact from fiction. The first myth we challenge is the claim that Solid State Drives produce no heat. Nearly every manufacturer selling Solid State products has at some point claimed their SSD products do not produce heat, which is believable on many levels because there are no moving parts. Well, chances are very good that you have already peeked at the illustration below, so I won't delay in explaining what we've found.
Using some spare Styrofoam panels, I constructed a small unit to shield two 2.5" notebook drives from the nearby power supply. Although not pictured, there was also an open-top wall section that surrounded this unit, further insulating it from thermal effects of any nearby environment. Since there was no data connection made, these tests are what I would consider to be 'idle'. The power leads were connected and power was delivered for twenty minutes before temperatures were taken with a non-contact IR thermometer at approximately six inches from surface. The rooms ambient temperature as measured directly at the test site was exactly 19.0°C at the time I recorded the results for the units pictured.

In the image above there are only two devices pictured of a four-cell test platform. On the left side is the Hitachi Travelstar 7K100 60GB HTS721060G9SA00 7,200 RPM SATA 2.5" Hard Disk Drive, and on the right is one our Solid State Drive test subjects. The Hitachi 7K100 is one of the few 7200 RPM notebook hard drives available to OEM builders, and since these faster spinning disks use more power they also create more heat as a by-product. Although not pictured because of camera direction, my test rig setup compares up to four products at once. The results of other SSD test products are shown in the charts below.
Temperature Readings at 19.0°C
| Device Name | Ambient | Drive Temp |
| OCZ Apex Series SSD | 19.0°C | 31°C |
| Mtron Pro 7500 SSD | 19.0°C | 31°C |
| Mtron Pro 7000 SSD | 19.0°C | 29°C |
| Mtron Pro 3500 SSD | 19.0°C | 29°C |
| OCZ Core Series SSD | 19.0°C | 28°C |
| OCZ Vertex Series SSD | 19.0°C | 27°C |
| Hitachi Travelstar 7K100 HDD | 19.0°C | 27°C |
| Samsung MCCOE64G5MPP-0VA SSD | 19.0°C | 27°C |
| Silicon Power SP064GBSSD25SV10 SSD | 19.0°C | 27°C |
| Super Talent FTM60GK25H SSD | 19.0°C | 27°C |
| Mtron MOBI 3000 SSD | 19.0°C | 27°C |
| Silicon Power SP032GBSSD750S25 SSD | 19.0°C | 26°C |
| G.Skill FM-25S2S-64GB SSD | 19.0°C | 26°C |
| Crucial CT32GBFAB0 SSD | 19.0°C | 25°C |
| Patriot Warp SSD | 19.0°C | 25°C |
| Hitachi Travelstar 5K160 HDD | 19.0°C | 23°C |
| OCZ OCZSSD2 SSD | 19.0°C | 21°C |
The message here is simple: Although the heat produced by SSD's under load is usually the same as what the Hard Disk Drive generates at idle, Solid State Drives still produce heat. Don't let marketing hype fool you into believing that Solid State Drives are cold-operating devices just because there are no moving parts. Cooler, yes. Cold, no.
Drive Hardware
-
Crucial / Lexar 32GB 2.5" SATA-2 SSD CT32GBFAB0
-
Hitachi Travelstar 5K160 2.5" 40GB SATA 5,400 RPM HDD HTS541640J9SA00 (8MB Cache Buffer)
-
Hitachi Travelstar 7K100 2.5" 60GB SATA 7,200 RPM HDD HTS721060G9SA00 (8MB Cache Buffer)
-
Kingston 80GB SATA SSD SSDSA2MH080G1GC
-
Samsung 64GB 2.5" SATA-2 SSD MCCOE64G5MPP-0VA
SSD Final Thoughts
New technology always has one major hurdle to face: the consumer. I have long maintained my opinion that DDR3 system memory is every bit an excellent replacement to the aging DDR2 standard, but the argument of high price and limited adoption by manufacturers has hushed my position. Of course, everything changes in time, and an economic recession actually helped DDR3 make its way mainstream. Faced with a similar situation, Solid State Drive technology has suffered the same difficult transition towards widespread use. Like most electronics, it wasn't a question of how much of a technology improvement was evident, it was price.
Then at some point, a certain well-respected hardware website published an article that claimed SSDs didn't consume less power after all. Although this report was later recanted on account of testing errors, the foundation was shaken for consumers and led me to wonder what kind of impact my news of higher heat output will cause the adoption process? After all, I like these products, and completely endorse the technology. But the bad publicity, even when it's disproven, still has a lasting affect thanks to the angst a premium price tag creates. This also has me wondering how my SSD Benchmark Testing revelation will affect the market. Of course, time was once again the changing factor, and the latest SSD products make these perspectives obsolete.
![]()
So back in May of 2008 when I reviewed the OCZ SATA-II 32GB SSD it seemed like $17 per gigabyte was a relatively good price for SSDs at the time. Consider for a moment that before then, SSD's such the elite-level 32 GB MemoRight GT cost on the level of $33 per gigabyte. Even products like the entry-level 32 GB Mtron MOBI 3000 were still selling for $14 per gigabyte, making the price of admission seem quite high for even the lower-level SKU's. So when OCZ announced a 64GB SSD that would sell for under $259 in July of 2008, I really wasn't sure if the news was believable. It didn't take long to realize these claims were all true, because shortly thereafter NewEgg began listing these SSDs exactly as predicted. This event in itself should have probably started the long-awaited dawn of widespread consumer acceptance for SSD products... but there was a problem.
As it turned out, the first generation (v1) OCZ Core Series SSD I touted in my review was prone to long-term data corruption and occasional delay stuttering. Making matters worse was that the mail-in rebate nullified consumer ability to return the defective product for a refund. Nothing hurts progress more than an angry customer, and this incident created plenty. Later on, OCZ would issue a second version (v2) of the CORE series, and even though most problems were ironed out with firmware updates, a lingering fear of product reliability associated with Solid State Drives remained.
Once again, everything tends to change over time, and Solid State Drive sale prices are much different now. When it comes to computer hardware, generally speaking the newer, faster, and better performing products traditionally cost more than their older predecessors... but this is not the case with SSD's. I recognize that SSD bandwidth speeds range from abysmal to phenomenal and everywhere in-between, but the prices don't seem to correspond to performance. SSD's are filling store shelves, and several Solid State Drive models now sell for as low as $2.07 per gigabyte, which is getting dangerously close to Western Digital's VelociRaptor at $0.76 per gigabyte of storage.
So why are some Solid State Drives so affordable while others sell at 2-7x the cost? That's a very good question that only a particular group of manufacturers can answer. My best estimation is that the OEM's (Original Equipment Manufacturers) like OCZ, Patriot, Super Talent, and G.Skill (to name a few) receive discounts when using a common design under license. The opposite is true for ODM's (Original Design Manufacturers) such as MemoRight, Mtron, and Silicon Power, which must shoulder the burden of R&D and production. DRAM Prices have dropped beyond anyone's expectations, which has certainly helped, and consumers should soon reap the advantages.
Vertex RAID-0 Conclusion
EDITORS NOTE 05/10/2009: Benchmark Reviews has re-tested the OCZ Vertex with the latest v1.10 firmware, which includes TRIM support, and the resulting performance was generally identical to the previous firmware. Please remember that TRIM is a Windows 7 supported feature, and does not improve performance on Windows XP or Vista Operating Systesm.
Benchmark Reviews begins each conclusion with a short summary for each of the areas we rate. The first is presentation, which takes product packaging into consideration to the extent that it provides adequate packing material and consumer information for an informed purchase. Since the American economy in the midst of an economic recession, many manufacturers are having to pull out some very creative ideas to help market their products. Add onto this the fact that SSD technology already carries a premium price tag, and you can understand why product presentation becomes important. OCZ takes the Vertex series packaging back to basics with a simple-yet-catchy black and white appearance, while at the same time delivering critical product information and specifications for the untrained consumer.
Solid State Drives are a lot like spark plugs: you see them just long enough to install, and then they're forgotten. OCZ keeps production costs down on the Vertex SSD Series with a uniform black painted enclosure for all of their SSD products, and uses an adhesive label for each product series and underside specifications. There isn't very much to expect from the appearance of Solid State Drives, because like their Hard Disk Drive counterpart they are meant to place function before fashion. To this end, I still wish manufacturers would begin using sealed plastic enclosures to prevent moisture or electrical shock damage.

Construction is probably the strongest feature credited to the entire SSD product line, and OCZ products have never been an exception. Solid State Drives are by nature immune to most abuses, but add to this a hard metal shell and you have to wonder what it would take to make this drive fail. If an Vertex Series product does happen to fail during the 2-year warranty period, end-users can contact OCZ via the company website or extensive support forums. Fortunately, there's also a toll-free telephone number for support or customer service questions (800-459-1816).
Based on the collection of benchmark performance tests we've conducted, the OCZ Vertex offers linear bandwidth so far ahead of previous competition that it might require calling this a new generation product in order to justify how so many other 'new' products have just been left behind. The MLC Samsung flash DRAM modules paired to a 64MB cache buffer on this 120GB Vertex SSD help yield a 0.10 ms response time. ATTO Disk Benchmark tool reported an impressive 249 MBps maximum read bandwidth but only 138 MBps maximum write in our tests, while RAID-0 Vertex performance soared to 438/358 MBps. Lavalys EVEREST linear full-sector bandwidth performance was a steady 247.6 MBps read-from and impressive 225.2 MBps write-to speed, while RAID-0 Vertex SSDs raised the bandwidth to 504.9/437.2 MBps.
As of December 2009, the OCZ Vertex series of SSDs is available at NewEgg and other popular online retailers. A lower-capacity 30GB Vertex OCZSSD2-1VTX30G is sold for $99.99 after rebate, while the 60GB OCZSSD2-1VTX60G sells for $219 after rebate. The larger 120GB version we tested in this articles is offered for $409. A jumbo-sized 250GB version of the Vertex SSD is available for $829.
In conclusion, the OCZ Vertex MLC Solid State Drive offers tremendous performance in read and write bandwidth speeds and an exceptional 0.10 ms response time at a attainable price. As a single drive, the Vertex SSD is second to none (at least until OCZ launches the Summit SSD), and easily outperforms a RAID-0 set of Western Digital VelociRaptor hard drives. Place two OCZ Vertex SSDs into a RAID-0 striped array, and the results are phenomenal. The only drawback is price, which keeps the premium around $4 per gigabyte or storage space. I can recommend the OCZ Vertex to cutting-edge super-users and performance enthusiasts who want unmatched response and speed from their computer system.
EDITORS NOTE: Because of an extremely low failure rate for this product series, OCZ has to three years of coverage.
Pros:
+ Impressive 505 MBps read and 437 write RAID-0 bandwidth with EVEREST
+ 64MB Cache buffer permanently solves 'stuttering' problem
+ Very low 0.10 ms random access time
+ Lightweight compact storage solution
+ Resistant to extreme shock impact
+ Up to 250GB of SSD capacity
+ 2-Year OCZ product warranty
+ Low power consumption may extend battery life
Cons:
- Metal case is heavier and less durable than plastic
- Lacks integrated USB 2.0 Mini-B data connection
- Expensive premium-level product
Ratings:
-
Presentation: 8.75
-
Appearance: 8.75
-
Construction: 9.75
-
Functionality: 9.75
-
Value: 8.00
Final Score: 9.0 out of 10.
Excellence Achievement: Benchmark Reviews Golden Tachometer Award.
Questions? Comments? Benchmark Reviews really wants your feedback. We invite you to leave your remarks in our Discussion Forum.

Comments
When used on the bandwidth, make sure you fully understand what the bandwidth measures. In different network or cable setup, the bandwidth could be shared and a single device do not usually get that kind of bandwidth on average. On network, typically vendors means Megabytes when they denote MB unless otherwise denoted using fineprints, but the usual price is using Megabits which looks a lot better on paper.
##overclock.net/benchmarking-software-discussion/750979-benchmarking-3-120gb-ocz-vertex-ssds.html
Maybe you can take a look at my stuff and tell me why my linear read in Everest does not produce a flat line like yours (I realize I used 512MB block size, but the 1MB block size produced identical results), and why my numbers are so much lower when they should be higher. I have also ran the benchmarks without an OS (or any data) on the array at all, and the results are very similar. Any thoughts?
/index.php?option=com_content&task=view&id=635