| EVGA GeForce GTX 560 Titanium Video Card |
| Reviews - Featured Reviews: Video Cards | |||||||||||||||||||||||||||||||||||||||||||||||||||||||||||||||||||||||||||||||||||||||||||||||||||||||||||||||||||||||||||||||||||||||||||||||||||||||||||||||||||||||||||||||||||||||||||||||||||||||||||||||||||||||||||||||||||||||||||||||||||||||||||||||||||||||||||||||||||||||||||||||||||||||||||||||||||||||||||||||||||||||||||||||||||||||||||||||||||||||||||||||||||||||||||||||||||||||||||||||||||||||||||||||||||||||||||||||||||||||||||||||||||||||||||||||||||||||||||||||||||||||||||||||||||||||||||||||||||||||||||||||||||||||||||||||||||||||||||||||||||||||||||||||||||||||||||||||||||||||||||||||||||||||||||||||||||||||||||||||||||||||||||||||||||||||||||||||||||||||||||||||||||||||||||||||||||||||||||||||||||||||||||||||||||||||||||||||||||||||||||||||||||||||||||||||||||||||||||||||||||||||||||||||||||||||||||||||||||||||||||||||||||||||||||||||||||||||||||||||||||||||||||||||||||||||||||||||||||||||||||||||||||||||||||||||||||||||||||||||||||||||||||||||||||||||||||||||||||||||
| Written by Olin Coles | |||||||||||||||||||||||||||||||||||||||||||||||||||||||||||||||||||||||||||||||||||||||||||||||||||||||||||||||||||||||||||||||||||||||||||||||||||||||||||||||||||||||||||||||||||||||||||||||||||||||||||||||||||||||||||||||||||||||||||||||||||||||||||||||||||||||||||||||||||||||||||||||||||||||||||||||||||||||||||||||||||||||||||||||||||||||||||||||||||||||||||||||||||||||||||||||||||||||||||||||||||||||||||||||||||||||||||||||||||||||||||||||||||||||||||||||||||||||||||||||||||||||||||||||||||||||||||||||||||||||||||||||||||||||||||||||||||||||||||||||||||||||||||||||||||||||||||||||||||||||||||||||||||||||||||||||||||||||||||||||||||||||||||||||||||||||||||||||||||||||||||||||||||||||||||||||||||||||||||||||||||||||||||||||||||||||||||||||||||||||||||||||||||||||||||||||||||||||||||||||||||||||||||||||||||||||||||||||||||||||||||||||||||||||||||||||||||||||||||||||||||||||||||||||||||||||||||||||||||||||||||||||||||||||||||||||||||||||||||||||||||||||||||||||||||||||||||||||||||||||
| Tuesday, 25 January 2011 | |||||||||||||||||||||||||||||||||||||||||||||||||||||||||||||||||||||||||||||||||||||||||||||||||||||||||||||||||||||||||||||||||||||||||||||||||||||||||||||||||||||||||||||||||||||||||||||||||||||||||||||||||||||||||||||||||||||||||||||||||||||||||||||||||||||||||||||||||||||||||||||||||||||||||||||||||||||||||||||||||||||||||||||||||||||||||||||||||||||||||||||||||||||||||||||||||||||||||||||||||||||||||||||||||||||||||||||||||||||||||||||||||||||||||||||||||||||||||||||||||||||||||||||||||||||||||||||||||||||||||||||||||||||||||||||||||||||||||||||||||||||||||||||||||||||||||||||||||||||||||||||||||||||||||||||||||||||||||||||||||||||||||||||||||||||||||||||||||||||||||||||||||||||||||||||||||||||||||||||||||||||||||||||||||||||||||||||||||||||||||||||||||||||||||||||||||||||||||||||||||||||||||||||||||||||||||||||||||||||||||||||||||||||||||||||||||||||||||||||||||||||||||||||||||||||||||||||||||||||||||||||||||||||||||||||||||||||||||||||||||||||||||||||||||||||||||||||||||||||||
EVGA GeForce GTX 560 Titanium Video Card ReviewReplacing the GeForce GTX 470 is NVIDIA's Fermi GF114-based GeForce GTX 560 Titanium, a tuned variant of GF104.It's been nearly a decade since NVIDIA last used the Titanium moniker on one of their product, and for those who can still recall how the GeForce 4 series was revision of the previous series the new GeForce GTX 560 Ti will make perfect sense. Replacing the GeForce GTX 470 video card in the current product stack, NVIDIA's GeForce GTX 560 Ti uses a tuned GF114 GPU that finally delivers a full GF104 Fermi architecture. The original GF104 GPU offered seven of eight possible Streaming Multiprocessors (SM) with the GeForce GTX 460 video card, and now NVIDIA returns to enable that last SM to make even more cores available to GF114, now 384 compared to 336. Keeping with tradition, the GeForce GTX 560 Ti uses an identical SM configuration as the GeForce GTX 460. Each SM still offers 48 CUDA cores, four dispatch units, and eight texture/special function units. Besides including the eighth and final SM on the GPU, what's different is the myriad of transistor-level changes to improve power efficiency and in turn allowed for significantly faster clock speeds. In this article, Benchmark Reviews tests the EVGA GeForce GTX 560 Ti (model 01G-P3-1561-AR) against an entire market of graphics card options.
Fierce competition between NVIDIA and AMD have allowed PC gamers to enjoy the best graphics hardware ever developed for desktop computers. NVIDIA continues to update their product family, and now offers the GeForce GTX 560 to join ranks with the GTX 570 and 580 video cards. The GeForce GTX 560 Ti is intended to wow gamers in much the same way that their GeForce GTX 460 series did, but at a much higher level of performance. Packed with all eight SMs, the GF114 GPU is clocked to 822/1644 MHz on base models and 850/1700 on the EVGA 01G-P3-1561-AR
NVIDIA targets the GeForce GTX 560 Ti at upper-segment mainstream users willing to spend $250 on their discrete graphics. We use the most demanding PC video game titles and benchmark software available, graphical frame rate performance is tested against a large collection of competing desktop products. Using the DirectX-9 API that is native to Windows XP, we've compared products with Mafia II. Some older DirectX-10 favorites such as Crysis Warhead and PCMark Vantage are included, as well as newer DirectX-11 titles such as: Aliens vs Predator, Battlefield: Bad Company 2, BattleForge, Lost Planet 2, Metro 2033, Tom Clancy's HAWX2, and the Unigine Heaven 2.1 benchmark. Built to deliver the best possible graphical experience at its price point, EVGA's GeForce GTX 560 Ti video card delivers top-end frame rates with outstanding efficiency. We've even tested the GeForce GTX 560 Ti to confirm if it will play Call of Duty: Black Ops with every quality setting configured to maximum levels. Good things come to those who patiently wait, and the GeForce GTX 560 Titanium proves this. There's no easy way to compare the current SM assignment to past Fermi architectures because the formula changes between generations. Anyone who tries to claim that GF114 is a fully SM-equipped version of the GF104 has lost touch with the very essence of Fermi, in that it's configuration is modular. So then it is also unfair to compare the original GF100 generation of Fermi architecture to another like the GeForce GF110 series; especially since the ratio of shaders and texture units per SM has changed to favor modern video games more than it crunches CUDA calculations. As a direct result, GeForce GTX 560 Ti (and all other GF11x GPUs) outperform their predecessors clock for clock and watt for watt in PC video games.
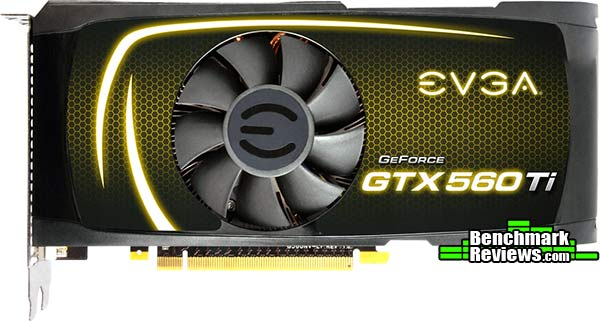
Manufacturer: EVGA, Inc. Full Disclosure: The product sample used in this article has been provided by EVGA. EVGA GeForce GTX 560 Ti Video CardAside from some minor cosmetic differences, EVGA's GeForce GTX 560 Ti looks incredibly similar to the GTX 460 in terms of general appearance, but in terms of size it's a little closer to the GeForce GTX 470 it replaces. The outer dimensions for the GeForce GTX 560 Ti give this 2.67" tall double-bay, 4.38" wide, 9.0" long graphics card a similar profile, but it's longer than the GTX 460 (8.25") and shorter than a GTX 470 (9.5" long). NVIDIA's reference cooler design uses a center-mounted 75mm fan, which is more than enough to adequately cool the Fermi GF114 GPU. With the Titanium name tag, it would be nice to see some partner products follow suit with an appropriate color scheme.
Although the power demands have been reduced, the EVGA GeForce GTX 560 Ti still requires two six-pin PCI-E power connections, which matches the end-of-life GeForce GTX 470. Similar to the GTX 460 shroud design, the GeForce GTX 560 Ti shares identical vents near the header panel. EVGA offers a mini-HDMI 1.4a digital A/V output on the GeForce GTX 560, which add-in partners may elect to remove or possibly further extend with a full-size adapter. Dual dual-link DVI digital outputs are retained on the GTX 560, which still means that at least two GeForce video cards will be needed for a NVIDIA 3D-Vision Surround functionality.
Rather than using a fan shroud with a deep chamfer depression paired to a blower motor fan, the GeForce GTX 560 Ti keeps fresh air moving to the fan with a concave-shaped plastic shroud. This design, paired with a fan that extends out past the surface of the shroud, allows more air to reach the intake whenever two or more video cards are combined in close-proximity SLI configurations. In terms of that SLI configuration, the GeForce GTX 560 Ti supports only dual-card sets. NVIDIA has designed triple-SLI capability into their upper-level 'GTX' family Fermi video cards: GeForce GTX 570 and 580 (GTX 465, 470, 480 in the past series). Despite the lower operating temperatures, special consideration for heat must be given to overclocked computers systems since multiple GPU's inside the computer case will further extend the CPU's heat range.
NVIDIA's GF114 GPU inside the GeForce GTX 560 Ti utilizes all four available 64-bit GDDR5 memory controllers to facilitate 256-bit bandwidth access to the frame buffer. The reference design enabled 1GB of 1000 MHz GDDR5 memory, but could potentially include the use of higher-density DRAM modules in the future. Replacing the Samsung 128MB 1250MHz K4G10325FE-HC04 GDDR5 IC's with 256MB IC parts such as: Samsung 1250MHz K4G20325FC-HC04 GDDR5, or 1500MHz K4G20325FC-HC03 might be possible.
NVIDIA designed the GTX 560 Ti for 170 watts Thermal Design Power (TDP), and suggests at least a 500W power supply unit. Compared to the original GeForce GTX 460 video card, the GTX 560 Ti incorporates features like four-phase power circuitry and improved GPU cooling. The aluminum finsink now offers three copper heat-pipe rods that span from processor to fin, instead of only two (on the GTX 460). Additionally, all of the power circuitry and memory modules have been cooled by using an extended baseplate. Benchmark Reviews tests GeForce GTX 560 Ti power consumption later in this article.
NVIDIA now dedicates hardware circuitry to the task of monitoring power consumption as well as temperature, adjusting performance to protect the graphics card from damage. Circled below are the electronic components responsible for power management on GeForce GTX 5xx series video cards (GTX 580 pictured). NVIDIA has indicated that this circuitry is optional, and that not all AIC partners will include it on their products. Benchmark Reviews uses GPU stress tools to measure maximum power usage, although admittedly no video game exists that would ever create comparable power demands.
In the next section, we detail the various Fermi products and lay out their features and specifications before putting them to test... NVIDIA Fermi FeaturesIn today's complex graphics, tessellation offers the means to store massive amounts of coarse geometry, with expand-on-demand functionality. In the NVIDIA GF100-series GPU, tessellation also enables more complex animations. In terms of model scalability, dynamic Level of Detail (LOD) allows for quality and performance trade-offs whenever it can deliver better picture quality over performance without penalty. Comprised of three layers (original geometry, tessellation geometry, and displacement map), the final product is far more detailed in shade and data-expansion than if it were constructed with bump-map technology. In plain terms, tessellation gives the peaks and valleys with shadow detail in-between, while previous-generation technology (bump-mapping) would give the illusion of detail.
Using GPU-based tessellation, a game developer can send a compact geometric representation of an object or character and the tessellation unit can produce the correct geometric complexity for the specific scene. Consider the "Imp" character illustrated above. On the far left we see the initial quad mesh used to model the general outline of the figure; this representation is quite compact even when compared to typical game assets. The two middle images of the character are created by finely tessellating the description at the left. The result is a very smooth appearance, free of any of the faceting that resulted from limited geometry. Unfortunately this character, while smooth, is no more detailed than the coarse mesh. The final image on the right was created by applying a displacement map to the smoothly tessellated third character to the left. Benchmark Reviews also more detail in our full-length NVIDIA GF100 GPU Fermi Graphics Architecture guide. GeForce GTX-Series Products
VGA Testing MethodologyThe Microsoft DirectX-11 graphics API is native to the Microsoft Windows 7 Operating System, and will be the primary O/S for our test platform. DX11 is also available as a Microsoft Update for the Windows Vista O/S, so our test results apply to both versions of the Operating System. The majority of benchmark tests used in this article are comparative to DX11 performance, however some high-demand DX10 tests have also been included. According to the Steam Hardware Survey published for the month ending September 2010, the most popular gaming resolution is 1280x1024 (17-19" standard LCD monitors). However, because this 1.31MP resolution is considered 'low' by most standards, our benchmark performance tests concentrate on higher-demand resolutions: 1.76MP 1680x1050 (22-24" widescreen LCD) and 2.30MP 1920x1200 (24-28" widescreen LCD monitors). These resolutions are more likely to be used by high-end graphics solutions, such as those tested in this article. In each benchmark test there is one 'cache run' that is conducted, followed by five recorded test runs. Results are collected at each setting with the highest and lowest results discarded. The remaining three results are averaged, and displayed in the performance charts on the following pages. A combination of synthetic and video game benchmark tests have been used in this article to illustrate relative performance among graphics solutions. Our benchmark frame rate results are not intended to represent real-world graphics performance, as this experience would change based on supporting hardware and the perception of individuals playing the video game. Intel X58-Express Test System
DirectX-9 Benchmark Applications
DirectX-10 Benchmark Applications
DirectX-11 Benchmark Applications
PCI-E 2.0 Graphics Cards
DX9+SSAO: Mafia IIMafia II is a single-player third-person action shooter developed by 2K Czech for 2K Games, and is the sequel to Mafia: The City of Lost Heaven released in 2002. Players assume the life of World War II veteran Vito Scaletta, the son of small Sicilian family who immigrates to Empire Bay. Growing up in the slums of Empire Bay teaches Vito about crime, and he's forced to join the Army in lieu of jail time. After sustaining wounds in the war, Vito returns home and quickly finds trouble as he again partners with his childhood friend and accomplice Joe Barbaro. Vito and Joe combine their passion for fame and riches to take on the city, and work their way to the top in Mafia II. Mafia II is a SSAO-enabled PC video game built on 2K Czech's proprietary Illusion game engine, which succeeds the LS3D game engine used in Mafia: The City of Lost Heaven. In our Mafia-II Video Game Performance article, Benchmark Reviews explored characters and gameplay while illustrating how well this game delivers APEX PhysX features on both AMD and NVIDIA products. Thanks to DirectX-11 APEX PhysX extensions that can be processed by the system's CPU, Mafia II offers gamers is equal access to high-detail physics regardless of video card manufacturer.
Mafia II Extreme Quality Settings
DX10: 3DMark Vantage3DMark Vantage is a PC benchmark suite designed to test the DirectX10 graphics card performance. FutureMark 3DMark Vantage is the latest addition the 3DMark benchmark series built by FutureMark corporation. Although 3DMark Vantage requires NVIDIA PhysX to be installed for program operation, only the CPU/Physics test relies on this technology. 3DMark Vantage offers benchmark tests focusing on GPU, CPU, and Physics performance. Benchmark Reviews uses the two GPU-specific tests for grading video card performance: Jane Nash and New Calico. These tests isolate graphical performance, and remove processor dependence from the benchmark results.
3DMark Vantage GPU Test: Jane NashOf the two GPU tests 3DMark Vantage offers, the Jane Nash performance benchmark is slightly less demanding. In a short video scene the special agent escapes a secret lair by water, nearly losing her shirt in the process. Benchmark Reviews tests this DirectX-10 scene at 1680x1050 and 1920x1200 resolutions, and uses Extreme quality settings with 8x anti-aliasing and 16x anisotropic filtering. The 1:2 scale is utilized, and is the highest this test allows. By maximizing the processing levels of this test, the scene creates the highest level of graphical demand possible and sorts the strong from the weak.
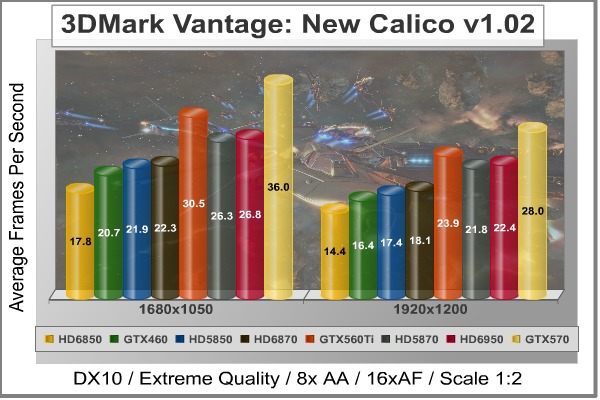
Jane Nash Extreme Quality Settings3DMark Vantage GPU Test: New CalicoNew Calico is the second GPU test in the 3DMark Vantage test suite. Of the two GPU tests, New Calico is the most demanding. In a short video scene featuring a galactic battleground, there is a massive display of busy objects across the screen. Benchmark Reviews tests this DirectX-10 scene at 1680x1050 and 1920x1200 resolutions, and uses Extreme quality settings with 8x anti-aliasing and 16x anisotropic filtering. The 1:2 scale is utilized, and is the highest this test allows. Using the highest graphics processing level available allows our test products to separate themselves and stand out (if possible).
New Calico Extreme Quality Settings
DX10: Crysis WarheadCrysis Warhead is an expansion pack based on the original Crysis video game. Crysis Warhead is based in the future, where an ancient alien spacecraft has been discovered beneath the Earth on an island east of the Philippines. Crysis Warhead uses a refined version of the CryENGINE2 graphics engine. Like Crysis, Warhead uses the Microsoft Direct3D 10 (DirectX-10) API for graphics rendering. Benchmark Reviews uses the HOC Crysis Warhead benchmark tool to test and measure graphic performance using the Airfield 1 demo scene. This short test places a high amount of stress on a graphics card because of detailed terrain and textures, but also for the test settings used. Using the DirectX-10 test with Very High Quality settings, the Airfield 1 demo scene receives 4x anti-aliasing and 16x anisotropic filtering to create maximum graphic load and separate the products according to their performance. Using the highest quality DirectX-10 settings with 4x AA and 16x AF, only the most powerful graphics cards are expected to perform well in our Crysis Warhead benchmark tests. DirectX-11 extensions are not supported in Crysis: Warhead, and SSAO is not an available option.
Crysis Warhead Moderate Quality Settings
DX11: Aliens vs PredatorAliens vs. Predator is a science fiction first-person shooter video game, developed by Rebellion, and published by Sega for Microsoft Windows, Sony PlayStation 3, and Microsoft Xbox 360. Aliens vs. Predator utilizes Rebellion's proprietary Asura game engine, which had previously found its way into Call of Duty: World at War and Rogue Warrior. The self-contained benchmark tool is used for our DirectX-11 tests, which push the Asura game engine to its limit. In our benchmark tests, Aliens vs. Predator was configured to use the highest quality settings with 4x AA and 16x AF. DirectX-11 features such as Screen Space Ambient Occlusion (SSAO) and tessellation have also been included, along with advanced shadows.
Aliens vs Predator Extreme Quality Settings
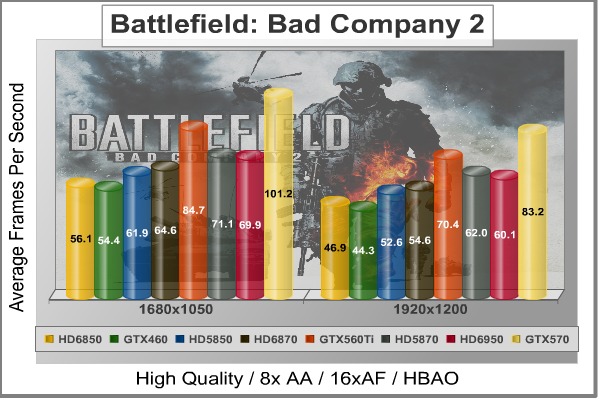
DX11: Battlefield Bad Company 2The Battlefield franchise has been known to demand a lot from PC graphics hardware. DICE (Digital Illusions CE) has incorporated their Frostbite-1.5 game engine with Destruction-2.0 feature set with Battlefield: Bad Company 2. Battlefield: Bad Company 2 features destructible environments using Frostbit Destruction-2.0, and adds gravitational bullet drop effects for projectiles shot from weapons at a long distance. The Frostbite-1.5 game engine used on Battlefield: Bad Company 2 consists of DirectX-10 primary graphics, with improved performance and softened dynamic shadows added for DirectX-11 users. At the time Battlefield: Bad Company 2 was published, DICE was also working on the Frostbite-2.0 game engine. This upcoming engine will include native support for DirectX-10.1 and DirectX-11, as well as parallelized processing support for 2-8 parallel threads. This will improve performance for users with an Intel Core-i7 processor. Unfortunately, the Extreme Edition Intel Core i7-980X six-core CPU with twelve threads will not see full utilization. In our benchmark tests of Battlefield: Bad Company 2, the first three minutes of action in the single-player raft night scene are captured with FRAPS. Relative to the online multiplayer action, these frame rate results are nearly identical to daytime maps with the same video settings. The Frostbite-1.5 game engine in Battlefield: Bad Company 2 appears to equalize our test set of video cards, and despite AMD's sponsorship of the game it still plays well using any brand of graphics card.
Battlefield Bad Company 2 Extreme Quality Settings
DX11: BattleForgeBattleForge is free Massive Multiplayer Online Role Playing Game (MMORPG) developed by EA Phenomic with DirectX-11 graphics capability. Combining strategic cooperative battles, the community of MMO games, and trading card gameplay, BattleForge players are free to put their creatures, spells and buildings into combination's they see fit. These units are represented in the form of digital cards from which you build your own unique army. With minimal resources and a custom tech tree to manage, the gameplay is unbelievably accessible and action-packed. Benchmark Reviews uses the built-in graphics benchmark to measure performance in BattleForge, using Very High quality settings (detail) and 8x anti-aliasing with auto multi-threading enabled. BattleForge is one of the first titles to take advantage of DirectX-11 in Windows 7, and offers a very robust color range throughout the busy battleground landscape. The charted results illustrate how performance measures-up between video cards when Screen Space Ambient Occlusion (SSAO) is enabled.
EDITOR'S NOTE: AMD is aware of performance concerns with BattleForge, and offered us an official response:
BattleForge Extreme Quality Settings
DX11: Lost Planet 2Lost Planet 2 is the second installment in the saga of the planet E.D.N. III, ten years after the story of Lost Planet: Extreme Condition. The snow has melted and the lush jungle life of the planet has emerged with angry and luscious flora and fauna. With the new environment comes the addition of DirectX-11 technology to the game. Lost Planet 2 takes advantage of DX11 features including tessellation and displacement mapping on water, level bosses, and player characters. In addition, soft body compute shaders are used on 'Boss' characters, and wave simulation is performed using DirectCompute. These cutting edge features make for an excellent benchmark for top-of-the-line consumer GPUs. The Lost Planet 2 benchmark offers two different tests, which serve different purposes. This article uses tests conducted on benchmark B, which is designed to be a deterministic and effective benchmark tool featuring DirectX 11 elements.
Lost Planet 2 Moderate Quality Settings
|
|||||||||||||||||||||||||||||||||||||||||||||||||||||||||||||||||||||||||||||||||||||||||||||||||||||||||||||||||||||||||||||||||||||||||||||||||||||||||||||||||||||||||||||||||||||||||||||||||||||||||||||||||||||||||||||||||||||||||||||||||||||||||||||||||||||||||||||||||||||||||||||||||||||||||||||||||||||||||||||||||||||||||||||||||||||||||||||||||||||||||||||||||||||||||||||||||||||||||||||||||||||||||||||||||||||||||||||||||||||||||||||||||||||||||||||||||||||||||||||||||||||||||||||||||||||||||||||||||||||||||||||||||||||||||||||||||||||||||||||||||||||||||||||||||||||||||||||||||||||||||||||||||||||||||||||||||||||||||||||||||||||||||||||||||||||||||||||||||||||||||||||||||||||||||||||||||||||||||||||||||||||||||||||||||||||||||||||||||||||||||||||||||||||||||||||||||||||||||||||||||||||||||||||||||||||||||||||||||||||||||||||||||||||||||||||||||||||||||||||||||||||||||||||||||||||||||||||||||||||||||||||||||||||||||||||||||||||||||||||||||||||||||||||||||||||||||||||||||||||||


| Graphics Card | Radeon HD6850 | GeForce GTX460 | Radeon HD5850 | Radeon HD6870 | GeForce GTX560 | Radeon HD5870 | Radeon HD 6950 | GeForce GTX570 |
| GPU Cores | 960 | 336 | 1440 | 1120 | 384 | 1600 | 1408 | 480 |
| Core Clock (MHz) | 775 | 675 | 725 | 900 | 850 | 850 | 800 | 732 |
| Shader Clock (MHz) | N/A | 1350 | N/A | N/A | 1700 | N/A | N/A | 1464 |
| Memory Clock (MHz) | 1000 | 900 | 1000 | 1050 | 1026 | 1200 | 1250 | 950 |
| Memory Amount | 1024MB GDDR5 | 1024MB GDDR5 | 1024MB GDDR5 | 1024MB GDDR5 | 1024MB GDDR5 | 1024MB GDDR5 | 2048MB GDDR5 | 1280MB GDDR5 |
| Memory Interface | 256-bit | 256-bit | 256-bit | 256-bit | 256-bit | 256-bit | 256-bit | 320-bit |
DX11: Tom Clancy's HAWX2
Tom Clancy's H.A.W.X.2 has been optimized for DX11 enabled GPUs and has a number of enhancements to not only improve performance with DX11 enabled GPUs, but also greatly improve the visual experience while taking to the skies. The game uses a hardware terrain tessellation method that allows a high number of detailed triangles to be rendered entirely on the GPU when near the terrain in question. This allows for a very low memory footprint and relies on the GPU power alone to expand the low resolution data to highly realistic detail.
The Tom Clancy's HAWX2 benchmark uses normal game content in the same conditions a player will find in the game, and allows users to evaluate the enhanced visuals that DirectX-11 tessellation adds into the game. The Tom Clancy's HAWX2 benchmark is built from exactly the same source code that's included with the retail version of the game. HAWX2's tessellation scheme uses a metric based on the length in pixels of the triangle edges. This value is currently set to 6 pixels per triangle edge, which provides an average triangle size of 18 pixels.
The end result is perhaps the best tessellation implementation seen in a game yet, providing a dramatic improvement in image quality over the non-tessellated case, and running at playable frame rates across a wide range of graphics hardware.
- Tom Clancy's HAWX 2 Benchmark 1.0.4
- Extreme Settings: (Maximum Quality, 8x AA, 16x AF, DX11 Terrain Tessellation)

Tom Clancy's HAWX2 Extreme Quality Settings
| Graphics Card | Radeon HD6850 | GeForce GTX460 | Radeon HD5850 | Radeon HD6870 | GeForce GTX560 | Radeon HD5870 | Radeon HD 6950 | GeForce GTX570 |
| GPU Cores | 960 | 336 | 1440 | 1120 | 384 | 1600 | 1408 | 480 |
| Core Clock (MHz) | 775 | 675 | 725 | 900 | 850 | 850 | 800 | 732 |
| Shader Clock (MHz) | N/A | 1350 | N/A | N/A | 1700 | N/A | N/A | 1464 |
| Memory Clock (MHz) | 1000 | 900 | 1000 | 1050 | 1026 | 1200 | 1250 | 950 |
| Memory Amount | 1024MB GDDR5 | 1024MB GDDR5 | 1024MB GDDR5 | 1024MB GDDR5 | 1024MB GDDR5 | 1024MB GDDR5 | 2048MB GDDR5 | 1280MB GDDR5 |
| Memory Interface | 256-bit | 256-bit | 256-bit | 256-bit | 256-bit | 256-bit | 256-bit | 320-bit |
DX11: Unigine Heaven 2.1
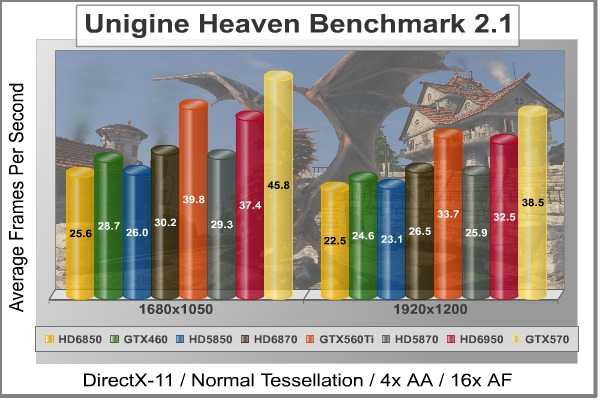
The Unigine Heaven 2.1 benchmark is a free publicly available tool that grants the power to unleash the graphics capabilities in DirectX-11 for Windows 7 or updated Vista Operating Systems. It reveals the enchanting magic of floating islands with a tiny village hidden in the cloudy skies. With the interactive mode, emerging experience of exploring the intricate world is within reach. Through its advanced renderer, Unigine is one of the first to set precedence in showcasing the art assets with tessellation, bringing compelling visual finesse, utilizing the technology to the full extend and exhibiting the possibilities of enriching 3D gaming.
The distinguishing feature in the Unigine Heaven benchmark is a hardware tessellation that is a scalable technology aimed for automatic subdivision of polygons into smaller and finer pieces, so that developers can gain a more detailed look of their games almost free of charge in terms of performance. Thanks to this procedure, the elaboration of the rendered image finally approaches the boundary of veridical visual perception: the virtual reality transcends conjured by your hand.
Although Heaven-2.1 was recently released and used for our DirectX-11 tests, the benchmark results were extremely close to those obtained with Heaven-1.0 testing. Since only DX11-compliant video cards will properly test on the Heaven benchmark, only those products that meet the requirements have been included.
- Unigine Heaven Benchmark 2.1
- Extreme Settings: (High Quality, Normal Tessellation, 16x AF, 4x AA
Heaven 2.1 Moderate Quality Settings
| Graphics Card | Radeon HD6850 | GeForce GTX460 | Radeon HD5850 | Radeon HD6870 | GeForce GTX560 | Radeon HD5870 | Radeon HD 6950 | GeForce GTX570 |
| GPU Cores | 960 | 336 | 1440 | 1120 | 384 | 1600 | 1408 | 480 |
| Core Clock (MHz) | 775 | 675 | 725 | 900 | 850 | 850 | 800 | 732 |
| Shader Clock (MHz) | N/A | 1350 | N/A | N/A | 1700 | N/A | N/A | 1464 |
| Memory Clock (MHz) | 1000 | 900 | 1000 | 1050 | 1026 | 1200 | 1250 | 950 |
| Memory Amount | 1024MB GDDR5 | 1024MB GDDR5 | 1024MB GDDR5 | 1024MB GDDR5 | 1024MB GDDR5 | 1024MB GDDR5 | 2048MB GDDR5 | 1280MB GDDR5 |
| Memory Interface | 256-bit | 256-bit | 256-bit | 256-bit | 256-bit | 256-bit | 256-bit | 320-bit |
Fermi GF114 GPU Overclocking
AMD and NVIDIA already stretch their GPUs pretty thin in terms of overclocking head room, but there's a difference between thin and non-existent. In this section, Benchmark Reviews overclocks the EVGA GeForce GTX 560 Ti video card using MSI's free Afterburner utility. The MSI Afterburner "Graphics Card Performance Booster" application offers several adjustable variables to reach the desired overclock, and allows for voltage changes (increase/decrease). The aim of this project is to push the Fermi GF110 GPU as far as it could go without any extra power applied. Beginning with the maximum stable GPU clock speed, I slowly increased the settings until I began to see screen tearing or the Forceware driver crashed. Once I reached the most stable GPU speeds, I put the video card back into action with high-demand video games for additional benchmark tests. Here are those results:
Fermi GF114 GPU Overclocking Results
| Test Item | Standard GPU | Overclocked GPU/RAM | Improvement | |||
| GeForce GTX 560 Ti | 850/1700 MHz | 950/1900 MHz | 128/256 MHz | |||
| DX9+SSAO: Mafia II | 49.7 | 53.1 | 3.4 FPS (6.8%) | |||
| DX10: 3dMark Jane Nash | 28.2 | 30.5 | 2.3 FPS (8.2%) | |||
| DX10: 3dMark Calico | 23.9 | 26.0 | 2.1 FPS (8.8%) | |||
| DX10: Crysis Warhead | 28 | 31 | 3 FPS (10.7%) | |||
| DX11: Aliens vs Predator | 30.7 | 32.3 |
1.6 FPS (5.2%) |
|||
| DX11: Battlefield BC2 | 70.4 | 74.7 | 4.3 FPS (6.1%) | |||
| DX11: Metro 2033 | 23.6 | 25.4 | 1.8 FPS (7.6%) | |||
| DX11: Heaven 2.1 | 33.7 | 36.1 | 2.4 FPS (7.1%) |
Overclocking Summary: NVIDIA intentionally 'overbuilt' the GeForce GTX 560 Ti with plenty of headroom for overclockers. While our testing kept stock power levels, most users (and several AIC partners) will offer over-volted versions of this product. Our test results show a 5.2-10.7% average increase in performance (at 1920x1200 resolution), which usually amounts to an added 3+ FPS in games. In comparison, an overclocked GeForce GTX 580 increased performance to 4.0-7.3% in video frame rates, while the AMD Radeon HD 6870 was limited to 6.5-9.3%. This reinforces the notion that higher-end processors have the least amount of headroom, but every extra frame translates into an advantage over your enemy.
EVGA GeForce GTX 560 Ti Temperatures
Benchmark tests are always nice, so long as you care about comparing one product to another. But when you're an overclocker, gamer, or merely a PC hardware enthusiast who likes to tweak things on occasion, there's no substitute for good information. Benchmark Reviews has a very popular guide written on Overclocking Video Cards, which gives detailed instruction on how to tweak a graphics cards for better performance. Of course, not every video card has overclocking head room. Some products run so hot that they can't suffer any higher temperatures than they already do. This is why we measure the operating temperature of the video card products we test.

To begin my testing, I use GPU-Z to measure the temperature at idle as reported by the GPU. Next, I use a modified version of FurMark's "Torture Test" to defeat NVIDIA's power monitoring and generate the maximum thermal load. This allows us to record absolute maximum GPU temperatures at high-power 3D mode. The ambient room temperature remained at a stable 20°C throughout testing. FurMark does two things extremely well: drives the thermal output of any graphics processor much higher than any video games realistically could, and it does so with consistency every time. Furmark works great for testing the stability of a GPU as the temperature rises to the highest possible output. The temperatures discussed below are absolute maximum values, and not representative of real-world temperatures while gaming:
| Video Card | Idle Temp | Loaded Temp | Ambient | |||
| ATI Radeon HD 5850 | 39°C | 73°C | 20°C | |||
| NVIDIA GeForce GTX 460 | 26°C | 65°C | 20°C | |||
| AMD Radeon HD 6850 | 42°C | 77°C | 20°C | |||
| AMD Radeon HD 6870 | 39°C | 74°C | 20°C | |||
| ATI Radeon HD 5870 | 33°C | 78°C | 20°C | |||
| EVGA GeForce GTX 560 Ti | 28°C | 79°C | 20°C | |||
| NVIDIA GeForce GTX 570 | 32°C | 82°C | 20°C | |||
| NVIDIA GeForce GTX 580 | 32°C | 70°C | 20°C |
Although the GeForce GTX 560 Ti uses all eight Streaming Multiprocessors on the GF114 GPU, the temperatures certainly don't show it. Resting idle at only 28°C in a 20°C room, the GeForce GTX 560 Ti nearly matches the GTX 460 as the coolest running video card we've recently tested. Once the GPU was stressed to 100% with Furmark the differences began to surface. The GeForce GTX 560 Ti produced 79°C under full load (measured at 20°C ambient after ten minutes), which is only 3°C lower than a GTX 580 and equal to the ATI Radeon HD 5870.
VGA Power Consumption
For power consumption tests, Benchmark Reviews utilizes an 80-PLUS GOLD certified OCZ Z-Series Gold 850W PSU, model OCZZ850. This power supply unit has been tested to provide over 90% typical efficiency by Chroma System Solutions. To measure isolated video card power consumption, Benchmark Reviews uses the Kill-A-Watt EZ (model P4460) power meter made by P3 International.
A baseline measurement is taken without any video card installed on our test computer system, which is allowed to boot into Windows 7 and rest idle at the login screen before power consumption is recorded. Once the baseline reading has been taken, the graphics card is installed and the system is again booted into Windows and left idle at the login screen before taking the idle reading. Our final loaded power consumption reading is taken with the video card running a stress test using FurMark. Below is a chart with the isolated video card power consumption (system without video card minus measured total) displayed in Watts for each specified test product:
VGA Product Description(sorted by combined total power) |
Idle Power |
Loaded Power |
|---|---|---|
NVIDIA GeForce GTX 480 SLI Set |
82 W |
655 W |
NVIDIA GeForce GTX 590 Reference Design |
53 W |
396 W |
ATI Radeon HD 4870 X2 Reference Design |
100 W |
320 W |
AMD Radeon HD 6990 Reference Design |
46 W |
350 W |
NVIDIA GeForce GTX 295 Reference Design |
74 W |
302 W |
ASUS GeForce GTX 480 Reference Design |
39 W |
315 W |
ATI Radeon HD 5970 Reference Design |
48 W |
299 W |
NVIDIA GeForce GTX 690 Reference Design |
25 W |
321 W |
ATI Radeon HD 4850 CrossFireX Set |
123 W |
210 W |
ATI Radeon HD 4890 Reference Design |
65 W |
268 W |
AMD Radeon HD 7970 Reference Design |
21 W |
311 W |
NVIDIA GeForce GTX 470 Reference Design |
42 W |
278 W |
NVIDIA GeForce GTX 580 Reference Design |
31 W |
246 W |
NVIDIA GeForce GTX 570 Reference Design |
31 W |
241 W |
ATI Radeon HD 5870 Reference Design |
25 W |
240 W |
ATI Radeon HD 6970 Reference Design |
24 W |
233 W |
NVIDIA GeForce GTX 465 Reference Design |
36 W |
219 W |
NVIDIA GeForce GTX 680 Reference Design |
14 W |
243 W |
Sapphire Radeon HD 4850 X2 11139-00-40R |
73 W |
180 W |
NVIDIA GeForce 9800 GX2 Reference Design |
85 W |
186 W |
NVIDIA GeForce GTX 780 Reference Design |
10 W |
275 W |
NVIDIA GeForce GTX 770 Reference Design |
9 W |
256 W |
NVIDIA GeForce GTX 280 Reference Design |
35 W |
225 W |
NVIDIA GeForce GTX 260 (216) Reference Design |
42 W |
203 W |
ATI Radeon HD 4870 Reference Design |
58 W |
166 W |
NVIDIA GeForce GTX 560 Ti Reference Design |
17 W |
199 W |
NVIDIA GeForce GTX 460 Reference Design |
18 W |
167 W |
AMD Radeon HD 6870 Reference Design |
20 W |
162 W |
NVIDIA GeForce GTX 670 Reference Design |
14 W |
167 W |
ATI Radeon HD 5850 Reference Design |
24 W |
157 W |
NVIDIA GeForce GTX 650 Ti BOOST Reference Design |
8 W |
164 W |
AMD Radeon HD 6850 Reference Design |
20 W |
139 W |
NVIDIA GeForce 8800 GT Reference Design |
31 W |
133 W |
ATI Radeon HD 4770 RV740 GDDR5 Reference Design |
37 W |
120 W |
ATI Radeon HD 5770 Reference Design |
16 W |
122 W |
NVIDIA GeForce GTS 450 Reference Design |
22 W |
115 W |
NVIDIA GeForce GTX 650 Ti Reference Design |
12 W |
112 W |
ATI Radeon HD 4670 Reference Design |
9 W |
70 W |
The EVGA GeForce GTX 560 Ti surprised us with chilly idle and lukewarm loaded temperatures (previous section), but the surprises keep coming as we measure power consumption. All reference GeForce GTX 560 Ti video cards will require two 6-pin PCI-E power connections for proper operation. Resting at idle with no GPU load, the EVGA GeForce GTX 560 Ti consumed a mere 17W - identical to the GTX 460 by our measure. Compensating for a small margin of error, this also roughly matches idle power draw from the ATI Radeon HD 5770 and AMD Radeon HD 6850. Compared to the GeForce GTX 470 for which it replaces, the GTX 560 Ti is nearly 176% more efficient at idle.
Once 3D-applications begin to demand power from the GPU, electrical power consumption climbs. Because the GeForce GTX 500-series uses new hardware power monitoring technology not included on previous GeForce models, we've had to work around the power-throttling effects enabled when using FurMark or OCCT. To do so, we merely renamed Furmark.exe to renamed.exe and changed some file names and locations. Measured at full throttle with FurMark's 3D torture load, the GeForce GTX 560 Ti topped out at 199W maximum power draw. NVIDIA's stated max TDP is 170W, measured as maximum power draw in real world applications. Our measurements are absolute maximums, since Furmark is not representative of real-world gaming power draw.
EVGA GeForce GTX 560 Ti Conclusion
IMPORTANT: Although the rating and final score mentioned in this conclusion are made to be as objective as possible, please be advised that every author perceives these factors differently at various points in time. While we each do our best to ensure that all aspects of the product are considered, there are often times unforeseen market conditions and manufacturer changes which occur after publication that could render our rating obsolete. Please do not base any purchase solely on our conclusion, as it represents our product rating specifically for the product tested which may differ from future versions. Benchmark Reviews begins our conclusion with a short summary for each of the areas that we rate.
Beginning with frame rate performance, the GeForce GTX 560 Ti video card demonstrated to us that NVIDIA has tuned the GF114 well enough to easily replace the GeForce GTX 470 series. At the 850 MHz reference speed, the EVGA GeForce GTX 560 Ti performed nicely against higher-priced competition. Able to tap another 100 MHz from the GF114 GPU, each game we tested received a 5.2-10.7% boost to frame rate performance. The GTX 560 Titanium beats ATI's Radeon HD 5870 in Aliens vs Predator and Metro 2033 at the more expensive $280 price point, and then goes on to challenge the next price market segment with success. Priced at $300, the AMD Radeon HD 6950 succumbs to the GTX 560 Ti in 3DMark Vantage New Calico, Crysis Warhead, Battlefield Bad Company 2, BattleForge, Lost Planet 2, and Unigine Heaven 2.1. Clearly, the GTX 560 Ti is a video card series with the same value:performance potential that made the GTX 460 a popular choice for budget gamers.
DirectX-9 games performed extremely well with all of the setting turned up high and played at 1920x1200 resolution. Mafia-II with SSAO easily pushed 50 FPS with PhysX turned off, and kept pace with the slightly more expensive Radeon HD 5870. Call of Duty: Black Ops was easily tweaked to use the highest settings possible, and had extremely fluid performance during action-packed multiplayer games. In DirectX 10 game tests, Crysis Warhead kept an average 28 FPS and edged out the much more expensive AMD Radeon 6950 video card. Battlefield: Bad Company 2 used 8x anti-aliasing and 16x anisotropic filtering, and yet the GTX 560 Ti still pushed past 70 FPS and dominated the Radeon HD 6950. DirectX 11 Aliens vs Predator puts the GeForce GTX 560 Ti at 31 FPS on average, matching performance with the Radeon 5870. Lost Planet 2 required 2x AA in order to produce 40 FPS frame rates, but still surpassed the Radeon HD 5870 and 6850 by more than 7 FPS. Metro 2033 isn't a game for mainstream graphics, yet the GTX 560 Ti was still able to play with 24 FPS on average.

Appearance is a more subjective matter since the rating doesn't have benchmark scores to fall back on. Partners traditionally offer their own unique twist on the design, with improved cooling solutions and colorful fan shroud designs. This might not happen with the GeForce GTX 560 Ti, because the video card operates so efficiently that improving an already effective cooling solution would be superfluous. The reference design allows nearly all of the heated air to externally exhaust outside of the computer case, which could be critically important to overclockers wanting the best possible environment for their computer hardware. This deeply concaved plastic shroud and raised fan help preserve the Fermi GF114 GPU in SLI sets. Overall, the GTX 560 Ti might not look as tough as the GTX 570/580, but it looks just nearly identical to the GTX 460.
If NVIDIA was accurate in pricing the GeForce GTX 560 Titanium at the $250 price point, they've done well to attack a hole in the market. Heading into February 2011, the ATI Radeon HD 5870 still sells for $280 at its best while the AMD Radeon HD 6950 sells for $300. Since the EVGA GeForce GTX 560 Ti often compete with both of these cards in terms of FPS performance, this could be the GTX 460 all over again for mid-range bargain shoppers. As of 25 January 2011, Newegg sells the EVGA 01G-P3-1561-AR model for $259.99. Newegg also lists the faster EVGA SuperClocked 01G-P3-1563-AR model for $279.99.
In summary, the GF114 GPU inside the EVGA GTX 560 Titanium is the perfect replacement for the now end-of-life GTX 470. Because this product is named similarly to the GTX 460 from the previous generation, consumers might think that this is a mainstream graphics card. Considering the price and performance, it's safer to consider the GTX 560 series as a solid part of the upper midrange market segment and allow the upcoming GeForce GTS 550 to prove itself worthy of mainstream praise and prices. Still, by matching performance with the more expensive options, it won't be long before the EVGA GeForce GTX 560 Ti does one of two things: become a sought-after $250 product or have the price increased to match the competition.
So what do you think of EVGA's GeForce GTX 560 Ti video card? Leave comments below, or ask questions in our Forum.
Pros:
+ Plenty of overclocking headroom for enthusiasts!
+ Outperforms Radeon HD 5870 and 6950 video card
+ Great performance for ultra high-end games
+ Much lower power consumption vs GTX 470
+ Reduced heat output and cooling fan noise
+ Fan exhausts all heated air outside of case
+ Includes native HDMI audio/video output
+ Adds 32x CSAA post-processing detail
+ Supports dual-card SLI functionality
+ Adds GDDR5 Error Correcting Code (ECC)
Cons:
- Premium-priced mainstream product
Related Articles:
- HIS HD7850 IceQ X Turbo X 2GB Video Card
- Desktop Computer Hardware Component Predictions
- Logitech ClearChat PC Wireless Headset 981-000068
- X79 Express Motherboard Performance Comparison
- Cooler Master Sniper CM Storm Case
- Thermalright Silver Arrow CPU Cooler
- QNAP TS-209 Pro Gigabit SATA NAS
- ATI Radeon HD 5830 DirectX-11 Video Card
- Antec Notebook Cooler 200
- Corsair Vengeance 1866 MHz DDR3 Memory Kit

Comments
Been holding out on my Sandy Bridge Mini-ITX system until this card shows up, and I'm set on using the Sugo SG05-450. If this card will fit and can be powered by the 450W Strider then it's going in, otherwise I'm going GTX 460 instead.
There are also manufacturers with custom build coolers and pcb`s that put the PCI-E connectors on the side.
I know Asus, MSI and Gigabyte do. They should fit in these cases.
All reference cards have the PCI-E connectors facing rearwards
As for the power caracteristics Nvidia advises a 500watt minimum.
But the high quality 450watt 80plus bronse powersupply fitted in these cases should be easy enough for these cards.
I would not worry about it. Good luck with your build
Good luck with your build!
As far as the rest of the kit goes, here's the full proposed spec:
Core i5 2400
Gigabyte H67N-USB3 Mini-ITX board
2x4GB DDR3 RAM (more than likely a 1.5V kit)
GTX 560
OCZ Vertex 2E 120GB SSD
WD Scorpio Black 500GB HDD
Slimline Blu-Ray/DVD-RW
Antec Kuhler H20 630 OR Prolimatech Samuel 17 with AP121 Air Penetrator
NO overclocking at all (H67 chipset obviously), undervolting where/if possible.
The PSU that's in the SG05-450 is Silverstone' Strider ST45SF 450W
Just have to wait for card and motherboard availability now. Hopefully the Kuhler won't be long either so I can get some benches on that. Antec's promo video wasn't too impressive (4.2GHz 980X averaging 83 degrees at 100% load is NOT cool), but it's not like Sandy Bridge is all that toasty.
Sorry for the wrong information
There was a Sugo SG05 build that crammed in a GTX 280 a few years back. Although Silverstone state that the SG05 can take 9" cards, there's a bit of extra space (half inch I think) between the chassis and the front panel if you dremel out a hole and he put his PCI-E cables in that space.
I may do that if push comes to shove, but I'll hang on for a bit to see if Palit/Gainward do a shorter version like they did with the GTX 460, or wait for more GTX 560s to hit the shelves and see who puts the connectors on the top/side.
As an aside, I don't like the front of the SG06 - I love the aluminium face and having the fan inlets on the side, but bending back in for the optical drive just gives is a stupid bump IMO - what was wrong with a perfectly flat front? Just scootch the optical drive forward a bit and you're done.
Depending on how crazy I feel, I may get the SG05 front panel duplicated in brushed aluminium lol
In this review I found GTX560 winning the race in most of the benchmarks against HD 6950 but on other reviewing sites i find HD 6950 to be equally comparable with GTX560. I dont know the reason why ...
and secondly in this review HD6950 used was of 2GB version while there is a cheaper 1 GB version also available in the market.
Resolutions used in the tests were favorable to 1GB framebuffer. 2 GB is goin to benefit if u are playing at higher resolutions or at tripple monitor setup ... so my point is when talkin abt pricing why didnt the cheaper version mentione ...