| ATI Radeon HD 5830 DirectX-11 Video Card |
| Reviews - Featured Reviews: Video Cards | ||||||||||||||||||||||||||||||||||||||||||||||||||||||||||||||||||||||||||||||||||||||||||||||||||||||||||||||||||||||||||||||||||||||||||||||||||||||||||||||||||||||||||||||||||||||||||||||||||||||||||||||||||||||||||||||||||||||||||||||||||||||||||||||||||||||||||||||||||||||||||||||||||||||||||||||||||||||||||||||||||||||||||||||||||||||||||||||||||||||||||||||||||||||||||||||||||||||||||||||||||||||||||||||||||||||||||||||||||||||||||||||||||||||||||||||||||||||||||||||||||||||||||||||||||||||||||||||||||||||||||||||||||||||||||||||||||||||||||||||||||||||||||||||||||||||||||||||||||||||||||||||||||||||||||||||||||||||||||||||||||||||||||||||||||||||||||||||||||||||||||||||||||||||||||||||||||||||||||||||||||||||||||||||
| Written by Bruce Normann | ||||||||||||||||||||||||||||||||||||||||||||||||||||||||||||||||||||||||||||||||||||||||||||||||||||||||||||||||||||||||||||||||||||||||||||||||||||||||||||||||||||||||||||||||||||||||||||||||||||||||||||||||||||||||||||||||||||||||||||||||||||||||||||||||||||||||||||||||||||||||||||||||||||||||||||||||||||||||||||||||||||||||||||||||||||||||||||||||||||||||||||||||||||||||||||||||||||||||||||||||||||||||||||||||||||||||||||||||||||||||||||||||||||||||||||||||||||||||||||||||||||||||||||||||||||||||||||||||||||||||||||||||||||||||||||||||||||||||||||||||||||||||||||||||||||||||||||||||||||||||||||||||||||||||||||||||||||||||||||||||||||||||||||||||||||||||||||||||||||||||||||||||||||||||||||||||||||||||||||||||||||||||||||||
| Thursday, 25 February 2010 | ||||||||||||||||||||||||||||||||||||||||||||||||||||||||||||||||||||||||||||||||||||||||||||||||||||||||||||||||||||||||||||||||||||||||||||||||||||||||||||||||||||||||||||||||||||||||||||||||||||||||||||||||||||||||||||||||||||||||||||||||||||||||||||||||||||||||||||||||||||||||||||||||||||||||||||||||||||||||||||||||||||||||||||||||||||||||||||||||||||||||||||||||||||||||||||||||||||||||||||||||||||||||||||||||||||||||||||||||||||||||||||||||||||||||||||||||||||||||||||||||||||||||||||||||||||||||||||||||||||||||||||||||||||||||||||||||||||||||||||||||||||||||||||||||||||||||||||||||||||||||||||||||||||||||||||||||||||||||||||||||||||||||||||||||||||||||||||||||||||||||||||||||||||||||||||||||||||||||||||||||||||||||||||||
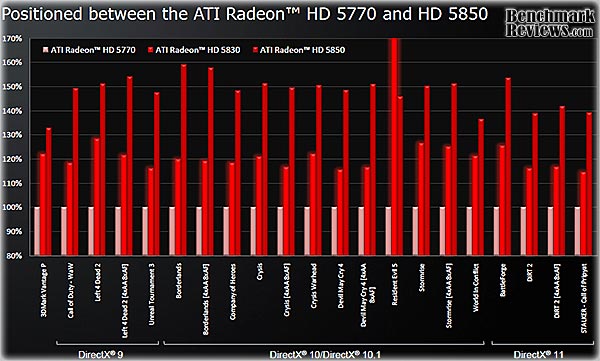
ATI Radeon HD 5830 Video Card ReviewEver since the introduction of the ATI Radeon HD5770, PC gamers and enthusiasts have been looking at the wide gap between the HD5770 and the HD5850 and knew that it would only be a matter of time before ATI plugged the hole in their product line. ATI is taking a slightly different approach with the Radeon HD5830 video card; selling only the ASIC chips to their Add-In-Board (AIB) partners. In this article Benchmark Reviews is going to demonstrate a prototype ATI Radeon HD 5830 video card, and our benchmark tests are going to put an end to the rumors about the specifications and graphical performance of this highly anticipated GPU.
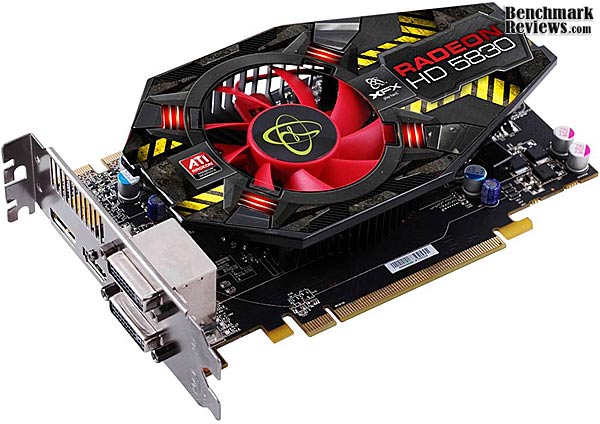
The Radeon HD 5830 is not a 'reference card' as we know it, because that concept is not being used this time around. We have to wait for the AIB partners to start shipping their own board designs to see what will actually be available in the marketplace. No more slapping a label on a complete card that you buy from ATI's captive supplier... For now though, we have a quick and easy way to assess the performance of the ATI Radeon HD5830 chip, lovingly wrapped in an HD5870 package. Yes, a 5870 package; I'll explain later why this is necessary. Please follow along as we give you a sneak preview of things to come from some of ATI's AIB Partners. About the company: ATI
|
||||||||||||||||||||||||||||||||||||||||||||||||||||||||||||||||||||||||||||||||||||||||||||||||||||||||||||||||||||||||||||||||||||||||||||||||||||||||||||||||||||||||||||||||||||||||||||||||||||||||||||||||||||||||||||||||||||||||||||||||||||||||||||||||||||||||||||||||||||||||||||||||||||||||||||||||||||||||||||||||||||||||||||||||||||||||||||||||||||||||||||||||||||||||||||||||||||||||||||||||||||||||||||||||||||||||||||||||||||||||||||||||||||||||||||||||||||||||||||||||||||||||||||||||||||||||||||||||||||||||||||||||||||||||||||||||||||||||||||||||||||||||||||||||||||||||||||||||||||||||||||||||||||||||||||||||||||||||||||||||||||||||||||||||||||||||||||||||||||||||||||||||||||||||||||||||||||||||||||||||||||||||||||||


| Product Series |
Stream Processors |
Core Clock (MHz) |
Shader Clock (MHz) |
Memory Clock (MHz) |
Memory Amount |
Memory Interface |
| MSI Radeon HD4830 (R4830 T2D512) |
640 |
585 |
N/A |
900 |
512MB GDDR3 |
256-bit |
| XFX Radeon HD5750 (HD-575X-ZNFC) |
720 |
700 |
N/A |
1150 |
1.0GB GDDR5 |
128-bit |
| ASUS Radeon HD4850 (EAH4850 TOP) |
800 |
680 |
N/A |
1050 |
512MB GDDR3 |
256-bit |
| ATI Radeon HD5770 (Engineering Sample) |
800 |
850 |
N/A |
1200 |
1.0GB GDDR5 |
128-bit |
| ATI Radeon HD5830 (Engineering Sample) |
1120 |
800 |
N/A |
1000 |
1.0GB GDDR5 |
256-bit |
| ASUS GeForce GTX 260 (ENGTX260 MATRIX) |
216 |
576 |
1242 |
999 |
896MB GDDR3 |
448-bit |
| XFX Radeon HD5850 (21162-00-50R) |
1440 |
725 |
N/A |
1000 |
1.0GB GDDR5 |
256-bit |
| MSI GeForce GTX 275 (N275GTX Twin Frozr OC) |
240 |
666 |
1476 |
1161 |
896MB GDDR3 |
448-bit |
| ASUS GeForce GTX 285 (GTX285 MATRIX) |
240 |
662 |
1476 |
1242 |
1.0GB GDDR3 |
512-bit |
| ATI Radeon HD5870 (Engineering Sample) |
1600 |
850 |
N/A |
1200 |
1.0GB GDDR5 |
256-bit |
-
MSI Radeon HD4830 (R4830 T2D512 - Catalyst 8.703.0.0)
-
ASUS Radeon HD4850 (EAH4850 TOP - Catalyst 8.703.0.0)
-
XFX Radeon HD5750 (HD-575X-ZN - Catalyst 8.703.0.0)
-
ATI Radeon HD5770 (Engineering Sample - Catalyst 8.703.0.0)
-
ATI Radeon HD5830 (Engineering Sample - Catalyst 8.703.0.0)
-
XFX Radeon HD5850 (21162-00-50R - ATI Catalyst 8.703.0.0)
-
ASUS GeForce GTX 260 (ENGTX260 MATRIX - Forceware v195.62)
-
MSI GeForce GTX 275 (N275GTX Twin Frozr OC - Forceware v195.62)
-
ASUS GeForce GTX 285 (GTX285 MATRIX - Forceware v195.62)
-
ATI Radeon HD5870 (Reference Design -Catalyst 8.703.0.0)
3DMark Vantage Benchmark Results
3DMark Vantage is a computer benchmark by Futuremark (formerly named Mad Onion) to determine the DirectX 10 performance of 3D game performance with graphics cards. A 3DMark score is an overall measure of your system's 3D gaming capabilities, based on comprehensive real-time 3D graphics and processor tests. By comparing your score with those submitted by millions of other gamers you can see how your gaming rig performs, making it easier to choose the most effective upgrades or finding other ways to optimize your system.
There are two graphics tests in 3DMark Vantage: Jane Nash (Graphics Test 1) and New Calico (Graphics Test 2). The Jane Nash test scene represents a large indoor game scene with complex character rigs, physical GPU simulations, multiple dynamic lights, and complex surface lighting models. It uses several hierarchical rendering steps, including for water reflection and refraction, and physics simulation collision map rendering. The New Calico test scene represents a vast space scene with lots of moving but rigid objects and special content like a huge planet and a dense asteroid belt.
At Benchmark Reviews, we believe that synthetic benchmark tools are just as valuable as video games, but only so long as you're comparing apples to apples. Since the same test is applied in the same controlled method with each test run, 3DMark is a reliable tool for comparing graphic cards against one-another.
1680x1050 is rapidly becoming the new 1280x1024. More and more widescreen are being sold with new systems or as upgrades to existing ones. Even in tough economic times, the tide cannot be turned back; screen resolution and size will continue to creep up. Using this resolution as a starting point, the maximum settings were applied to 3DMark Vantage include 8x Anti-Aliasing, 16x Anisotropic Filtering, all quality levels at Extreme, and Post Processing Scale at 1:2.

Well, our first test looks promising! At 1680x1050 the Radeon HD5830 slots in nicely between the HD5770 and HD5850. If anything, it leans towards the 5850 in this synthetic test. Also, notice that it just edges out a mildly overclocked GTX285. We'll have to keep an eye on that comparison as we move through our testing regimen. Wouldn't it be funny if that was the target performance level all along?

At 1920x1200 resolution, things look much the same as they did at the lower screen size. The low end cards, with their limited 512MB of GDDR3 struggle to keep up, but everything else is the same. Let's take a look at test#2, which has a lot more surfaces to render, with all those asteroids flying around New Calico.

In the New Calico test, the HD5830 sits right in the center of the sweet spot between its siblings, the HD5770 and HD5850. So far, any concerns about the 50% reduction in ROPs seem unwarranted. The 5830 is keeping up with its big brother just fine.

At a higher screen resolution of 1920x1200, we again see the 512MB cards falling behind, but the HD5830 retains its spot halfway between the 5770 and 5850. It also barely tops the GTX285 again, so any complaints about the pricing on the HD5830 need to consider the competition. We need to look at some actual gaming performance to verify these results, so let's take a look in the next section, at how these cards stack up in the standard bearer for gaming benchmarks, Crysis.
| Product Series |
Stream Processors |
Core Clock (MHz) |
Shader Clock (MHz) |
Memory Clock (MHz) |
Memory Amount |
Memory Interface |
| MSI Radeon HD4830 (R4830 T2D512) |
640 |
585 |
N/A |
900 |
512MB GDDR3 |
256-bit |
| XFX Radeon HD5750 (HD-575X-ZNFC) |
720 |
700 |
N/A |
1150 |
1.0GB GDDR5 |
128-bit |
| ASUS Radeon HD4850 (EAH4850 TOP) |
800 |
680 |
N/A |
1050 |
512MB GDDR3 |
256-bit |
| ATI Radeon HD5770 (Engineering Sample) |
800 |
850 |
N/A |
1200 |
1.0GB GDDR5 |
128-bit |
| ATI Radeon HD5830 (Engineering Sample) |
1120 |
800 |
N/A |
1000 |
1.0GB GDDR5 |
256-bit |
| ASUS GeForce GTX 260 (ENGTX260 MATRIX) |
216 |
576 |
1242 |
999 |
896MB GDDR3 |
448-bit |
| XFX Radeon HD5850 (21162-00-50R) |
1440 |
725 |
N/A |
1000 |
1.0GB GDDR5 |
256-bit |
| MSI GeForce GTX 275 (N275GTX Twin Frozr OC) |
240 |
666 |
1476 |
1161 |
896MB GDDR3 |
448-bit |
| ASUS GeForce GTX 285 (GTX285 MATRIX) |
240 |
662 |
1476 |
1242 |
1.0GB GDDR3 |
512-bit |
| ATI Radeon HD5870 (Engineering Sample) |
1600 |
850 |
N/A |
1200 |
1.0GB GDDR5 |
256-bit |
Crysis Benchmark Results
Crysis uses a new graphics engine: the CryENGINE2, which is the successor to Far Cry's CryENGINE. CryENGINE2 is among the first engines to use the Direct3D 10 (DirectX 10) framework, but can also run using DirectX 9, on Vista, Windows XP and the new Windows 7. As we'll see, there are significant frame rate reductions when running Crysis in DX10. It's not an operating system issue, DX9 works fine in WIN7, but DX10 knocks the frame rates in half.
Roy Taylor, Vice President of Content Relations at NVIDIA, has spoken on the subject of the engine's complexity, stating that Crysis has over a million lines of code, 1GB of texture data, and 85,000 shaders. To get the most out of modern multicore processor architectures, CPU intensive subsystems of CryENGINE 2 such as physics, networking and sound, have been re-written to support multi-threading.
Crysis offers an in-game benchmark tool, which is similar to World in Conflict. This short test does place some high amounts of stress on a graphics card, since there are so many landscape features rendered. For benchmarking purposes, Crysis can mean trouble as it places a high demand on both GPU and CPU resources. Benchmark Reviews uses the Crysis Benchmark Tool by Mad Boris to test frame rates in batches, which allows the results of many tests to be averaged.
Low-resolution testing allows the graphics processor to plateau its maximum output performance, and shifts demand onto the other system components. At the lower resolutions Crysis will reflect the GPU's top-end speed in the composite score, indicating full-throttle performance with little load. This makes for a less GPU-dependant test environment, but it is sometimes helpful in creating a baseline for measuring maximum output performance. At the 1280x1024 resolution used by 17" and 19" monitors, the CPU and memory have too much influence on the results to be used in a video card test. At the widescreen resolutions of 1680x1050 and 1900x1200, the performance differences between video cards under test are mostly down to the cards.

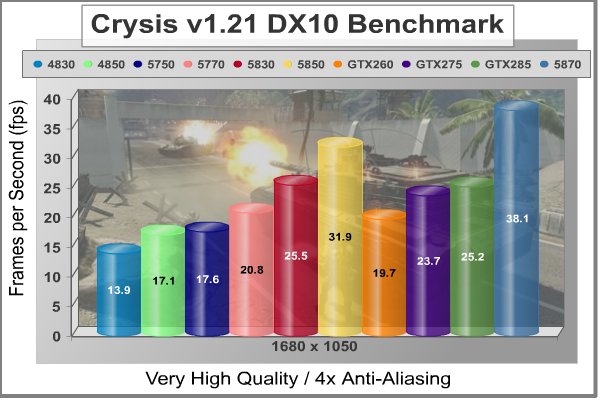
With medium screen resolution and no AA dialed in, the HD5830 continues to have a field day. Please remember all the test results in this article are with maximum allowable image quality settings. Also, it's good to remember how all the performance numbers in Crysis took a major hit when Benchmark Reviews switched over to the DirectX 10 API for all our testing. Considering all that, 31 FPS is a great result, especially as it beats the GTX285 again. One frame/second isn't much of a difference in performance, but there is that $100 price difference between the two to consider.

At 1900 x 1200 resolution, everything looks the same; even the 512MB cards are still hanging in there. Those old HD48xx series cards were really good performers in Crysis, but they are giving up 8-12 FPS to the new ATI HDx8xx budget king.
Now let's turn up the heat a bit, and add some Anti-Aliasing. With 4x AA cranked in, the HD5830 backs off ever so slightly, making up 42% of the performance difference between the HD5770 and HD5830. It's not 50% or above, but is still a respectable result, and of course it squeaks by the GTX285 again.

This is one of our toughest tests, at 1900 x 1200, maximum quality levels, and 4x AA. Only one card gets above 30 FPS in this test, and it's the fastest single-GPU card on the planet, the Radeon HD5870. In the middle ranges, the HD5830 holds on to its spot, roughly half way between the HD5770 and HD5850. What I like about this test is that it shows how far ATI has come in one generation of video cards. The HD4830, which was the equivalent card in the HD48xx line up, only manages about 9 FPS, and the current generation card puts up 21. I see real progress here, and I just don't get it when people want to compare every card in the HD5xxx series to the HD4890.
| Product Series |
Stream Processors |
Core Clock (MHz) |
Shader Clock (MHz) |
Memory Clock (MHz) |
Memory Amount |
Memory Interface |
| MSI Radeon HD4830 (R4830 T2D512) |
640 |
585 |
N/A |
900 |
512MB GDDR3 |
256-bit |
| XFX Radeon HD5750 (HD-575X-ZNFC) |
720 |
700 |
N/A |
1150 |
1.0GB GDDR5 |
128-bit |
| ASUS Radeon HD4850 (EAH4850 TOP) |
800 |
680 |
N/A |
1050 |
512MB GDDR3 |
256-bit |
| ATI Radeon HD5770 (Engineering Sample) |
800 |
850 |
N/A |
1200 |
1.0GB GDDR5 |
128-bit |
| ATI Radeon HD5830 (Engineering Sample) |
1120 |
800 |
N/A |
1000 |
1.0GB GDDR5 |
256-bit |
| ASUS GeForce GTX 260 (ENGTX260 MATRIX) |
216 |
576 |
1242 |
999 |
896MB GDDR3 |
448-bit |
| XFX Radeon HD5850 (21162-00-50R) |
1440 |
725 |
N/A |
1000 |
1.0GB GDDR5 |
256-bit |
| MSI GeForce GTX 275 (N275GTX Twin Frozr OC) |
240 |
666 |
1476 |
1161 |
896MB GDDR3 |
448-bit |
| ASUS GeForce GTX 285 (GTX285 MATRIX) |
240 |
662 |
1476 |
1242 |
1.0GB GDDR3 |
512-bit |
| ATI Radeon HD5870 (Engineering Sample) |
1600 |
850 |
N/A |
1200 |
1.0GB GDDR5 |
256-bit |
In our next section, Benchmark Reviews tests with Devil May Cry 4 Benchmark. Read on to see how a blended high-demand GPU test with low video frame buffer demand will impact our test products.
Devil May Cry 4 Benchmark
Devil May Cry 4 was released for the PC platform in early 2007 as the fourth installment to the Devil May Cry video game series. DMC4 is a direct port from the PC platform to console versions, which operate at the native 720P game resolution with no other platform restrictions. Devil May Cry 4 uses the refined MT Framework game engine, which has been used for many popular Capcom game titles over the past several years.
MT Framework is an exclusive seventh generation game engine built to be used with games developed for the PlayStation 3 and Xbox 360, and PC ports. MT stands for "Multi-Thread", "Meta Tools" and "Multi-Target". Originally meant to be an outside engine, but none matched their specific requirements in performance and flexibility. Games using the MT Framework are originally developed on the PC and then ported to the other two console platforms.
On the PC version a special bonus called Turbo Mode is featured, giving the game a slightly faster speed, and a new difficulty called Legendary Dark Knight Mode is implemented. The PC version also has both DirectX 9 and DirectX 10 mode for Windows XP, Vista, and Widows 7 operating systems.
It's always nice to be able to compare the results we receive here at Benchmark Reviews with the results you test for on your own computer system. Usually this isn't possible, since settings and configurations make it nearly difficult to match one system to the next; plus you have to own the game or benchmark tool we used.
Devil May Cry 4 fixes this, and offers a free benchmark tool available for download. Because the DMC4 MT Framework game engine is rather low-demand for today's cutting edge video cards, Benchmark Reviews uses the 1920x1200 resolution to test with 8x AA (highest AA setting available to Radeon HD video cards) and 16x AF.
Devil May Cry 4 is not as demanding a benchmark as it used to be. Only scene #2 and #4 are worth looking at from the standpoint of trying to separate the fastest video cards from the slower ones. Still, it represents a typical environment for many games that our readers still play on a regular basis, so it's good to see what works with it and what doesn't. Any of the tested cards will do a credible job in this application, and the performance scales in a pretty linear fashion. You get what you pay for when running this game, at least for benchmarks. This is one time where you can generally use the maximum available anti-aliasing settings, so NVIDIA users should feel free to crank it up to 16X. The DX10 "penalty" is of no consequence here.

This looks like one benchmark where the reduction in number of ROPs makes a difference. The HD5830 only beats the HD5770 by 9%, and the GTX200 cards get to strut their stuff.

In Scene #4, the HD5850 doesn't turn in quite the stunning performance it did in Scene #3, so the gap between it and the HD5770 isn't as large. Regardless, the HD5830 sticks closer to the HD5770 than it does to its big brother in this test, only filling 32% of the performance gap this time.
| Product Series |
Stream Processors |
Core Clock (MHz) |
Shader Clock (MHz) |
Memory Clock (MHz) |
Memory Amount |
Memory Interface |
| MSI Radeon HD4830 (R4830 T2D512) |
640 |
585 |
N/A |
900 |
512MB GDDR3 |
256-bit |
| XFX Radeon HD5750 (HD-575X-ZNFC) |
720 |
700 |
N/A |
1150 |
1.0GB GDDR5 |
128-bit |
| ASUS Radeon HD4850 (EAH4850 TOP) |
800 |
680 |
N/A |
1050 |
512MB GDDR3 |
256-bit |
| ATI Radeon HD5770 (Engineering Sample) |
800 |
850 |
N/A |
1200 |
1.0GB GDDR5 |
128-bit |
| ATI Radeon HD5830 (Engineering Sample) |
1120 |
800 |
N/A |
1000 |
1.0GB GDDR5 |
256-bit |
| ASUS GeForce GTX 260 (ENGTX260 MATRIX) |
216 |
576 |
1242 |
999 |
896MB GDDR3 |
448-bit |
| XFX Radeon HD5850 (21162-00-50R) |
1440 |
725 |
N/A |
1000 |
1.0GB GDDR5 |
256-bit |
| MSI GeForce GTX 275 (N275GTX Twin Frozr OC) |
240 |
666 |
1476 |
1161 |
896MB GDDR3 |
448-bit |
| ASUS GeForce GTX 285 (GTX285 MATRIX) |
240 |
662 |
1476 |
1242 |
1.0GB GDDR3 |
512-bit |
| ATI Radeon HD5870 (Engineering Sample) |
1600 |
850 |
N/A |
1200 |
1.0GB GDDR5 |
256-bit |
Our next benchmark of the series is for a very popular FPS game that rivals Crysis for world-class graphics in a far away land.
Far Cry 2 Benchmark Results
Ubisoft has developed Far Cry 2 as a sequel to the original, but with a very different approach to game play and story line. Far Cry 2 features a vast world built on Ubisoft's new game engine called Dunia, meaning "world", "earth" or "living" in Farci. The setting in Far Cry 2 takes place on a fictional Central African landscape, set to a modern day timeline.
The Dunia engine was built specifically for Far Cry 2, by Ubisoft Montreal development team. It delivers realistic semi-destructible environments, special effects such as dynamic fire propagation and storms, real-time night-and-day sun light and moon light cycles, dynamic music system, and non-scripted enemy A.I actions.
The Dunia game engine takes advantage of multi-core processors as well as multiple processors and supports DirectX 9 as well as DirectX 10. Only 2 or 3 percent of the original CryEngine code is re-used, according to Michiel Verheijdt, Senior Product Manager for Ubisoft Netherlands. Additionally, the engine is less hardware-demanding than CryEngine 2, the engine used in Crysis. However, it should be noted that Crysis delivers greater character and object texture detail, as well as more destructible elements within the environment. For example; trees breaking into many smaller pieces and buildings breaking down to their component panels. Far Cry 2 also supports the amBX technology from Philips. With the proper hardware, this adds effects like vibrations, ambient colored lights, and fans that generate wind effects.
There is a benchmark tool in the PC version of Far Cry 2, which offers an excellent array of settings for performance testing. Benchmark Reviews used the maximum settings allowed for our tests, with the resolution set to 1920x1200. The performance settings were all set to 'Very High', Render Quality was set to 'Ultra High' overall quality level, 8x anti-aliasing was applied, and HDR and Bloom were enabled. Of course DX10 was used exclusively for this series of tests.

It's too early to call it a trend, but after just seeing the HD5830 struggle a bit with the oldest benchmark in our test suite, I see it pretty much falling flat here on one of our newest gaming benchmarks. Once again, the HD5850 really stands out here, and I think you have to point the finger at the fact that the 5850 has twice the number of ROPs as the HD5830.
Although the Dunia engine in Far Cry 2 is slightly less demanding than CryEngine 2 engine in Crysis, the strain appears to be extremely close. In Crysis we didn't dare to test AA above 4x, whereas we use 8x AA and 'Ultra High' settings in Far Cry 2. Using the short 'Ranch Small' time demo (which yields the lowest FPS of the three tests available), many of the midrange products we've tested are capable of producing playable frame rates with the settings all turned up. We also see a different effect when switching our testing to DirectX 10. Far Cry 2 seems to have been optimized, or at least written with a clear understanding of DX10 requirements.

The Radeon HD5830 hangs disappointingly close to its little brother again in the higher resolution testing. Although the Dunia engine seems to be optimized for NVIDIA chips, the mix of GPU components ATI incorporated in the 5850 and 5870 GPUs seem optimum for this game. That's obviously not the case for the HD5830.
| Product Series |
Stream Processors |
Core Clock (MHz) |
Shader Clock (MHz) |
Memory Clock (MHz) |
Memory Amount |
Memory Interface |
| MSI Radeon HD4830 (R4830 T2D512) |
640 |
585 |
N/A |
900 |
512MB GDDR3 |
256-bit |
| XFX Radeon HD5750 (HD-575X-ZNFC) |
720 |
700 |
N/A |
1150 |
1.0GB GDDR5 |
128-bit |
| ASUS Radeon HD4850 (EAH4850 TOP) |
800 |
680 |
N/A |
1050 |
512MB GDDR3 |
256-bit |
| ATI Radeon HD5770 (Engineering Sample) |
800 |
850 |
N/A |
1200 |
1.0GB GDDR5 |
128-bit |
| ATI Radeon HD5830 (Engineering Sample) |
1120 |
800 |
N/A |
1000 |
1.0GB GDDR5 |
256-bit |
| ASUS GeForce GTX 260 (ENGTX260 MATRIX) |
216 |
576 |
1242 |
999 |
896MB GDDR3 |
448-bit |
| XFX Radeon HD5850 (21162-00-50R) |
1440 |
725 |
N/A |
1000 |
1.0GB GDDR5 |
256-bit |
| MSI GeForce GTX 275 (N275GTX Twin Frozr OC) |
240 |
666 |
1476 |
1161 |
896MB GDDR3 |
448-bit |
| ASUS GeForce GTX 285 (GTX285 MATRIX) |
240 |
662 |
1476 |
1242 |
1.0GB GDDR3 |
512-bit |
| ATI Radeon HD5870 (Engineering Sample) |
1600 |
850 |
N/A |
1200 |
1.0GB GDDR5 |
256-bit |
Our next benchmark of the series puts our collection of video cards against some fresh graphics in the newly released Resident Evil 5 benchmark.
Resident Evil 5 Benchmark Results
PC gamers get the ultimate Resident Evil package in this new PC version with exclusive features including NVIDIA's new GeForce 3D Vision technology (wireless 3D Vision glasses sold separately), new costumes and a new mercenary mode with more enemies on screen. Delivering an infinite level of detail, realism and control, Resident Evil 5 is certain to bring new fans to the series. Incredible changes to game play and the world of Resident Evil make it a must-have game for gamers across the globe.
Years after surviving the events in Raccoon City, Chris Redfield has been fighting the scourge of bio-organic weapons all over the world. Now a member of the Bio-terrorism Security Assessment Alliance (BSSA), Chris is sent to Africa to investigate a biological agent that is transforming the populace into aggressive and disturbing creatures. New cooperatively-focused game play revolutionizes the way that Resident Evil is played. Chris and Sheva must work together to survive new challenges and fight dangerous hordes of enemies.
From a gaming performance perspective, Resident Evil 5 uses Next Generation of Fear - Ground breaking graphics that utilize an advanced version of Capcom's proprietary game engine, MT Framework, which powered the hit titles Devil May Cry 4, Lost Planet and Dead Rising. The game uses a wider variety of lighting to enhance the challenge. Fear Light as much as Shadow - Lighting effects provide a new level of suspense as players attempt to survive in both harsh sunlight and extreme darkness. As usual, we maxed out the graphics settings on the benchmark version of this popular game, to put the hardware through its paces. Much like Devil May Cry 4, it's relatively easy to get good frame rates in this game, so take the opportunity to turn up all the knobs and maximize the visual experience.

The Resident Evil5 benchmark tool provides a graph of continuous frame rates and averages for each of four distinct scenes which take place in different areas of the compound. In addition it calculates an overall average for the four scenes. The averages for scene #3 and #4 are what we report here, as they are the most challenging. Looking at area #3, two things are obvious; the NVIDIA cards do exceptionally well in this game, and the HD5830 doesn't come anywhere near the performance of the HD5850. There is quite a bit of variation in the gameplay between the four areas, so let's see what happens in the next most challenging scene, area #4.

Once again, in this test the HD5850 really stands out in the ATI lineup, and the HD5830 hangs back with the likes of the 57xx series. Let's keep looking, especially at some new titles that were developed for DX11, and see if this trend continues.
| Product Series |
Stream Processors |
Core Clock (MHz) |
Shader Clock (MHz) |
Memory Clock (MHz) |
Memory Amount |
Memory Interface |
| MSI Radeon HD4830 (R4830 T2D512) |
640 |
585 |
N/A |
900 |
512MB GDDR3 |
256-bit |
| XFX Radeon HD5750 (HD-575X-ZNFC) |
720 |
700 |
N/A |
1150 |
1.0GB GDDR5 |
128-bit |
| ASUS Radeon HD4850 (EAH4850 TOP) |
800 |
680 |
N/A |
1050 |
512MB GDDR3 |
256-bit |
| ATI Radeon HD5770 (Engineering Sample) |
800 |
850 |
N/A |
1200 |
1.0GB GDDR5 |
128-bit |
| ATI Radeon HD5830 (Engineering Sample) |
1120 |
800 |
N/A |
1000 |
1.0GB GDDR5 |
256-bit |
| ASUS GeForce GTX 260 (ENGTX260 MATRIX) |
216 |
576 |
1242 |
999 |
896MB GDDR3 |
448-bit |
| XFX Radeon HD5850 (21162-00-50R) |
1440 |
725 |
N/A |
1000 |
1.0GB GDDR5 |
256-bit |
| MSI GeForce GTX 275 (N275GTX Twin Frozr OC) |
240 |
666 |
1476 |
1161 |
896MB GDDR3 |
448-bit |
| ASUS GeForce GTX 285 (GTX285 MATRIX) |
240 |
662 |
1476 |
1242 |
1.0GB GDDR3 |
512-bit |
| ATI Radeon HD5870 (Engineering Sample) |
1600 |
850 |
N/A |
1200 |
1.0GB GDDR5 |
256-bit |
In our next section, we look at the newest DX11 benchmark, straight from Russia and the studios of Unigine. Their latest benchmark is called "Heaven", and it has some very interesting and non-typical graphics. So, let's take a peek at what Heaven v1.0 looks like.
Unigine - Heaven Benchmark Results
Unigine Corp. released the first DirectX 11 benchmark "Heaven" that is based on its proprietary UnigineTM engine. The company has already made a name among the overclockers and gaming enthusiasts for uncovering the realm of true GPU capabilities with previously released "Sanctuary" and "Tropics" demos. Their benchmarking capabilities are coupled with striking visual integrity of the refined graphic art.
The "Heaven" benchmark excels at providing the following key features:
-
Native support of OpenGL, DirectX 9, DirectX 10 and DirectX 11
-
Comprehensive use of tessellation technology
-
Advanced SSAO (screen-space ambient occlusion)
-
Volumetric cumulonimbus clouds generated by a physically accurate algorithm
-
Dynamic simulation of changing environment with high physical fidelity
-
Interactive experience with fly/walk-through modes
-
ATI EyeFinity support
The distinguishing feature of the benchmark is a hardware tessellation that is a scalable technology aimed for automatic subdivision of polygons into smaller and finer pieces, so that developers can gain a more detailed look of their games almost free of charge in terms of performance. Thanks to this procedure, the elaboration of the rendered image finally approaches the boundary of veridical visual perception: the virtual reality transcends conjured by your hand.
Unigine Corp. is an international company focused on top-notch real-time 3D solutions. The development studio is located in Tomsk, Russia. Main activity of Unigine Corp. is development of UnigineTM, a cross-platform engine for virtual 3D worlds. Since the project start in 2004, it attracts attention of different companies and groups of independent developers, because Unigine is always on the cutting edge of real-time 3D visualization and physics simulation technologies.

Getting back to a more synthetic type of benchmark, we see the HD5830 doing a little better than it did with Far Cry 2 and Resident Evil 5. The HD5850 still puts on a star performance and stands out from the crowd, but at least the HD5830 distinguishes itself from the HD5770. This test was run with 4x anti-aliasing, let's see how the cards stack up when we increase this to the maximum level of 8x.

The impact of increasing the anti-aliasing is pretty clear. Two things happened; the older HD48xx cards took a nosedive, and so did the NVIDIA GT200 cards. While the HD5830 still can't catch up to the HD5850, it manages to just get by the GTX285. One thing I noticed while observing the benchmark wind its way through the streets of Heaven 1.0; when smoke from the chimneys was in the scene, the frame rate dropped radically. It really hurt the older cards; I'm not sure if it was just their memory deficit, or what caused this effect.
| Product Series |
Stream Processors |
Core Clock (MHz) |
Shader Clock (MHz) |
Memory Clock (MHz) |
Memory Amount |
Memory Interface |
| MSI Radeon HD4830 (R4830 T2D512) |
640 |
585 |
N/A |
900 |
512MB GDDR3 |
256-bit |
| XFX Radeon HD5750 (HD-575X-ZNFC) |
720 |
700 |
N/A |
1150 |
1.0GB GDDR5 |
128-bit |
| ASUS Radeon HD4850 (EAH4850 TOP) |
800 |
680 |
N/A |
1050 |
512MB GDDR3 |
256-bit |
| ATI Radeon HD5770 (Engineering Sample) |
800 |
850 |
N/A |
1200 |
1.0GB GDDR5 |
128-bit |
| ATI Radeon HD5830 (Engineering Sample) |
1120 |
800 |
N/A |
1000 |
1.0GB GDDR5 |
256-bit |
| ASUS GeForce GTX 260 (ENGTX260 MATRIX) |
216 |
576 |
1242 |
999 |
896MB GDDR3 |
448-bit |
| XFX Radeon HD5850 (21162-00-50R) |
1440 |
725 |
N/A |
1000 |
1.0GB GDDR5 |
256-bit |
| MSI GeForce GTX 275 (N275GTX Twin Frozr OC) |
240 |
666 |
1476 |
1161 |
896MB GDDR3 |
448-bit |
| ASUS GeForce GTX 285 (GTX285 MATRIX) |
240 |
662 |
1476 |
1242 |
1.0GB GDDR3 |
512-bit |
| ATI Radeon HD5870 (Engineering Sample) |
1600 |
850 |
N/A |
1200 |
1.0GB GDDR5 |
256-bit |
Let's take a look at one more benchmark, a decidedly less cheerful scenario in a post-apocalyptic "Zone", which is traversed by mercenary guides called Stalkers.
S.T.A.L.K.E.R.: Call of Pripyat Benchmark Results
The events of S.T.A.L.K.E.R.: Call of Pripyat unfolds shortly after the end of S.T.A.L.K.E.R.: Shadow of Chernobyl. Having discovered about the open path to the Zone center, the government decides to hold a large-scale military "Fairway" operation aimed to take the CNPP under control. According to the operation's plan, the first military group is to conduct an air scouting of the territory to map out the detailed layouts of anomalous fields location. Thereafter, making use of the maps, the main military forces are to be dispatched. Despite thorough preparations, the operation fails. Most of the avant-garde helicopters crash. In order to collect information on reasons behind the operation failure, Ukraine's Security Service sends their agent into the Zone center.
S.T.A.L.K.E.R.: CoP is developed on X-Ray game engine v.1.6, and implements several ambient occlusion (AO) techniques including one that AMD has developed. AMD's AO technique is optimized to run on efficiently on Direct3D11 hardware. It has been chosen by a number of games (e.g. BattleForge, HAWX, or the new Aliens vs. Predator) for the distinct effect in it adds to the final rendered images. This AO technique is called HDAO which stands for ‘High Definition Ambient Occlusion' because it picks up occlusions from fine details in normal maps.

Within the limits imposed by the NVIDIA cards that don't support DirectX 11, we turn the settings on S.T.A.L.K.E.R.: Call of Pripyat all the way up. The one thing we look at individually is SSAO, one of the technologies that made its appearance in DirectX 10. In the first test, with SSAO turned off, we see a familiar pattern in the comparison between the HD5770, HD5830, and HD5850. Specifically, the HD5830 has very only a 10% performance advantage over the HD5770 and the HD580 rises up, above all expectations. No wonder people love that card, and this testing was all done at stock clock rates, which are pretty low for the 5850, as it leaves the factory.

Once we turn SSAO on and set it to High, the HD5830 gains some of its performance advantage back, over the HD5770. The other thing that happens is that the NVIDIA cards lose out big time. Despite the company's insistence that DX11 is largely unnecessary, their performance on one of the key enabling technologies of DX10 is less than compelling. This is one rendering technique that just pins the NVIDIA GPUs to the ground. How often do you see an HD4850 coming within 10% of a GTX285 and matching a GTX275?
| Product Series |
Stream Processors |
Core Clock (MHz) |
Shader Clock (MHz) |
Memory Clock (MHz) |
Memory Amount |
Memory Interface |
| MSI Radeon HD4830 (R4830 T2D512) |
640 |
585 |
N/A |
900 |
512MB GDDR3 |
256-bit |
| XFX Radeon HD5750 (HD-575X-ZNFC) |
720 |
700 |
N/A |
1150 |
1.0GB GDDR5 |
128-bit |
| ASUS Radeon HD4850 (EAH4850 TOP) |
800 |
680 |
N/A |
1050 |
512MB GDDR3 |
256-bit |
| ATI Radeon HD5770 (Engineering Sample) |
800 |
850 |
N/A |
1200 |
1.0GB GDDR5 |
128-bit |
| ATI Radeon HD5830 (Engineering Sample) |
1120 |
800 |
N/A |
1000 |
1.0GB GDDR5 |
256-bit |
| ASUS GeForce GTX 260 (ENGTX260 MATRIX) |
216 |
576 |
1242 |
999 |
896MB GDDR3 |
448-bit |
| XFX Radeon HD5850 (21162-00-50R) |
1440 |
725 |
N/A |
1000 |
1.0GB GDDR5 |
256-bit |
| MSI GeForce GTX 275 (N275GTX Twin Frozr OC) |
240 |
666 |
1476 |
1161 |
896MB GDDR3 |
448-bit |
| ASUS GeForce GTX 285 (GTX285 MATRIX) |
240 |
662 |
1476 |
1242 |
1.0GB GDDR3 |
512-bit |
| ATI Radeon HD5870 (Engineering Sample) |
1600 |
850 |
N/A |
1200 |
1.0GB GDDR5 |
256-bit |
In our next section, we investigate the thermal performance of the Radeon HD5830, and see if the gimped Cypress GPU die runs cool with the full cooling complement of the HD5870 brought to bear on it.
ATI Radeon HD5830 Temperature
It's hard to know exactly when the first video card got overclocked, and by whom. What we do know is that it's hard to imagine a computer enthusiast or gamer today that doesn't overclock their hardware. Of course, not every video card has the head room. Some products run so hot that they can't suffer any higher temperatures than they generate straight from the factory. This is why we measure the operating temperature of the video card products we test.
To begin testing, I use GPU-Z to measure the temperature at idle as reported by the GPU. Next I use FurMark 1.7.0 to generate maximum thermal load and record GPU temperatures at high-power 3D mode. The ambient room temperature remained stable at 23C throughout testing. The ATI Radeon HD5830 video card recorded 35C in idle 2D mode, and increased to 70C after 20 minutes of stability testing in full 3D mode, at 1920x1200 resolution, and the maximum MSAA setting of 8X. The fan was left on its stock, automatic settings for this test.
70°C is a good result for temperature stress testing, especially with stock fan settings. The built-in fan controller generally runs the fan at 1140 RPM during 2D or idle. On most benchmarks, the temperature never got above 57C and the fan stayed there. Once temps got above 60C, the controller ramped the fan up, to a maximum of 1600 RPM. Of course, retail versions of the card will have a completely different cooling solution, so these results are sort of academic.
FurMark is an OpenGL benchmark that heavily stresses and overheats the graphics card with fur rendering. The benchmark offers several options allowing the user to tweak the rendering: fullscreen / windowed mode, MSAA selection, window size, duration. The benchmark also includes a GPU Burner mode (stability test). FurMark requires an OpenGL 2.0 compliant graphics card with lot of GPU power! As an oZone3D.net partner, Benchmark Reviews offers a free download of FurMark to our visitors.

FurMark does do two things extremely well: drive the thermal output of any graphics processor higher than any other application or video game, and it does so with consistency every time. While FurMark is not a true benchmark tool for comparing different video cards, it still works well to compare one product against itself using different drivers or clock speeds, or testing the stability of a GPU, as it raises the temperatures higher than any program. But in the end, it's a rather limited tool.
In our next section, we discuss electrical power consumption and learn how well (or poorly) each video card will impact your utility bill...
VGA Power Consumption
Life is not as affordable as it used to be, and items such as gasoline, natural gas, and electricity all top the list of resources which have exploded in price over the past few years. Add to this the limit of non-renewable resources compared to current demands, and you can see that the prices are only going to get worse. Planet Earth is needs our help, and needs it badly. With forests becoming barren of vegetation and snow capped poles quickly turning brown, the technology industry has a new attitude towards suddenly becoming "green". I'll spare you the powerful marketing hype that I get from various manufacturers every day, and get right to the point: your computer hasn't been doing much to help save energy... at least up until now.

To measure isolated video card power consumption, Benchmark Reviews uses the Kill-A-Watt EZ (model P4460) power meter made by P3 International. A baseline test is taken without a video card installed inside our computer system, which is allowed to boot into Windows and rest idle at the login screen before power consumption is recorded. Once the baseline reading has been taken, the graphics card is installed and the system is again booted into Windows and left idle at the login screen. Our final loaded power consumption reading is taken with the video card running a stress test using FurMark. Below is a chart with the isolated video card power consumption (not system total) displayed in Watts for each specified test product:
VGA Product Description(sorted by combined total power) |
Idle Power |
Loaded Power |
|---|---|---|
NVIDIA GeForce GTX 480 SLI Set |
82 W |
655 W |
NVIDIA GeForce GTX 590 Reference Design |
53 W |
396 W |
ATI Radeon HD 4870 X2 Reference Design |
100 W |
320 W |
AMD Radeon HD 6990 Reference Design |
46 W |
350 W |
NVIDIA GeForce GTX 295 Reference Design |
74 W |
302 W |
ASUS GeForce GTX 480 Reference Design |
39 W |
315 W |
ATI Radeon HD 5970 Reference Design |
48 W |
299 W |
NVIDIA GeForce GTX 690 Reference Design |
25 W |
321 W |
ATI Radeon HD 4850 CrossFireX Set |
123 W |
210 W |
ATI Radeon HD 4890 Reference Design |
65 W |
268 W |
AMD Radeon HD 7970 Reference Design |
21 W |
311 W |
NVIDIA GeForce GTX 470 Reference Design |
42 W |
278 W |
NVIDIA GeForce GTX 580 Reference Design |
31 W |
246 W |
NVIDIA GeForce GTX 570 Reference Design |
31 W |
241 W |
ATI Radeon HD 5870 Reference Design |
25 W |
240 W |
ATI Radeon HD 6970 Reference Design |
24 W |
233 W |
NVIDIA GeForce GTX 465 Reference Design |
36 W |
219 W |
NVIDIA GeForce GTX 680 Reference Design |
14 W |
243 W |
Sapphire Radeon HD 4850 X2 11139-00-40R |
73 W |
180 W |
NVIDIA GeForce 9800 GX2 Reference Design |
85 W |
186 W |
NVIDIA GeForce GTX 780 Reference Design |
10 W |
275 W |
NVIDIA GeForce GTX 770 Reference Design |
9 W |
256 W |
NVIDIA GeForce GTX 280 Reference Design |
35 W |
225 W |
NVIDIA GeForce GTX 260 (216) Reference Design |
42 W |
203 W |
ATI Radeon HD 4870 Reference Design |
58 W |
166 W |
NVIDIA GeForce GTX 560 Ti Reference Design |
17 W |
199 W |
NVIDIA GeForce GTX 460 Reference Design |
18 W |
167 W |
AMD Radeon HD 6870 Reference Design |
20 W |
162 W |
NVIDIA GeForce GTX 670 Reference Design |
14 W |
167 W |
ATI Radeon HD 5850 Reference Design |
24 W |
157 W |
NVIDIA GeForce GTX 650 Ti BOOST Reference Design |
8 W |
164 W |
AMD Radeon HD 6850 Reference Design |
20 W |
139 W |
NVIDIA GeForce 8800 GT Reference Design |
31 W |
133 W |
ATI Radeon HD 4770 RV740 GDDR5 Reference Design |
37 W |
120 W |
ATI Radeon HD 5770 Reference Design |
16 W |
122 W |
NVIDIA GeForce GTS 450 Reference Design |
22 W |
115 W |
NVIDIA GeForce GTX 650 Ti Reference Design |
12 W |
112 W |
ATI Radeon HD 4670 Reference Design |
9 W |
70 W |
The prototype ATI Radeon HD5830 pulled 26 (156-130) watts at idle and 142 (272-130) watts when running full out, using the test method outlined above. The idle power consumption test is very close to the factory number of 25W, but the load value is well below the 175W factory spec. Perhaps FurMark has been outfoxed this time by ATI? I've heard they took to calling it the "FurMark virus", after receiving too many RMA units that had perished during this test. They also are rumored to have incorporated Safety Measures in the latest firmware to prevent this from happening.
Radeon HD5830 Final Thoughts
Why did ATI leave this huge hole in their product line, for so long? The flagship ATI video cards made a huge splash last September, but according to Mercury Research, cards costing over $200 only make up 7% of the market, and the 57xx series landed in the $100-$200 range, which makes up 27% of the market. That leaves a huge opening in the sub-$100 market, and ATI was busy filling in the gaps with all new, DirectX 11 capable cards in this segment. Enthusiasts may laugh at the diminutive HD55xx series and the HD5450, with its 80 shaders, but they provide a much-needed revenue stream for ATI. Don't begrudge them that, it's what pays for all the R&D that produced the 58xx series in the first place. BTW, did you notice that they released a Mobile Radeon HD5830 a while ago? No, it's not the same chip that we are looking at today; not by a long shot.
So, the halo products were doing fine; in fact they were in short supply for several months due to manufacturing yield problems at the chip foundry in Taiwan. Now, the middle ground and the HTPC markets are taken care of. There are enough chips floating out of TSMC to keep the retailer's shelves stocked. Now what...? Oh, yeah, let's go back and finish off the premier product line with a couple of easy wins. One card can fill the gap between the 58xx and 57xx series, and a dedicated Eyefinity HD5870 card for the AV market will sell like hotcakes at Belgian waffle prices. Because in that market, you're always spending someone else's money.
Let's play a game of "What If". What if you were King of ATI, and you knew that there was a gap in your product line, so you told your minions to go and design something to fill that gap. Lo and behold, some weeks later, the engineers came back with three proposals, because they had been arguing for almost the entire time over how to design the product. It turns out that there are three very easy, very plausible ways to build a product that will meet the performance requirements. Each of them is correct from a technical perspective, so the King has to decide. (You all knew that Marketing is the King, right...LOL)
-
Crank up the 57xx product with selected Juniper GPUs that will run 1 GHz+, and a slightly higher spec memory, easily available from several suppliers.
-
Take another 160 Stream Processors (10%) away from the Cypress GPU (1280 left), and down-clock it to the exact performance target you want. (This was the highly successful strategy for the 5850, BTW.)
-
Take away 320 additional Stream Processors from the Cypress GPU (1120 left), disable some additional Texture Units, and gut the ROPs down to half strength. Take advantage of the high clock rates that are achievable with the latest 40nm chips that you are already paying dearly for, and make up the performance you lost by disabling over 30% of the working parts in each section of the architecture.
Well, the world is waiting for your answer....Kings are infallible you know, so whatever you say will automatically be correct, for all time. It's just that the wrong decision is going to cost you money, somewhere down the road.
Kings have special privileges, so I'm going to invoke mine and answer "1 & 3". I think a turbocharged 57xx is already in the product roadmap, it's just a question of time. I think #2 is what the market wanted, because they had already seen how well the HD5850 scaled with GPU clock speed, and they wanted to be able to overclock the 5830 and get 5850 performance out of it. Just like they saw everyone doing with the 5850, juicing it up to compete with the 5870, they wanted a repeat performance of The People's Champion.
Alas, the King didn't want to lose all those HD5850 sales, at those nice HD5850 prices. I can't blame him; I would have done the same thing. Now, if you'll excuse me, I'm going to go try and get that 5830 chip up to 1.0 GHz, and see what it'll really do.

ATI Radeon HD5830 Conclusion
The performance of the HD5830 GPU is really what this entire review is all about. The design is a derivative of a known entity, or perhaps I should say "entities", since the hard-working chip requires the power supply from the HD5870 in order to perform reliably at its 800 MHz clock rate. ATI had several choices to make when they down-sized the performance of this Cypress chip, and they chose to shed more Stream Processors this time around, rather than reduce the clock rate significantly. ATI hit their overall performance target, but the rub is that enthusiasts won't be able to jack up the clock and reap the kind of performance gains that they were able to get with the HD5850. The overclockers were hoping for the same easy increases this time and I can understand their disappointment, but I don't think there is a legitimate complaint here. Just because you got something for nothing once, doesn't mean you are forever entitled to it, over and over again.
The variance in relative performance between the various benchmarks is a bit troubling. Everyone runs their benchmarks with slightly different settings, and we may have touched on some weak spots. The mix of GPU components, the recipe for the HD5830, if you will, is unique. It's not a linear scaling factor like the HD5850 was, so you have to pay attention to what works in the games you like to play. Crysis certainly worked very well with this card, and for some, that will be enough.

The appearance of retail Radeon HD5830 cards is going to vary quite a bit, based on the in-house design of the Add-In-Board partners. It's clear that this design needs a healthy dose of cooling to perform reliably, so this is an area that each of the partners can highlight and differentiate their offering from the others. Based on some of the images ATI shared with us, there continues to be no shortage of creativity in this area.
The build quality of the Radeon 5830 as a product is a bit hard to assess, as all I had to evaluate was a prototype. The card I got looked exactly like an HD5870 production part; that is to say, well built and impressively constructed. Honestly, at this end of the market it's hard to find products that are poorly crafted. The fully enclosed cooler, full metal back plate, and the general fit and finish are exemplary; now it's up to the AIB partners to match this level of quality at a price decidedly lower than the HD5870 commands.
The features of the HD5830 may seem slightly less amazing, now that we've been exposed to them since last September. Still, no one else has an equivalent combination of features that compete fully with DirectX 11, Full ATI Eyefinity Support, ATI Stream Technology Support, DirectCompute 11 and OpenCL Support, HDMI 1.3 with Dolby True HD and DTS Master Audio. We've barely scratched the surface in this review, focusing almost exclusively on gaming performance, but the card excels at other uses as well.
As of the launch date, February 25th, ATI is aiming at an average retail price of $239 for the HD5830. Since they're not producing the whole cards, and are only providing the ASICs and acting as technical advisors to the AIB partners, ATI predicts a much wider price range than usual for this product. A quick look at Newegg shows the midpoint between the 5770 and 5850 video card prices to be $230. I don't think any of the partners are going to have trouble hitting that target if they want to.
There is a huge price gap between the 5770 and 5850 video cards; currently it's the difference between $160 and $300, using the low end for both cards as a reference. You could drive a truck through that gap, which is why there has been so much speculation on where the performance of the Radeon HD5830 would eventually land. As it turns out, ATI was aiming right at the middle and in some applications they hit it dead on. Unfortunately, in some other applications, the HD5830 performed too close to HD5770 territory. Still, it's a very good thing to be able to buy a card that will keep with a GTX285 in most applications for only $239. I know some will be disappointed with the perceived value, but I've heard too many people say that if it didn't perform close to the 5850 and cost $200 at most, that it would be a total failure. That's a completely unrealistic expectation.
The ATI Radeon HD 5830 is avialable in many speeds and cooling options. The PowerColor PCS+ version offers better cooling and a factory overclock for $240, and as of March 2010 this is the most affordable model. Gigabyte ($250) and Sapphire ($250) also offer reference models at a decent price.
The ATI Radeon HD5830 earns a Silver Tachometer Award, because it fills an important slot in the family tree at a price that most hardcore users can handle, and it gets them into the 58xx series. This is the cheapest double-precision card available from ATI, and as more and more games take advantage of the capabilities in DirectX 11, this will have an enabling effect on real-world gaming performance that the single-precision cards won't be able to match.
Pros:
+ The price might drift down to $200
+ Unmatched feature set
+ Fills the huge performance gap nicely
+ Full 256-bit memory architecture
+ 1.79 TeraFLOPS for < $250 (at launch)
+ HDMI and DisplayPort interfaces included
+ Wide selection of AIB Partner designs to choose from
+ Easy to overclock with ATI Overdrive
+ CrossfireX scalability has been excellent
Cons:
- Only 1120 Stream Processors
- Only 16 ROPs, same as HD5770
- GPU clock almost maxed out
- Requires more power and cooling than HD5850
- Power supply cost may keep card price from falling
Ratings:
-
Performance: 8.25
-
Appearance: 9.00
-
Construction: 9.00
-
Functionality: 9.50
-
Value: 8.25
Final Score: 8.8 out of 10.
Quality Recognition: Benchmark Reviews Silver Tachometer Award.
Questions? Comments? Benchmark Reviews really wants your feedback. We invite you to leave your remarks in our Discussion Forum.
Related Articles:
- Rosewill Wireless-N WiFi Adapter RNX-N180UBE
- Sapphire Radeon HD 4850 Video Card 100242L
- Cooler Master CM 690 NVIDIA Edition Case
- NZXT Adamas Aluminum Mid-Tower ATX Case
- X79 Express Motherboard Performance Comparison
- RHA SA950i Portable Headphones
- Super Talent UltraDrive ME SSD FTM28GX25H
- Best CPU Cooler Performance LGA775 - Q4 2008
- ASUS P5Q3 LGA775 Intel P45 ATX Motherboard
- EVGA GeForce GTX 660 2GB SuperClocked

Comments
---
Oh gawd, the fanboyism from reviewers (excusable to a degree because of card tester givie me one for free review reverso rate pressure) let alone the pock marked apocalypse of the raging reds is almost unbearable.
--
THIS CARD IS COMPETING WITH THE GTX260, AND SINCE IT CANNOT BE OVERCLOCKED WORTH A DING DANG, THE GTX260 BEATS IT PERIOD!
---
Ok, now back to the red ragers fanboy fantasies that crank the red rooster cards a full card tier or two above where they actually are when comparing them to Nvidia. Carry on red raging ravers.
So tell me , whos being a fan boy? , you or the truthfull reviewer
YOU are the insane fanboy fool, not I.
The card competes with the 260 as I said, P E R I O D.
It doesn't compete with the 285, P E R I O D.
Six fps, or six percent, at 60-70 frames per sec, means very little without minimum numbers, and the GTX260 wins in that, especially with the 8x and 16x the reviewer kindly included.
( almost every other review site will only include 0xAA and 4xAA since the ati cards take a HUGE hit compared to the nvidia cards when AA is cranked up - same with Tesselation now).
So, I am still absolutely correct, PERIOD.
I'm sure the blathering, raging red rooster fanboy in you allowed you to only look at one game review, drool into your tinfoil hat cup (after it fell off your gyrating epileptic gourd), and screech "my 9500gt!" - oh man - WHAT A FREAKIN FAN BOY! HAHAHAHAH YER 9500GT ! HAHAHAHAHA
After several complaints of your bahavior, you are banned.
SiliconDoc
silicondoc
67.175.194.49 Atlanta, Georgia, USA
98.214.9.49 Rockford, Illinois, USA