| Patriot Torqx 2 Phison Solid State Drive |
| Reviews - Featured Reviews: Storage | |
| Written by Olin Coles | |
| Tuesday, 17 May 2011 | |
Patriot Torqx 2 SSD PT2128GS25SSDR Review
Manufacturer: Patriot Memory, LLC. Full Disclosure: The product sample used in this article has been provided by Patriot. Phison SSDs aren't as well-known to computer hardware enthusiasts as those controllers from SandForce or Indilinx. For many within the industry, SandForce dominated the 2010 market in much the same way that Indilinx did throughout 2009. But not everyone can afford the premium brand names, or desire the fastest solid state drive technology. Patriot first introduced Phison in their problematic entry-level Patriot PS-100 SSD. Building on the name of their budget Torqx TRB product line that came in 32/64GB capacities, Patriot Memory issues the Torqx 2 series for high-performance power users with capacity up to 256GB. The Patriot Torqx 2 SSD is specified to offer 270 MB/s reads over the SATA 3Gb/s interface, with write speed reaching 230 MB/s. In this article, Benchmark Reviews confirms these results by testing the Patriot Torqx 2 on a B3-stepping Sandy Bridge platform with plenty of bandwidth headroom. PHISON Electronics Corporation produces the PS PS3105-S5 controller used in the Patriot Torqx 2 SSD. This Phison SSD controller supports 20/30/40nm MLC/SLC Large-Block Toggle Hi-Speed NAND flash memory with up to 32 chips, and features a build-in 28/32/48-bit hardware ECC circuit (BCH). Using a 128MB DRAM buffer, the Torqx 2 SSD can offer ONFI 2.0 build-in static and dynamic NAND wear-leveling without compromising capacity for over-provisioning. One interesting footnote is that PHISON specifies this part to enable MLC NAND read and write speeds up to 250/220 MB/s, which are slightly lower than those quoted by Patriot. We'll soon see how well the Torqx 2 holds up in our benchmark SSD tests.
Even after decades of design improvements, the hard disk drive (HDD) is still the slowest component in any personal computer system. Consider that modern desktop processors have a 1 ns response time (nanosecond = one billionth of one second), while system memory responds between 30-90 ns. Traditional hard drive technology utilizes magnetic spinning media, and even the fastest spinning mechanical storage products still exhibit a 9,000,000 ns / 9 ms initial response time (millisecond = one thousandth of one second). In more relevant terms, the processor receives the command and must then wait for system memory to fetch related data from the storage drive. This is why any computer system is only as fast as the slowest component in the data chain; usually the hard drive. In a perfect world all of the components operate at the same speed. Until that day comes, the real-world goal for achieving optimal performance is for system memory to operate as quickly as the central processor and then for the storage drive to operate as fast as memory. With present-day technology this is an impossible task, so enthusiasts try to close the speed gaps between components as much as possible. Although system memory is up to 90x (9000%) slower than most processors, consider then that the hard drive is an added 1000x (100,000%) slower than that same memory. Essentially, these three components are as different in speed as walking is to driving and flying. Solid State Drive technology bridges the largest gap in these response times. The difference a SSD makes to operational response times and program speeds is dramatic, and takes the storage drive from a slow 'walking' speed to a much faster 'driving' speed. Solid State Drive technology improves initial response times by more than 450x (45,000%) for applications and Operating System software, when compared to their mechanical HDD counterparts. The biggest mistake PC hardware enthusiasts make with regard to SSD technology is grading them based on bandwidth speed. File transfer speeds are important, but only so long as the operational IOPS performance can sustain that bandwidth under load. Torqx 2 Specifications:
Bandwidth Speed vs Operational PerformanceAs we've explained in our SSD Benchmark Tests: SATA IDE vs AHCI Mode guide, Solid State Drive performance revolves around two dynamics: bandwidth speed (MB/s) and operational performance (IOPS). These two metrics work together, but one is more important than the other. Consider this analogy: bandwidth determines how much cargo a ship can transport in one voyage, and operational IOPS performance is how fast the ship moves. By understanding this and applying it to SSD storage, there is a clear importance set on each variable depending on the task at hand. For casual users, especially those with laptop or desktop computers that have been upgraded to use an SSD, the naturally quick response time is enough to automatically improve the user experience. Bandwidth speed is important, but only to the extent that operational performance meets the minimum needs of the system. If an SSD has a very high bandwidth speed but a low operational performance, it will take longer to load applications and boot the computer into Windows than if the SSD offered a higher IOPS performance.
Closer Look: Patriot Torqx 2 SSDSSDs are quickly gaining popularity because they work equally well in PC, Linux, or Apple Mac computers. Likewise, they install into both desktop and notebook platforms without modification. For this article Benchmark Reviews is testing the 128GB Patriot Torqx 2 SSD, which is expected to reach speeds of up to 270 MB/s for sequential reads and 230 MB/s sequential writes. The PT2128GS25SSDR model we've received for testing is built using the PHISON PS PS3105-S5 SATA-II SSD controller, and uses a separate 128MB DRAM cache buffer. Patriot Memory offers three difference capacities for their Torqx 2 series solid state drives (32GB: PT232GS25SSDR, 64GB: PT264GS25SSDR, 128GB: PT2128GS25SSDR, 256GB: PT2256GS25SSDR), and they each use identical metal enclosures. Because Patriot markets the Torqx 2 series as an introductory SSD, storage capacity begins at 32GB and reaches up to 256GB. A 512GB version of the Patriot Torqx 2 is not expected.
The Patriot Torqx 2 SSD is best suited for performance-orientated personal computers, but also works extremely well for SOHO computer systems. If required, the 2.5" Patriot Torqx 2 SSD could also be utilized for mission-critical offsite backup media or high-abuse notebook computer systems. Although Patriot Torqx 2 solid state drives lack an integrated USB Mini-B port which appeared on some early-generation SSDs, the current retail market offers several different 2.5" SATA enclosures that utilize the SuperSpeed USB-3.0 standard for high-performance portable file transfers. Patriot understands that once installed, the SSD will be hidden away from view inside a notebook computer or desktop workstation, so they've remained conservative towards the design of their solid state drive appearance. Both halves of the enclosure are given a black textured finish, which avoids showing fingerprints or smudges like a gloss surface would. A colorful branding label is attached to the top of the enclosure, denoting model and capacity.
Standard 2.5" drive bay mounting points are pre-drilled and threaded into the Patriot Torqx 2 SSD chassis, which allows for quick upgrade or addition into any existing notebook and other compact computer system. The mounting positions matched up to the drive bracket on my notebook computer, and after only a few minutes I was booting from a restored Windows 7 System Image without a hitch. Unfortunately, this particular Patriot SSD kit lacks a 3.5-to-2.5" tray adapter, so you'll be left to determine the best way to install this drive into desktop computers. Unlike most Hard Disk Drive (HDD) storage products, SSDs are nearly impervious to impact damage and do not require (or benefit from) any kind of special vibration dampening or shock-proof enclosures Patriot utilizes a standard two-piece metal enclosure for their Torqx 2 series SSDs, which reveals the internal components after removing four small counter-sunk screws located along the sides of this solid state drive. The seam along the sides are covered with 'Warranty Void' labels, which Patriot attaches to warn consumers against taking apart their product. By removing the SSD cover it will also remove your 3-year consumer protection with it, but Benchmark Reviews takes the risk for you and reveals the internal components in our next section.
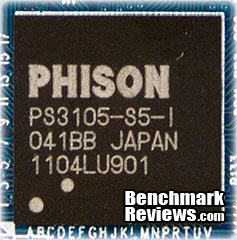
If you're familiar with previous-generation solid state storage products, you'll notice that the enclosure design hasn't changed much beyond the product decal. While its outward appearance is similar to many other solid state drives on the market, functionality and value packaged inside are considerably more unique. Now that you're acquainted with the basic exterior features of this SSD, it's time to peek inside the metal enclosure and inspect the Phison PS PS3105-S5 SSD internal components... Phison PS3105-S5 SSD ControllerPHISON Electronics Corporation may be best known as the founder of the Open NAND Flash Interface (ONFI) group, and an active contributor of the Non-Volatile Memory Host Controller Interface (NVMHCI) working group. Patriot Memory used Phison PS3016-S3 controller for their Patriot PS-100 SSD back in 2010, and Phison returns with their PS PS3105-S5 controller for the Patriot Torqx 2 SSD. The Phison PS3105 controller supports 20/30/40nm MLC/SLC Large-Block Toggle Hi-Speed NAND flash memory with up to 32 chips, and features a build-in 28/32/48-bit hardware ECC circuit (BCH). Using a 128MB DRAM buffer, the Torqx 2 SSD can offer ONFI 2.0 build-in static and dynamic NAND wear-leveling without compromising capacity for over-provisioning.
Illustrated above is the Patriot Torqx 2 SSD printed circuit board, which looks very similar to most other solid state drive PCB designs. Eight topside NAND flash modules sit in ranks behind the second-generation Phison PS PS3105-S5 SSD processor, and plenty of electronics fill the remaining space in-between. Intended to compete for the budget-friendly entry-level segment, the Patriot Torqx 2 adheres to customary design standards. This section will inspect the NAND flash, SSD controller, and DRAM buffer in more detail. Updated from the lackluster Phison PS3016-S3 controller that was used in the Patriot PS-100 and Imation M/S-Class devices (among others), the new Phison PS3105-S5 powers current-generation products from both manufacturers.
Phison PS PS3105-S5Designed from 90nm CMOS on a 324-pin BGA package, the Phison PS3105-S5 controller uses a 32-bit ARC 600 RISC CPU/DSP processor core paired to a 128/256MB LPDDR cache buffer. Capable of managing 43nm/34nm/25nm SLC/MLC NAND flash components with 4/8KB page and 3-bit/cell, the Phison PS3105-S5 offers 4-8x interleave over 16-bit flash channels with a 28/32/48-bit ECC hardware circuit (BCH). The Phison PS3105-S5 SSD controller offers native TRIM garbage collection in supporting Operating System (such as Microsoft Windows-7), Native Command Queuing (NCQ) with 32 command slots, and basic Self-Monitoring, Analysis, and Reporting Technology (SMART) command set.
Toshiba TH58NVG7D2FLA89The Patriot Torqx 2 sample we received was fitted with eight 32nm Toshiba TH58NVG7D2FLA89 16GB MLC NAND flash modules, with an 8K page size and 4CE chip select. Despite widespread use in the Apple iPad 2 tablet device and Apple iPhone 4 consumer SmartPhone device, specified speed ratings for this NAND component were not available at the time of this writing.
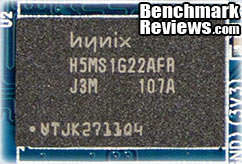
Hynix H5MS1G22AFROn the Patriot Torqx 2 SSD, a Hynix 128MB DDR buffer is used to cache transaction data to and from the NAND flash modules. The Hynix H5MS1G22AFR series is a 1,073,741,824-bit CMOS Low-Power Double Data Rate Synchronous DRAM (LPDDR), ideally suited for mobile applications which use battery power. The double data rate architecture is essentially a 2n prefetch architecture with an interface designed to transfer two data per clock cycle at the I/O pins. Hynix H5MS1G22AFR LPDRAM provides programmable read or write bursts of 2, 4, or 8 locations. Because the SandForce SF-2200 SSD processor is a non-exclusive component available market-wide, Benchmark Reviews expects to see several new solid state storage products using this same controller in the very near future. Please continue on to the next section for details on this particular model, and performance SSD test results... SSD Testing MethodologySolid State Drives have traveled a long winding course to finally get where they are today. Up to this point in technology, there have been several key differences separating Solid State Drives from magnetic rotational Hard Disk Drives. While the DRAM-based buffer size on desktop HDDs has recently reached 64 MB and is ever-increasing, there is still a hefty delay in the initial response time. This is one key area in which flash-based Solid State Drives continually dominates because they lack moving parts to "get up to speed". However the benefits inherent to SSDs have traditionally fallen off once the throughput begins, even though data reads or writes are executed at a high constant rate whereas the HDD tapers off in performance. This makes the average transaction speed of a SSD comparable to the data burst rate mentioned in HDD tests, albeit usually lower than the HDD's speed. Comparing a Solid State Disk to a standard Hard Disk Drives is always relative; even if you're comparing the fastest rotational spindle speeds. One is going to be many times faster in response (SSDs), while the other is usually going to have higher throughput bandwidth (HDDs). Additionally, there are certain factors which can affect the results of a test which we do our best to avoid. SSD Testing DisclaimerEarly on in our SSD coverage, Benchmark Reviews published an article which detailed Solid State Drive Benchmark Performance Testing. The research and discussion that went into producing that article changed the way we now test SSD products. Our previous perceptions of this technology were lost on one particular difference: the wear leveling algorithm that makes data a moving target. Without conclusive linear bandwidth testing or some other method of total-capacity testing, our previous performance results were rough estimates at best. Our test results were obtained after each SSD had been prepared using DISKPART or Sanitary Erase tools. As a word of caution, applications such as these offer immediate but temporary restoration of original 'pristine' performance levels. In our tests, we discovered that the maximum performance results (charted) would decay as subsequent tests were performed. SSDs attached to TRIM enabled Operating Systems will benefit from continuously refreshed performance, whereas older O/S's will require a garbage collection (GC) tool to avoid 'dirty NAND' performance degradation. It's critically important to understand that no software for the Microsoft Windows platform can accurately measure SSD performance in a comparable fashion. Synthetic benchmark tools such as HD Tach and PCMark are helpful indicators, but should not be considered the ultimate determining factor. That factor should be measured in actual user experience of real-world applications. Benchmark Reviews includes both bandwidth benchmarks and application speed tests to present a conclusive measurement of product performance. Test System
Storage Hardware TestedThe following storage hardware has been used in our benchmark performance testing, and may be included in portions of this article:
Test Tools
Test Results DisclaimerThis article utilizes benchmark software tools to produce operational IOPS performance and bandwidth speed results. Each test was conducted in a specific fashion, and repeated for all products. These test results are not comparable to any other benchmark application, neither on this website or another, regardless of similar IOPS or MB/s terminology in the scores. The test results in this project are only intended to be compared to the other test results conducted in identical fashion for this article. AS-SSD BenchmarkAlex Schepeljanski of Alex Intelligent Software develops the free AS SSD Benchmark utility for testing storage devices. The AS SSD Benchmark tests sequential read and write speeds, input/output operational performance, and response times. Because this software receives frequent updates, Benchmark Reviews recommends that you compare results only within the same version family. Beginning with sequential read and write performance, the 128GB Patriot Torqx 2 SSD produced 246.08 MB/s read speed, and 210.32 MB/s write performance. Single-threaded 4K IOPS performance delivers 11.34 MB/s read and 36.99 MB/s write, while the 64-thread 4K reads recorded 73.7 MB/s and write performance was 49.1 MB/s. None of these results are record-breaking, but they're rather impressive for a budget SSD.
Displayed in the chart below, the 64-thread 4KB IOPS performance results for several enthusiast-level storage products helps to illustrate which products offer the best operational input/output under load:
In the next section, Benchmark Reviews tests transfer rates using ATTO Disk Benchmark. ATTO Disk BenchmarkThe ATTO Disk Benchmark program is free, and offers a comprehensive set of test variables to work with. In terms of disk performance, it measures interface transfer rates at various intervals for a user-specified length and then reports read and write speeds for these spot-tests. There are some minor improvements made to the 2.46 version of the program that allow for test lengths up to 2GB, but all of our benchmarks are conducted with 256MB total length. ATTO Disk Benchmark requires that an active partition be set on the drive being tested. Please consider the results displayed by this benchmark to be basic bandwidth speed performance indicators.
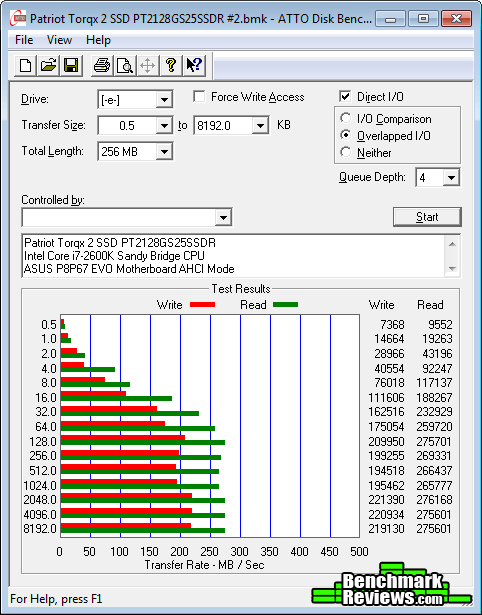
ATTO Disk Benchmark: Queue Depth 4 (Default)Our basic bandwidth speed tests begin with the Patriot Torqx 2 SSD attached to the Intel SATA 6Gb/s controller operating in AHCI mode. Using the ATTO Disk Benchmark tool, the test drive performs file transfers ranging from 0.5 KB to 8192 KB. The PT2128GS25SSDR model we received reveals 221 MB/s maximum read speed that plateaus from 128-8192 KB file chunks, and 276 MB/s peak write bandwidth plateaus from 128-8192 KB. These both exceed Phison's performance specifications, and meet with the manufacturer's own specification.
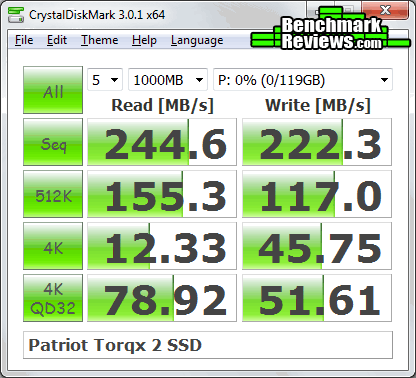
In the next section, Benchmark Reviews tests sequential performance using the CrystalDiskMark 3.0 software tool... CrystalDiskMark 3.0 TestsCrystalDiskMark 3.0 is a file transfer and operational bandwidth benchmark tool from Crystal Dew World that offers performance transfer speed results using sequential, 512KB random, and 4KB random samples. For our test results chart below, the 4KB 32-Queue Depth read and write performance was measured using a 1000MB space. CrystalDiskMark requires that an active partition be set on the drive being tested, and all drives are formatted with NTFS on the Intel P67 chipset configured to AHCI-mode. Benchmark Reviews uses CrystalDiskMark to illustrate operational IOPS performance with multiple threads. In addition to our other tests, this benchmark allows us to determine operational bandwidth under heavy load. Each of our tests with the Patriot Torqx 2 SSD were consistent, and the best results obtained were used in the chart below. Sequential tests on this Phison PS3105-S5 SSD produced a maximum read speed of 244.6 MB/s, while the write speed was 222.3 MB/s. CrystalDiskMark 3.0 reported 512K results of 155.3 MB/s read and 117.0 MB/s write performance. 4K tests produced 12.33 read and 45.75 write performance. 4KB queue depth 32 IOPS is one area where high-end SSDs truly excel, and the 128GB Patriot Torqx 2 SSD does its best to keep pace without the premium price tag.
Displayed in the chart below, the maximum 4KB queue depth 32 IOPS performance results for several enthusiast-level storage products illustrate which products offer the best operation under load:
In the next section, we continue our testing using Iometer to measure input/output performance... Iometer IOPS PerformanceIometer is an I/O subsystem measurement and characterization tool for single and clustered systems. Iometer does for a computer's I/O subsystem what a dynamometer does for an engine: it measures performance under a controlled load. Iometer was originally developed by the Intel Corporation and formerly known as "Galileo". Intel has discontinued work on Iometer, and has gifted it to the Open Source Development Lab (OSDL). There is currently a new version of Iometer in beta form, which adds several new test dimensions for SSDs. Iometer is both a workload generator (that is, it performs I/O operations in order to stress the system) and a measurement tool (that is, it examines and records the performance of its I/O operations and their impact on the system). It can be configured to emulate the disk or network I/O load of any program or benchmark, or can be used to generate entirely synthetic I/O loads. It can generate and measure loads on single or multiple (networked) systems. To measure random I/O response time as well as total I/O's per second, Iometer is set to use 4KB file size chunks over a 100% random sequential distribution at a queue depth of 32 outstanding I/O's per target. The tests are given a 50% read and 50% write distribution. While this pattern may not match traditional 'server' or 'workstation' profiles, it illustrates a single point of reference relative to our product field. The chart below illustrates combined random read and write IOPS over a 120-second Iometer test phase, where highest I/O total is preferred:
In our Iometer tests, which use 32 outstanding I/O's per target and a random 50/50 read/write distribution, SandForce SSDs clearly outperform the competition when tested which a larger queue depth. The PCI-Express based SandForce-driven RevoDrive SSDs lead the pack, followed by their latest SATA 6Gb/s storage solutions. The second-generation SandForce-driven OCZ Vertex 3 peaks at 57553, and delivers the fastest IOPS performance we've measured on any SATA-based SSD. With only 1194 combined IOPS, the Patriot Torqx 2 rounds out the low-end of all solid state drive devices. In our next section, we test linear read and write bandwidth performance and compare its speed against several other top storage products using EVEREST Disk Benchmark. Benchmark Reviews feels that linear tests are excellent for rating SSDs, however HDDs are put at a disadvantage with these tests whenever capacity is high. EVEREST Disk BenchmarkMany enthusiasts are familiar with the Lavalys EVEREST benchmark suite, but very few are aware of the Disk Benchmark tool available inside the program. The EVEREST Disk Benchmark performs linear read and write bandwidth tests on each drive, and can be configured to use file chunk sizes up to 1MB (which speeds up testing and minimizes jitter in the waveform). Because of the full sector-by-sector nature of linear testing, Benchmark Reviews endorses this method for testing SSD products, as detailed in our Solid State Drive Benchmark Performance Testing article. However, Hard Disk Drive products suffer a lower average bandwidth as the capacity draws linear read/write speed down into the inner-portion of the disk platter. EVEREST Disk Benchmark does not require a partition to be present for testing, so all of our benchmarks are completed prior to drive formatting. Linear disk benchmarks are superior bandwidth speed tools in my opinion, because they scan from the first physical sector to the last. A side affect of many linear write-performance test tools is that the data is erased as it writes to every sector on the drive. Normally this isn't an issue, but it has been shown that partition table alignment will occasionally play a role in overall SSD performance (HDDs don't suffer this problem). The high-performance storage products tested with EVEREST Disk Benchmark are connected to the Intel SATA 6Gb/s controller and use a 1MB block size option. Read performance on the 128GB Patriot Torqx 2 SSD measured an average 235.4 MBps bandwidth with a close maximum peak speed of 236.2 MBps. Everest linear write-to tests were next...
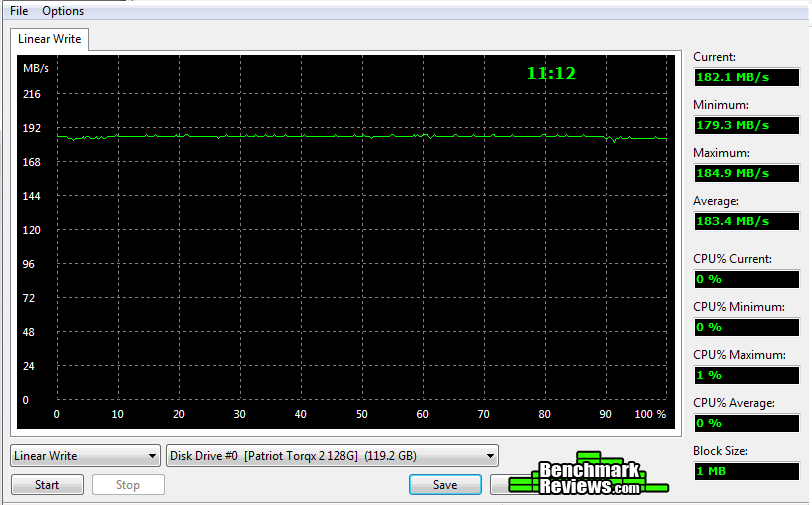
The waveform chart below illustrates how well the 128MB Hynix LPDDR buffer manages file transfers, and makes linear write performance appears relatively even across the band. These results are more consistent than other SSD products we've tested in the past, which occasionally exhibit wild peaks and valleys. The Patriot Torqx 2 solid state drive recorded an average linear write-to speed of 183.4 MBps, with a maximum performance of 184.9 MBps.
The chart below shows the average linear read and write bandwidth speeds for a cross-section of storage devices tested with EVEREST:
Linear tests are an important tool for comparing bandwidth speed between storage products - although HDD products suffer performance degradation over the span of their areal storage capacity. Linear bandwidth certainly benefits the Solid State Drive, since there's very little fluctuation in transfer speed. This is because Hard Disk Drive products decline in performance as the spindle reaches the inner-most sectors on the magnetic platter, away from the fast outer edge. In the next section I share my final thoughts on the struggle between SSD and HDD technology, as well as their new hybrid counterpart, before delivering my conclusion and final product rating. HDD vs Hybrid Drive vs SSDIt's been the same argument for over two years now: SSDs offer the best performance, but HDDs still offer the best capacity and price. Now that Solid State Hybrid drives are available, that argument changes. While the optimal blend of bandwidth speed, operational performance, storage capacity, and price value has yet to be delivered, products like the Seagate Momentus-XT offer an ultra-affordable start in the right direction Installed as a primary drive for notebook and value-conscious enthusiasts, the Solid State Hybrid Drive delivers up high-capacity storage space while starting Windows and opening programs like a SSD. The last days of old technology are always better than the first days of new technology. Never has this saying been more true than with the topic of storage technology, specifically in regard to the introduction of Solid State Drive technology a few years ago. The only things standing in the way of widespread Solid State Drive (SSD) adoption are high storage capacity and affordable price of Hard Disk Drive (HDD) devices. Because NAND flash-based SSD technology costs more per gigabyte of capacity than traditional magnetic hard drives, the benefits of immediate response time, transfer speeds, and operational input/output performance often get overlooked. Like most consumer products, it wasn't a question of how much improvement was evident in the new technology, it was price. I'll discuss product costs more in just a moment, but for now consider how each new series of SSD product employs greater performance than the one before it, convincing would-be consumers into waiting for the right time to buy.
Patriot Torqx 2 Solid State DriveThere's also a gray area surrounding SSD performance benchmarks that has me concerned. You might not know this, but SSDs can be very temperamental towards the condition of their flash NAND. My experience testing dozens of Solid State Drives is that a freshly cleaned device (using an alignment tool) will always outperform the same device once it's been formatted and used. A perfect example are Indilinx Barefoot-based SSDs, which suffers severely degraded performance when writing to 'dirty' flash NAND. The reason that all of this will matter is simple: the performance results reported to consumers in product reviews (such as this one) often report the very best performance scores, and the process used to obtain these results is not applicable to real-world usage. This is where garbage collection techniques such as TRIM become important, so that end-users will experience the same performance levels as we do in our tests. Garbage Collection (GC) is the current solution for keeping flash NAND in 'clean' condition, while maintaining optimal performance. Windows 7 offers native TRIM support, and most retail SSDs also include this special GC function or at least offer a firmware update that brings the drive up-to-date. For anyone using an Operating System or SSD that does not offer Garbage Collection functionality, you'll be using 'dirty' flash NAND modules and suffering sub-optimal performance for each write-to request. A few SSD manufacturers offers free tools to help restore peak-level performance by scheduling GC to 'clean' used NAND sectors, but these tools add excessive wear to the NAND the same way disk defragmenting tools would. SLC flash modules may resist wear much better than MLC counterparts, but come at the expense of increased production cost. The best solution is a more durable NAND module that offers long-lasting SLC benefits at the cost of MLC construction. Adoption is further stalled because keen consumers aware of this dilemma further continue their delay into the SSD market. Getting back to price, the changes in cost per gigabyte have come as often as changes to the technology itself. At their inception, high-performance models such the 32GB MemoRight GT cost $33 per gigabyte while the entry-level 32GB Mtron MOBI 3000 sold for $14 per gigabyte. While an enjoyable decline in NAND component costs forced consumer SSD prices down low in 2009, the price of SSD products was on the rise during 2010 and continued into 2011. Nevertheless, solid state drives continue to fill store shelves despite price or capacity, and there are a few SSD products now priced dangerously close to the high-performance storage solutions. Despite being less expensive, the cost of SSDs may still price some budget buyers out of the market. Sales prices notwithstanding, the future is in SSD technology - or possibly a high-capacity SSD hybrid - and the day when HDDs are obsolete is nearing close. Patriot Torqx 2 SSD ConclusionIMPORTANT: Although the rating and final score mentioned in this conclusion are made to be as objective as possible, please be advised that every author perceives these factors differently at various points in time. While we each do our best to ensure that all aspects of the product are considered, there are often times unforeseen market conditions and manufacturer changes which occur after publication that could render our rating obsolete. Please do not base any purchase solely on our conclusion, as it represents our product rating specifically for the product tested which may differ from future versions. Benchmark Reviews begins our conclusion with a short summary for each of the areas that we rate. Our performance rating considers how effective the Patriot Torqx 2 solid state drive performs in operations against direct competitor storage solutions. For reference, Phison specifies the PS3105-S5 SSD controller as capable of 250 MB/s reads 220 MB/s writes, which Patriot increases to 270 MB/s read and 230 write maximum speeds. In our SSD benchmark tests, the Patriot Torqx 2 performed at or above these speeds, and surpassed Phison and Patriot specification. Our test results proved the Patriot Torqx 2 solid state drive was good for delivering 276/221 MBps peak read and writes speeds using ATTO Disk Benchmark SSD speed tests. Everest Disk Benchmark produced 235/183 MB/s, positioning the Patriot Torqx 2 among other entry-level SSDs. The 128GB retail PT2128GS25SSDR kit that Patriot sent us for testing does not list any IOPS performance specifications, but in our own Iometer operational performance tests using a queue depth of 32 outstanding I/O's per target the IOPS performance measured only 1194. In this particular test, the formatted Patriot Torqx 2 trails nearly all other SATA-based SSD storage devices, but still triples the IO of spinning disk media. In the 4K 32QD tests with AS-SSD and CrystalDiskMark, the Patriot Torqx 2 was closer to last-generation's Indilinx drives than the SandForce-driven SSDs we see now. With the results we've received in our tests, hardware enthusiasts can expect quick response times at the expense of modest operational performance for demanding applications and extreme I/O environments. Solid State Drives are low-visibility products: you see them just long enough to install and then they're forgotten. Like their Hard Disk Drive counterparts, Solid State Drives are meant to place function before fashion. Anything above and beyond a simple metal shell is already more than what's expected in terms of the appearance. Patriot keeps to a back-to-basics look with the black textured finish and simple branding on their Torqx 2 SSDs. As solid state storage controllers become faster and more advanced, heat dissipation through the enclosure walls may demand that chassis designs become more beneficial than they previously needed to be. This isn't the case yet, and a metal chassis suits this Phison-based SSD just fine. Construction is probably the strongest feature credited to any solid state product line, and the Patriot Torqx 2 series is no exception. Solid State Drives are by nature immune to most abuses because of their architecture and technology, but the hard metal shell adds a superfluous level of protection. Offering a three-year product warranty, the Patriot Torqx 2 SSD series protects consumers if anything goes wrong with their purchase. If a Patriot SSD product does happen to fail during the 3-year warranty period, end-users can take advantage of free tech support by calling 1-800-800-9600 in the USA or completing a Patriot Customer Service Request Form. It's a good practice to first contact the retail outlet where the product was purchased for return authorizations, as they could possibly offer quicker turn-around times. In terms of overall value, Patriot has priced their entry-level Torqx 2 SSDs to be extremely affordable when compared to other current-generation solid-state storage products of the same capacity. Patriot offers the Torqx SSD series in four different capacities: 32GB: PT232GS25SSDR ($90), 64GB: PT264GS25SSDR ($135), 128GB: PT2128GS25SSDR ($225), 256GB: PT2256GS25SSDR ($520). In conclusion, the Patriot Torqx 2 solid state drive series is a good alternative to hard disk storage for hardware enthusiasts wanting the immediate application response time that SSDs are known for. Retail pricing is already fairly competitive, and because this product is fresh onto store shelves I expect to see it further reduced with time. It's difficult to recommend a product like the Torqx 2 series when you've tested similar SSDs that perform twice as fast with much better IO performance. Overall, I consider the Patriot Torqx 2 to be a safe gateway out of slow mechanical hard disk storage without the cost of most premium solid state drives. Pros:
+ Noteworthy 276/221 MBps read/write speed with ATTO Cons:
- Some manufacturers offer five-year warranty Ratings:
Final Score: 8.6 out of 10.Benchmark Reviews invites you to leave constructive feedback below, or ask questions in our Discussion Forum.
Related Articles:
|
|


Comments