| Intel Core-i7 4770K Haswell Processor |
| Reviews - Featured Reviews: Processors | |||||||||||||||||||||||||||||||||||||||||||||||||||||||||||||||||||||||||||||||||||||||||||||||||||||||||||||||||||||||||||||||||||||||||||||||||||||||||||||||||||||||||||||||||||||||||||||||||||||||||||||||||||||||||||||||||||||||||||||||||||||||||||||||||||||||||||||||||||||||||||||||||||||||||||||||||||||||||||||||||||||||||||||||||||||||
| Written by David Ramsey | |||||||||||||||||||||||||||||||||||||||||||||||||||||||||||||||||||||||||||||||||||||||||||||||||||||||||||||||||||||||||||||||||||||||||||||||||||||||||||||||||||||||||||||||||||||||||||||||||||||||||||||||||||||||||||||||||||||||||||||||||||||||||||||||||||||||||||||||||||||||||||||||||||||||||||||||||||||||||||||||||||||||||||||||||||||||
| Saturday, 01 June 2013 | |||||||||||||||||||||||||||||||||||||||||||||||||||||||||||||||||||||||||||||||||||||||||||||||||||||||||||||||||||||||||||||||||||||||||||||||||||||||||||||||||||||||||||||||||||||||||||||||||||||||||||||||||||||||||||||||||||||||||||||||||||||||||||||||||||||||||||||||||||||||||||||||||||||||||||||||||||||||||||||||||||||||||||||||||||||||
Intel Core i7-4770K Haswell Desktop Processor Review
Manufacturer: Intel Corporation Full Disclosure: The product sample used in this article has been provided by Intel. Many companies have committed to aggressive product introduction schedules, only to have them fall by the wayside as the reality of the development process overwhelmed the optimism of the marketing department. But Intel continues to stick to its annual "tick-tock" CPU release cycle, with Haswell family CPUs following only slightly more than a year after the groundbreaking Ivy Bridge line, which introduced low-leakage 3D transistors. Intel's annual schedule works like this: first, release a new processor architecture, then, about a year later, introduce a process-shrink refinement. The new architecture is a "tock" and the process refinement is a "tick". Previously, Sandy Bridge CPUs were the "tock" and last year's Ivy Bridge CPUs were the "tick". Haswell, with a new microarchitecture, is built on the same 22nm process introduced by Ivy Bridge, and next year's 14nm Broadwell processors will be the "tick" to Haswell's "tock." 
Although it's not formalized, historically each CPU family gets its own socket. We went from Core 2's Socket 1136 to Sandy Bridge's Socket 1155, which was maintained for Ivy Bridge. Haswell, however, introduces a new Socket 1150, as well as a new supporting chipset family, represented at the high end by the Z87. So you won't be able to just drop a Core i7-4770K into your existing rig; you'll need to update the motherboard as well. The increase in features and capabilities moving from Sandy Bridge to Ivy Bridge was more significant than many expected. You can read our review of the Ivy Bridge-based Core i7-3770K here. The combination of Ivy Bridge and the supporting Z77 chipset brought Thunderbolt support, more PCI-E 3.0 lanes, native USB 3.0, official support of DDR3-1600, and Intel Rapid Start technology. With Haswell, Intel is introducing a full range of Core i3, Core i5, and Core i7 CPUs, with special emphasis given to the mobile segment. However, what we've got today is their top-end desktop CPU, so let's see what it's got. Intel Core i7-4770K FeaturesThe following information is courtesy of Intel
Intel (SKU) SpecificationsIntel's initial Haswell CPU line comprises 7 mobile processors, 6 Core i7 desktop processors, and 7 Core i5 desktop processors, with Core i3 versions coming later. With the desktop CPUs at least, Intel's numbering scheme is more consistent: all Core i7 CPU have model numbers of the form 47xx, while all Core i5 CPUs have model numbers of the form 45xx and 46xx. As before, "K" series CPUs have unlocked multipliers for overclocking, while "S" and "T" series CPUs emphasize low power usage. Here are some representative models from the new (desktop) Core i5 and Core i7 lines:
Look at the specification of the new Core i7-4770K compared to last year's Core i7-3770K (the last column in the chart). TDP is up from 77 watts to 84 watts, graphics maximum frequency is down from 1350MHz to 1200MHz, and the graphics core is the new HD4600 with 20 "execution units" as opposed to last year's HD4000 with 16 "execution units". But that's about it for the differences. Cache, supported memory frequencies, base and boost clocks...they're all the same. Now, this is not to say that there aren't more differences:
MSRPs-- well, technically, they're "tray" prices for 1,000 pieces-- are up slightly: $26, or a bit less than ten percent, in the case of the 4770K vs. last year's 3770K. In the next section I'll look at what's new in the Haswell architecture, as well as taking a look at its supporting Z87 chipset. Haswell microarchitectureAs a "tock" phase CPU, Haswell has a new microarchitecture. Much of the focus on this new architecture (arguably most of the focus) was on lowering space and power requirements, as Intel sees tablets, ultrabooks, and low-power all-in-one designs as being very important moving forward. That's not to say they're ignoring the desktop market, but reading the Intel press deck, one certainly gets the impression that it's not their main focus. For example, one of the options for the mobile device segment is a hybrid chip with both a Haswell core and the PCH (platform controller hub) mounted on a single ball-grid array package. Intel brags about "unprecedented" increases in battery life, "unprecedented graphics in an ultra-thin form factor", and the applicability of Haswell mobile CPUs in "thin and light" platforms. There are a few bones thrown to desktop users. One desktop CPU feature enthusiasts will appreciate is the return of base clock tuning. Starting with Sandy Bridge, the classic overclocking technique of raising the system base clock become almost impossible, since the new design derived most other system clocks from the base clock. So by raising the base clock, you also raised the clocks used for other parts of the CPU as well as its communication with the rest of the system, and this meant that raising the base clock more the 3 or 4MHz would make your rig crash. Although Intel's description of this new "B-clock tuning" mechanism is void of any technical details, the claim is that you can "...achieve high core, graphics and memory frequencies by independently raising your clock speeds without impacting other system components". While not as versatile as multiplier overclocking, base clock overclocking should enable users of non-"K" series CPUs to finally get some extra performance.
The Haswell die layout looks almost identical to the Sandy Bridge and Ivy Bridge dies. The actual die size is up a little over the 3770K, at 177mm2 as opposed to 160mm2. Intel quotes the transistor count as 1.4 billion in either case, which seems odd given the increase in iGPU execution units. Although the die size is larger, the LGA1150 package desktop CPU is the exact same size as the LGA1155 desktop CPU. The only visible difference is a slight repositioning of the locator notch, so you hopefully won't be accidentally installing a CPU in the wrong socket. 
Ivy Bridge LGA1155 CPU on the left, Haswell LGA1150 CPU on the right.
The Z87 Platform Controller HubThe Z87 (Intel has dropped the "Express" designation) chipset, code-named Lynx Point, is the new Platform Controller Hub for the desktop Haswell CPUs. Speaking of "technical diagrams that look almost the same as the technical diagrams for the previous generation product", here's Intel's block diagram of a Haswell/Z87 system:
This diagram looks very similar to the Ivy Bridge/Z77 diagram. The main differences are:
None of this is earth-shaking, but represents instead a continual refinement of the capabilities we originally saw in the Z68/Sandy Bridge platform. Processor Testing MethodologySince Haswell is the successor to Ivy Bridge, it makes sense to directly compare the two CPUs. For this review, I compared the Ivy Bridge-based Core i7-3770K against the Haswell-based Core i7-4770K. Since many of the major specifications of the two CPUs are the same-- they have the same amount of cache, the same base and boost clock speeds, and so forth-- I'm not expecting huge differences in performance. But who knows? Often I am surprised by what objective benchmark testing reveals. I tested the Core i7-4770K processor at both its stock clock speed and the maximum stable overclock I could attain on all cores simultaneously, which was 4.5GHz. This was a disappointing 200MHz less than I was able to achieve when I originally tested the 3770K, itself not a particularly great overclocker. I'll have more on this in the Overclocking section. Since each CPU requires a different socket, I had to use two different motherboards to test. However, the memory, video card, and hard disks used were the same on both platforms. For the video card, I used a reference design AMD Radeon HD6850 running at stock clock speeds. Since the Haswell and Ivy Bridge integrated GPUs share L3 cache and memory bandwidth with the processor cores, the test configuration was different for CPU and iGPU testing:
Intel Z77 Express Test Platform
Intel Z87 Test Platform
Benchmark Applications: CPU
Benchmark Applications: Integrated GPU
Let's start the benchmarking with an AIDA64 run in the next section. AIDA64 Extreme Edition TestsAIDA64 is FinalWire's full 64-bit benchmark and test suite utilizing MMX, 3DNow! and SSE instruction set extensions, and will scale up to 32 processor cores. An enhanced 64-bit System Stability Test module is also available to stress the whole system to its limits. For legacy processors all benchmarks and the System Stability Test are available in 32-bit versions as well. All of the benchmarks used in this test- Queen, Photoworxx, ZLib, hash, and AES- rely on basic x86 instructions, and consume very little system memory while also being aware of Hyper-Threading, multi-processors, and multi-core processors. Of all the tests in this review, AIDA64 is the one that best isolates the processor's performance from the rest of the system. While this is useful in that it more directly compares processor performance, readers should remember that virtually no "real world" programs will mirror these results. For this review, FinalWire provided us with a beta version of AIDA64 with some Haswell-specific optimizations. 
The Queen and Photoworxx tests are synthetic benchmarks that iterate the function many times and over-exaggerate what the real-world performance would be like. The Queen benchmark focuses on the branch prediction capabilities and misprediction penalties of the CPU. It does this by finding possible solutions to the classic queen problem on a chessboard. At the same clock speed theoretically the processor with the shorter pipeline and smaller misprediction penalties will attain higher benchmark scores. Like the Queen benchmark, the Photoworxx tests for penalties against pipeline architecture. The synthetic Photoworxx benchmark stresses the integer arithmetic and multiplication execution units of the CPU and also the memory subsystem. Due to the fact that this test performs high memory read/write traffic, it cannot effectively scale in situations where more than two processing threads are used, so quad-core processors with Hyper-Threading have no real advantage. The AIDIA64 Photoworxx benchmark performs the following tasks on a very large RGB image:
The new kid on the block starts out with a stumble, as the 4770K actually turns in a slightly lower score on the Queen test than its predecessor. It makes up for this with a slightly higher score in the Photoworxx test. As we've seen before, overclocking doesn't help Photoworxx scores. 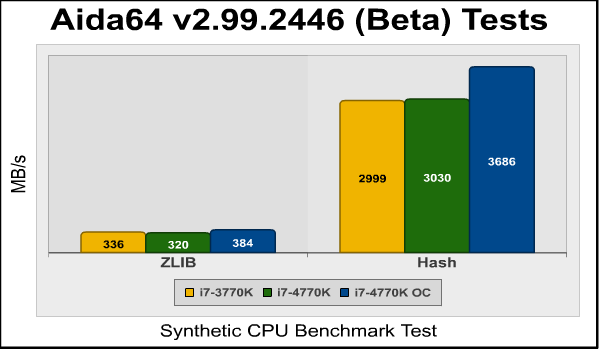
In the ZLIB test, the Haswell is 6.8% better than the Ivy Bridge (curiously, the same percentage improvement we saw in Ivy Bridge over Sandy Bridge), while in the Hash test it's 14.4% better...again mirroring the Sandy Bridge->Ivy Bridge gap. 
The performance improvement duplications continue in the AES test, where the Haswell CPU is 3.3% faster than the Ivy Bridge CPU. And, as with Ivy Bridge, overclocking Haswell actually slightly reduces its performance in this benchmark. Let's move on to the PCMark 7benchmark. PCMark 7 TestsPCMark 7 is Futuremark's successor to PCMark Vantage. The full suite of tests comprises seven different sequences with more than 25 sub-tests that exercise your system's abilities in storage, computation, image and video manipulation, web browsing and gaming. It was developed with input from the designers, engineers and product managers at AMD, Compal, Dell, Hitachi GST, HP, Intel, NVIDIA, Samsung, Seagate, Western Digital and many other well-known companies. For this benchmark I chose the PCMark test, which provides a number indicating total system performance, as well as the Productivity, Creativity, and Computation test suites. Productivity TestThe Productivity test is a collection of workloads that measure system performance in typical productivity scenarios. Individual workloads include loading web pages and using home office applications. At the end of the benchmark run the system is given a Productivity test score. The Productivity test consists of:
Creativity TestThe Creativity test contains a collection of workloads to measure the system performance in typical creativity scenarios. Individual tests include viewing, editing, transcoding and storing photos and videos. At the end of the benchmark run the system is given a Creativity test score.
Computation TestThe Computation test contains a collection of workloads that isolate the computation performance of the system. At the end of the benchmark run the system is given a Computation test score.
It's important to note that since PCMark 7 was designed as a system test, the scores are dependent on the configuration of the entire system being tested, including things like the memory, hard disk, and graphics cards used: it's not an isolated CPU test like most of the other benchmarks I'm using in this review. However, since all other hardware (motherboard, video card, memory, hard disk, etc.) was identical, with only the CPUs being changed, any performance differences here can be attributed to differences in CPU performance. 
Haswell manages a 9.4% increase in Productivity, a 2.3% increase in Creativity, and a 4.6% increase in Computation. Overclocked, the incremental improvements are minor except in Computation where the 4.5GHz Haswell increases its stock-clocked score by 15.6%. In the next section I run everyone's favorite benchmark: CINEBENCH! CINEBENCH 11.5Maxon CINEBENCH is a real-world test suite that assesses the computer's performance capabilities. CINEBENCH is based on Maxon's award-winning animation software, Cinema 4D, which is used extensively by studios and production houses worldwide for 3D content creation. Maxon software has been used in blockbuster movies such as Spider-Man, Star Wars, The Chronicles of Narnia, and many more. CINEBENCH Release 11.5 includes the ability to more accurately test the industry's latest hardware, including systems with up to 64 processor threads, and the testing environment better reflects the expectations of today's production demands. A more streamlined interface makes testing systems and reading results incredibly straightforward. The CINEBENCH R11.5 test scenario comprises three tests: an OpenGL-based test that models a simple car chase (which I didn't use for this test), and single-core and multi-core versions of a CPU-bound computation using all of a system's processing power to render a photo-realistic 3D scene, "No Keyframes", the viral animation by AixSponza. This scene makes use of various algorithms to stress all available processor cores, and all rendering is performed by the CPU: the graphics card is not involved except as a display device. The multi-core version of the rendering benchmark uses as many cores as the processor has, including the "virtual cores" in processors that support Hyper-Threading. The resulting "CineMark" is a dimensionless number only useful for comparisons with results generated from the same version of CINEBENCH.
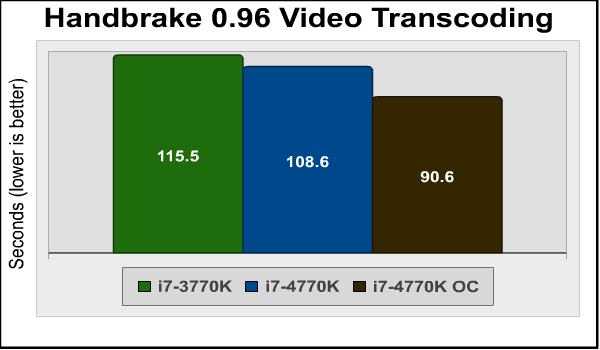
I'm particularly fond of CINEBENCH's multi-core rendering test, which highlights the performance advantages of more cores and Hyper Threading in an easy-to-appreciate visual manner. In multi-core rendering, the 4770K is 11.3% faster than the 3770K, but its lead increases to 33.7% when overclocked. In the single-core rendering test, the difference between the two processors is smaller, but Haswell is still 8% faster. Handbrake Media EncodingI like media encoding benchmarks for several reasons. One, most of them are "real world" benchmarks rather than synthetic benchmarks that are only good for comparison with other scores from the same benchmark. Second, media encoding is one of the very few things that can really use all the threads and horsepower a modern CPU can provide. Unless you're upgrading from a really old machine, that spiffy new CPU won't play your games any faster, nor make your web browsing any smoother. But when you're ripping that DVD to watch on your phone or tablet, then yeah, nobody ever said their transcoding was too fast. Intel changed this game dramatically with the introduction of the Sandy Bridge CPUs a couple of years ago. Their new "Quick Sync" feature leveraged the parallel cores of the new Intel HD integrated GPUs to dramatically speed transcoding tasks, and several third party programs jumped on the bandwagon. We'll start, though, with a program that doesn't use Quick Sync. For this test I used Handbrake 0.96 to transcode a standard-definition episode of Family Guy to the "iPhone & iPod Touch" presets, and recorded the total time (in seconds) it took to transcode the video.
The 4770K is only about 6% faster than the already quick 3770K. Overclocking does help, though, by trimming almost 19 seconds off of the total encoding time. x264 HD Benchmark 5.0With version 5.0, TechArp's x264HD Benchmark finally integrates AVX instructions into the main code branch. Previously, there were separate versions of this benchmark that used XOP and AVX instructions; now, they're integrated and will be used if your CPU supports them. Of course this means that the results from the new benchmark can't be directly compared to results from the old benchmark, but that's the price of progress. An added benefit is that the new version runs in full 64-bit mode. x264 HD 5.0 encodes a 1080p video segment into a high quality x264 format.
Both passes show the by now expected minimal performance improvements of the 4770K. In pass 1, the stock and overclocked increases over the 3770K are 3.6% and 19.2%, respectively; while in pass 2 they're 7.9% and 27%. Now, let's try something that uses Quick Sync: Arcsoft's Media Converter 7. For this fully Quick Sync aware program, I used the same Family Guy episode I used for Handbrake testing, transcoding it to Media Converter's built-in iPad presets. 
Intel brags a lot about the improvement in the AVX instructions in Haswell, but they compare them to Sandy Bridge, and here's why: the improvement over Ivy Bridge Quick Sync is minimal, only a touch over 4% faster at stock speeds. SPECviewperf 11 testThe Standard Performance Evaluation Corporation is "...a non-profit corporation formed to establish, maintain and endorse a standardized set of relevant benchmarks that can be applied to the newest generation of high-performance computers." Their free SPECviewperf benchmark incorporates code and tests contributed by several other companies and is designed to stress computers in a reproducible way. SPECviewperf 11 was released in June 2010 and incorporates an expanded range of capabilities and tests. Note that results from previous versions of SPECviewperf cannot be compared with results from the latest version, as even benchmarks with the same name have been updated with new code and models. SPECviewperf comprises test code from several vendors of professional graphics modeling, rendering, and visualization software. Most of the tests emphasize the CPU over the graphics card, and have between 5 and 13 sub-sections. For this review I ran the Lightwave, Maya, and Seimens Teamcenter Visualization tests. Results are reported as abstract scores, with higher being better. LightwaveThe lightwave-01 viewset was created from traces of the graphics workloads generated by the SPECapc for Lightwave 9.6 benchmark. The models for this viewset range in size from 2.5 to 6 million vertices, with heavy use of vertex buffer objects (VBOs) mixed with immediate mode. GLSL shaders are used throughout the tests. Applications represented by the viewset include 3D character animation, architectural review, and industrial design. MayaThe maya-03 viewset was created from traces of the graphics workload generated by the SPECapc for Maya 2009 benchmark. The models used in the tests range in size from 6 to 66 million vertices, and are tested with and without vertex and fragment shaders. State changes such as those executed by the application- including matrix, material, light and line-stipple changes- are included throughout the rendering of the models. All state changes are derived from a trace of the running application. Siemens Teamcenter Visualization MockupThe tcvis-02 viewset is based on traces of the Siemens Teamcenter Visualization Mockup application (also known as VisMockup) used for visual simulation. Models range from 10 to 22 million vertices and incorporate vertex arrays and fixed-function lighting.
The SPECviewperf suite is a good example of a real-world test of applications that would normally be the province of a high-end workstation: the individual tests comprise code and models from real applications, running scripts that do real work. Again we see that Haswell performance improvements over Ivy Bridge are fairly small: 5.3%, 14%, and 18%, respectively, in these three tests. SPECapc LightwaveSPECapc (Application Performance Characterization) tests are fundamentally different from the SPECviewperf tests. While SPECviewperf tests incorporate code from the various test programs directly into the benchmark, the SPECapc tests are separate scripts and datasets that are run against a stand-alone installation of the program being benchmarked. SPECapc group members sponsor applications and work with end-users, user groups, publications and ISVs to select and refine workloads, which consist of data sets and benchmark script files. Workloads are determined by end-users and ISVs, not SPECapc group members. These workloads will evolve over time in conjunction with end-users' needs and the increasing functionality of PCs and workstations. For this test, I ran the SPECapc "Lightwave" benchmark against a trial installation of Newtek's Lightwave 3D product. The benchmark, developed in cooperation with NewTek, provides realistic workloads that simulate a typical LightWave 3D workflow. It contains 11 datasets ranging from 64,000 to 1.75 million polygons and representing such applications as 3D character animation, architectural review, and industrial design. Scores for individual workloads are composited under three categories: interactive, render and multitask. The benchmark puts special emphasis on processes that benefit from multi-threaded computing, such as animation, OpenGL playback, deformations, and high-end rendering that includes ray tracing, radiosity, complex textures and volumetric lighting. The test reports three scores: Animation (multitasking), Animation (interactive), and Rendering. The numeric scores represent the time it took to complete each section of the benchmark, in seconds, so lower scores are better. I've found the SPECapc Lightwave 3D test to be an excellent indicator of overclock stability. In many cases, overclocked systems that will make it through every other benchmark here will crash in this test. 
Bear in mind that what this benchmark does is use scripts to control a stand-alone instance of Lightwave, so in that sense it's more indicative of real-world performance than the embedded Lightwave code in SPECviewperf. Again the performance difference between the two CPUs is almost nonexistent at stock clock speeds. However, overclocking brings significant performance benefits, especially in the multitasking script, where it's almost 30% faster than the stock-clocked CPU. BlenderBlender is an open-source, free content creation suite of 3D modeling, rendering, and animation capabilities. Originally released in 2002, it's available in versions for Mac OS X, Windows, Linux, and several Unix distributions. It supports rigid and soft-body objects and can handle the draping and animation of cloth, as well as the rendering and animation of smoke, water, and general particle handling. Our Blender test renders multiple frames of an animation of a rotating chunk of ice, with translucency and reflections. Rendering of this model uses ray-tracing algorithms and the program reports the rendering time for each of the animation's 25 frames. The results are a summation of the rendering times for all frames and the lower the score, the better. 
Blender is limited to a maximum of 8 threads, so these four-core Hyper-Threaded CPUs are a good match for it. Overclocking the Core i7-4770K provides about a 16% gain in performance. POV-Ray
The Persistence of Vision ray tracer is a free, open source 3D modeling program that uses ray-tracing algorithms to generate realistic three dimensional images. Ray tracing is very computationally intensive, and the POV-Ray program has a handy built-in benchmark to let you check the performance of your system. AMD wins this round, posting stock-clocked results that are 26% better than Intel, although the FX-8150's lead narrows to a mere percentage point when both processors
This test shows a somewhat larger performance gain for the 4770K over the 3770K. The former's score of 169.9 seconds is 12.5% better. Overclocking raises the difference to just over 28%. HD4600: DX11 performanceIntel claims that since 2006, the performance of their integrated graphics has increased by 75 times, as measured by 3DMark 06. Granted this is a pretty old benchmark that targeted DX9 capabilities, but you couldn't use more recent DX10 and DX11 tools to benchmark the performance of older systems. Of course the problem is that the HD4600 GPU isn't going to be compared to 7-year-old DX9 video cards; it's going to be compared against the video cards you can buy today. In this case I'll use a reference design AMD Radeon HD6850 video card. For these tests I set the iGPU to use the maximum amount of shared memory (512M), and I tested it at both stock (1250MHz) and overclocked (1600MHz) speeds. Let's start with the Heaven 3.0 benchmark and the Aliens vs. Predator benchmark. Heaven 3.0 settings: 1680x1050, moderate tessellation, medium shaders, no anti-aliasing, and 4x anisotropic filtering
Here we see that the HD4600 iGPU is much quicker than the HD4000: at 18.1 frames per second average, it's a whopping 68% faster in this test than the Ivy Bridge iGPU. Overclocking doesn't buy us much here, though, and the Radeon HD6850 is still more than twice as fast. AvP Settings: 1680x1050, medium textures, low shadows, advanced shadows off, SSAO off, no anti-aliasing, 8x anisotropic filtering
The performance difference is less dramatic with Aliens vs. Predator, but a 25% better frame rate is nothing to sneeze at, either. Again, overclocking doesn't help a whole lot, and the Radeon HD6850 is three and a half times faster. Last, let's take a look at 3DMark 11's GT1 through GT4 tests. These tests render underwater and jungle scenes with tessellation and multiple light sources, with distance blur and other features added with post-processing passes. For these tests I selected the "Performance" presets and set the resolution to 1680x1050. 
The GT1 and GT2 render underwater scenes with lots of cloudy water, moving submarines with light sources, and large structures seen murkily through the haze. The HD4600 is 33% faster than the HD4000 in the GT1 test and 48% faster in the GT2 test. 
The performance improvement is even more dramatic in the GT3 and GT4 tests, which render complex jungle scenes during the day and night, with very complex lighting filtering through dense foliage as we explore ruins in the jungle. In GT3, the HD4600 is a solid 90% faster than its forebear, while the difference in the GT4 tests is an amazing 136%! Last, let's take a look at the Lost Planet benchmark. 
OK, this one's strange. Performance of the HD4600 is actually 27% slower than the previous generation HD4000! Even overclocked to 1600MHz, the HD4600 can't keep up with its Ivy Bridge parent. I'm at a loss to explain this one, but I ran the tests multiple times, and these are the results... Now that we've run the benchmarks, let's see what went into overclocking the Core i7-4770K in the next section.
|
|||||||||||||||||||||||||||||||||||||||||||||||||||||||||||||||||||||||||||||||||||||||||||||||||||||||||||||||||||||||||||||||||||||||||||||||||||||||||||||||||||||||||||||||||||||||||||||||||||||||||||||||||||||||||||||||||||||||||||||||||||||||||||||||||||||||||||||||||||||||||||||||||||||||||||||||||||||||||||||||||||||||||||||||||||||||


| 4770K Stock | 4770K OC | 4770K Stock | 4770K | ||
| OCAIDA64 Queen | 1.0 | 1.21 | x264HD Pass 1 | 1.0 | 1.15 |
| AIDA64 Photoworxx | 1.0 | 1.00 | x264HD Pass 2 | 1.0 | 1.18 |
| AIDA64 AES | 1.0 | 1.22 | SPECviewperf Lightwave | 1.0 | 1.12 |
| AIDA64 ZLIB | 1.0 | 1.20 | SPECviewperf Maya | 1.0 | 1.13 |
| AIDA64 Hash | 1.0 | 1.22 | SPECviewperf TCVIS | 1.0 | 1.04 |
| CINEBENCH Single Core | 1.0 | 1.15 | SPECapc Lightwave Interactive | 1.0 | 1.15 |
| CINEBENCH Multi Core | 1.0 | 1.20 | SPECapc Lightwave Multitasking | 1.0 | 1.10 |
| Handbrake 0.96 | 1.0 | 1.17 | SPECapc Lightwave Rendering | 1.0 | 1.17 |
| PCMark 7 PCMarks | 1.0 | 1.05 | Blender/Icetest | 1.0 | 1.16 |
| PCMArk 7 Productivity | 1.0 | 1.05 | POV-Ray | 1.0 | 1.18 |
| PCMArk 7 Creativity | 1.0 | 1.05 | Arcsoft Media Converter | 1.0 | 1.11 |
| PCMark 7 Computation | 1.0 | 1.16 | Average Performance Improvement | 13.8% | |
The 13.8% average performance improvement from overclocking is considerably less than the 18% improvement returned by the overclocked 3770K. I suspect that in most real-world scenarios, an overclocked 3770K will provide performance slightly better than an overclocked 4770K.
Overclocking the iGPU was pretty easy: I was able to raise the frequency to 1600MHz from 1250MHz without a problem. Going any faster crashed the display driver, even with voltage tweaks, but the system always recovered.
| iGPU Stock FPS | iGPU OC FPS | % improvement | |
| Unigine Heaven 3.0 | 18.1 | 19.6 | 8.3 |
| Aliens vs. Predator | 18.7 | 20.8 | 11.2 |
| 3DMark GT1 | 3.2 | 4.0fps | 25.0 |
| 3DMark GT2 | 3.62 | 4.52 | 24.9 |
| 3DMark GT3 | 5.54 | 6.78 | 22.4 |
| 3DMark GT4 | 2.58 | 3.18 | 23.3 |
| Lost Planet 2 | 6.7 | 8.0 | 19.4 |
|
Average Performance Improvement |
19.2% | ||
The average 19.2% improvement is a good dollop of free iGPU performance.
Overclocking the Haswell Core i7-4770K was ultimately disappointing, but better results may be possible with more exotic cooling methods. Join me in the next section for my final thoughts and conclusion.
Haswell Final Thoughts
As a "tock"-cycle CPU, the Intel Core i7-4770K represents the first of a new CPU architecture, the 22nm equivalent of Sandy Bridge. If Intel sticks to its annual release schedule, we'll see the "tick"-cycle Broadwell CPUs, based on a smaller process (rumored to be 14nm), about this time next year. Perhaps this will bring more performance improvements, because I have to say I was disappointed in the performance of this CPU as compared to Ivy Bridge or even Sandy Bridge. Let's take a look at the stock-clocked performance difference on the CPU tests I ran between last year's 3770K and the new 4770K. For this chart I've normalized the 3770K scores as "1" and expressed the 4770K scores as the increase, so a 4770K score of "1.05" would mean that it's five percent faster on a given benchmark.
| 3770K | 4770K | 3770K | 4770K | ||
| AIDA64 Queen | 1.0 | 0.96 | x264HD Pass 1 | 1.0 | 1.03 |
| AIDA64 Photoworxx | 1.0 | 1.02 | x264HD Pass 2 | 1.0 | 1.07 |
| AIDA64 AES | 1.0 | 1.10 | SPECviewperf Lightwave | 1.0 | 1.05 |
| AIDA64 ZLIB | 1.0 | 0.95 | SPECviewperf Maya | 1.0 | 1.13 |
| AIDA64 Hash | 1.0 | 1.01 | SPECviewperf TCVIS | 1.0 | 1.18 |
| CINEBENCH Single Core | 1.0 | 1.07 | SPECapc Lightwave Interactive | 1.0 | 1.02 |
| CINEBENCH Multi Core | 1.0 | 1.11 | SPECapc Lightwave Multitasking | 1.0 | 1.04 |
| Handbrake 0.96 | 1.0 | 1.06 | SPECapc Lightwave Rendering | 1.0 | 1.05 |
| PCMark 7 PCMarks | 1.0 | 1.06 | Blender/Icetest | 1.0 | 1.05 |
| PCMArk 7 Productivity | 1.0 | 1.09 | POV-Ray | 1.0 | 1.13 |
| PCMArk 7 Creativity | 1.0 | 1.02 | Arcsoft Media Converter | 1.0 | 1.04 |
| PCMark 7 Computation | 1.0 | 1.05 | Average Performance Improvement | 5.3% | |
As you can see, the average performance improvement as measured on these benchmarks was a mere 5.3%. The only impressive thing about this is that is beats the average 4.0% improvement Ivy Bridge had over Sandy Bridge. Things are brighter on the integrated video side, though:
| HD4000 | HD4600 | |
| Heaven 3.0 | 1.0 | 1.68 |
| 3DMark 11 GT1 | 1.0 | 1.34 |
| 3DMark 11 GT2 | 1.0 | 1.47 |
| 3DMark 11 GT3 | 1.0 | 1.90 |
| 3DMark 11 GT4 | 1.0 | 2.41 |
| Alien vs. Predator | 1.0 | 1.25 |
| Lost Planet | 1.0 | 0.73 |
| Media Converter | 1.0 | 1.05 |
| Average Performance Improvement | 47% | |
A 47% improvement is impressive, especially considering that there are only 25% more "execution units". What's even more impressive is that this comes on top of the 44% improvement we saw from Sandy Bridge's HD3000 to Ivy Bridge's HD4000. Now, the cynical might say that dramatic improvements like this are easy when starting from such a low baseline, but at the end of the day it's still quite an accomplishment. The Haswell HD4600 GPU makes playing games-- albeit at lower resolutions with things like anti-aliasing reduced or turned off-- much more feasible than it's been before.
So the desktop Haswell's performance improvements are minimal. I see two reasons for this: one, CPUs at this level are already much more than fast enough for the vast majority of consumer applications. For those few running heavily threaded professional apps, there's always Sandy Bridge Extreme LGA2011 systems. Two, there's no competition at this level: AMD's FX-series 8 core CPUs offer competitive performance in their price range, but get thoroughly stomped in single core performance by the even Sandy Bridge CPUs a level or two up. AMD has nothing that can come close to competing with upper-end Ivy Bridge or Haswell CPUs.
But remember that the desktop market isn't the focus for this new architecture: battery-powered and mobile devices are. Haswell's iGPU is much faster than the previous generation, which will enable tablets, ultrabooks, and notebooks to offer much better integrated video performance, especially with the higher-resolution screens that are becoming more common. Also, mobile versions of Haswell reportedly offer much lower power draw, especially in idle and sleep conditions, that should dramatically extend the life of a battery charge. There's no way for us to test and compare BGA-packaged mobile CPUs, even if Intel would sample them, so we'll just have to wait and see what kind of performance Haswell-based mobile devices deliver.
Neither of these improvements, though, make any real difference to the desktop market. Desktop users might use Lucid Virtu in conjunction with a discrete video card, but they're unlikely to notice any performance difference there (and few users buying a 4770K are going to build a system without a discrete video card). Likewise, Haswell's power savings are irrelevant on the desktop, where the electricity cost of running the CPU flat-out for 24 hours straight will be less than a quarter in most parts of the country.
It would have been nice to see a few more bones thrown to us desktop users. Haswell has a few new instruction tricks, but you'll need new software to exploit them to full effect. We get a few more SATA 6G and USB 3.0 ports, but Intel's determined not to give us the one improvement we'd really like: more PCI-E lanes, as Haswell is still limited to 16 from the CPU and 8 from the Z87 chipset. If a super-expensive LGA2011 system isn't in the cards, there's still AMD's 18-month-old 990FX system, which offers 40 PCI-E lanes, six SATA 6G ports (but still no native USB 3.0).
Core i7-4770K Conclusion
Haswell and its supporting "Lynx Point" Z87 chipset represent yet another incrementally refined iteration of Intel's mainstream CPU platform. Performance improvements at the CPU level are minor and will be unnoticeable except in benchmarks. The performance of the integrated GPU has been substantially improved, but it's still far behind all but the lowest-end video cards and not really germane to desktop users.

Ultimately, Haswell is a disappointment for desktop users, since it offers nothing significant in the way of performance or feature improvements. It seems as if it will be a while before we see anything like the leap in performance we marveled at when Sandy Bridge succeeded the Core2 architecture (read our Core i7-2600K processor review if you need reminding of just how dramatic that performance improvement was). If anything, "desktop Haswell" is a step backwards, since its 10% price increase combined with its 5% performance increase means that the Core i7-4770K simply isn't as good a value as the 3770K. Depending on the luck of the draw and your CPU cooling setup, it's entirely possible you could overclock an Ivy Bridge or Sandy Bridge CPU to be faster than an overclocked Haswell.
As of June 2013 the Intel Core i7-4770K (Part Number: BX80646I74770K) is available online for $349.99 (Newegg | Amazon).
If you're building a new rig from scratch, sure, go with Haswell, as its minor price increase can be justified if you consider all the plusses: the performance, if only slightly better than Ivy Bridge, still makes it the fastest consumer CPU available; and there are a few more USB 3.0 and SATA 6G ports, and so forth. And, unless you find a sale going on, there's no reason to put money into the end-of-life LGA1155 platform. But if you're currently running an LGA1155 setup, there's certainly no compelling reason to upgrade to Haswell.
That said, I find myself torn on how to rate this processor. On the one hand, it's the fastest consumer CPU. On the other hand, you could slip Haswell hardware into a two-year-old Sandy Bridge setup and the owner would never notice. On the gripping hand, is it fair to ding a product that's the best in its class because it's not as good as we wanted it to be?
Ultimately, I can't blame Intel for prioritizing features that strongly favor mobile devices, because you don't have to be Nostradamus to see that's where the future of consumer computing is. If only it overclocked better...
Pros:
+ Still the best single-core performance available
+ Dramatically improved iGPU performance
+ Mobile versions offer new ultra-low-power modes
+ At least Intel didn't change the cooler mounting points
Cons:
- Only incremental CPU performance improvements over Ivy Bridge
- New socket means a new motherboard is required for upgrades
- Still only 16 PCI-E lanes
- Relatively poor overclocking
Ratings:
-
Performance: 9.50
-
Overclock: 6.75
-
Construction: 9.00
-
Functionality: 9.25
-
Value: 8.50
Final Score: 8.60 out of 10.
Recommended: Benchmark Reviews Seal of Approval.
COMMENT QUESTION: How often do you upgrade your PC?
Related Articles:
- MSI N460GTX HAWK GeForce GTX 460
- NVIDIA GeForce GTX 770 Video Card
- GeForce GTS 450 SLI Scaling Performance
- CM Storm Scout 2 Gaming PC Case
- SteelSeries Sensei Pro Laser Gaming Mouse
- Gigabyte GV-NX98X1GHI-B GeForce 9800 GX2 Video Card
- EonNAS 1100 NAS Network Storage Server
- Xigmatek Red Scorpion S1283 HDT CPU Cooler
- Thecus N7700 SATA 7-Disk RAID NAS
- Xigmatek Thor's Hammer S126384 CPU Cooler

Comments
"even going to 4550GHz by tweaking the base clock resulted in crashes"
(4th para, pg 12)
Excellent write up David Ramsey. Thank you.
I wonder what TIM was used this time.
I feel this will be a very nice chip for the laptop crew as the GPU is a great step up.
I see nothing to make me shift from Sandy in my desktop, not even in the new chipsets.
I will most likely get a new system this year an waited for Haswell (and the Nvidia 700 series), but it does not seem to be a very interesting new product for PC gamers like me.
Currently I have an i7920 with a GTX295.
Any recommendations, ideas, suggestions?
(My new GPU will most likely be the GTX780.)
Would it be wise to switch to the new socket?
Ok, being a layman that was not quite clear to me.
Is the LGA2011 platform at the end-of-life too?
The i7 3820 is a hundred bucks cheaper than the i74770 and appears to be just as powerful.
Yes, a Core i7-3820 will be (for all intents and purposes) about the same performance as a 4770K, except in things that use the integrated GPU like Quick Sync. You would have to buy an expensive LGA2011 motherboard, though. And while the LGA 2011 isn't EOL, it's a more expensive platform overall, and it's not really worth the money unless (A) you really anticipate a need for a six-core CPU in the future, or (B) can really used all those PCI-E lanes. In the meantime you're giving up the advantages of the Haswell platform, like more SATA 6G ports, integrated USB 3.0, and all those fun Intel SSD caching things.
Thank you so much for your time.
You've really helped me to decide.
One can read all the reviews one can digest, but for a layman it is very difficult to get a clear view of these complex technical matters.
I might wait a few more months (if I can muster the patience) and then I will opt for a Haswell based machine with a GTX780.
I noticed that my GTX295 has difficulty keeping up with the latest games. And I want my machine to be able to run games like Metro Last Light, and the upcoming Watchdogs, Batman Arkham Origins, and most of all GTA V etc without any problems.
I read somewhere that my current motherboard would limit the newer much faster videocards like the GTX780 in their data throughput. So I figured I needed a new system.
Unless you have cash to burn then just buy the best :D
Just my 2cents.
In terms of game playing, though, no current video card can even come close to saturating the bandwidth of 16 PCI-E 2.0 lanes. So a newer motherboard won't help there.
I have an i7-2600K that I can push to 4800Ghz.
Can only push the 4770K to 4400Ghz.
But even with both at 4400Ghz, the 2600K is far faster than the 4770K.
I do not play games. I am a developer and I usually compile 24 huge projects at the same time which pushes the CPU to the max.
After I do a 7Zip to all 24 EXEs at the same time again.
The 2600K finishes the same task way faster than the 4770K.
Don't know why but its the disappointed truth.
Have an i7-2600K + Asus P8P67 WS Revolution and now an i7-4770K + ASUS Z87 Deluxe.
Will have to sell this new babies and keep the 2600K.
Hope this helps some of you.
Pico
What really bugs me about this is that well, Intel has taken VT-d out of the K series of parts. It's a matter of chasing short term profits for long term gains IMO. Actually, if they wanted enthusiasts to buy Xeons, they could try to sell a "K" series of Xeon cpu.
Then you realize that Intel is a monopoly and that well, they can pull this sort of segmentation off because well, there's nothing the competition can do.
Something which AMD has in their plans for future release.
I do a lot of desktop and programs work on three 1200 res monitors and sometimes the computer slows down . even when transferring files from one hard drive to another it can kill the system.
would I benefit upgrading my system would I see a big upgrade at the same clock speed.
thanks for any advice
Without knowing more it's hard to say what the problem is. If you're running an old XP box, it's probably full of crufty software junk. Limited RAM can affect performance as stuff must be continually swapped out to disk, and hard disks themselves could be slow.
For most people, upgrading from a hard disk to an SSD is the single biggest performance improvement they can make. You might want to try this and see if it helps. You can of course always use the SSD if you decide to subsequently upgrade the entire system.
windows 7 and have two f3 samsungs and 4gig ram that uses 60%
still wanting to upgrade but wanted to know if it was worth it
thanks
I've had no issues with gaming or working through windows, it was more of an 'upgrade itch'. So in the end I backpedalled out of the rebuild idea. I had been running on my XFX 5870 GPU for the last three and bit years, so opted to put the cash there instead and went for a Vapor-X 7970GhZ. Money well spend imho. I can probably squeeze some more out the i7920 (DO) if I need to, and wait till next year for Broadwell before I rebuild....or at least that's my thinking, and the question is, do people agree with the approach?
I am almost in the same position as you(see my comment above).
thanks for any advice
Paket Pulau Tidung