| OWC Mercury Extreme Pro 6G SSD |
| Reviews - Featured Reviews: Storage | |||||||||||||||||||||||||
| Written by Olin Coles | |||||||||||||||||||||||||
| Monday, 01 August 2011 | |||||||||||||||||||||||||
OWC Mercury Extreme Pro 6G SSD Review
Manufacturer: Other World Computing, Inc. Full Disclosure: The product sample used in this article has been provided by Other World Computing. Other World Computing is well known to Apple Mac users, because they've focused on their needs for many years. But when you offer a five year warranty on PC-friendly components, it's hard to ignore the value. The OWC Mercury Extreme Pro 6G SSD OWCSSDMX6G120T is built from the 2nd-generation SandForce SF-2281 controller, and delivers up to 60,000 IOPS over the latest SATA 6Gb/s connection. Best of all, OWC offers a no-risk no-hassle 30-day money back guarantee. In this article, Benchmark Reviews tests the OWC Mercury Extreme Pro 6G solid state drive against the leading competition. The second-generation SF-2281 SSD processor maintains all of the original core technology SandForce originally introduced in the SF-1200 series, but now improves SSD performance with 20% faster IOPS and 40% faster sequential read/write throughput. They've enhanced BCH ECC capability, and the new processor now supports ATA-7 Security Erase. Finally, the new SF-2200 series implements cost-effective 20nm-class NAND flash from all leading flash vendors with Asynch/ONFi1/ONFi2/Toggle interfaces. For many within the industry, SandForce was seen to control the 2010 market in much the same way that Indilinx did in 2009. The difference now is that SandForce's platform offers several technical benefits that the Indilinx platform was not capable of. Already into the Q3-2011, the landscape is approximately the same, but with some interesting new twists. Benchmark Reviews confirms that they're keeping this promise with tests of the new storage device on a B3-stepping Sandy Bridge platform.
Even after decades of design improvements, the hard disk drive (HDD) is still the slowest component in any personal computer system. Consider that modern desktop processors have a 1 ns response time (nanosecond = one billionth of one second), while system memory responds between 30-90 ns. Traditional hard drive technology utilizes magnetic spinning media, and even the fastest spinning mechanical storage products still exhibit a 9,000,000 ns / 9 ms initial response time (millisecond = one thousandth of one second). In more relevant terms, the processor receives the command and must then wait for system memory to fetch related data from the storage drive. This is why any computer system is only as fast as the slowest component in the data chain; usually the hard drive. In a perfect world all of the components operate at the same speed. Until that day comes, the real-world goal for achieving optimal performance is for system memory to operate as quickly as the central processor and then for the storage drive to operate as fast as memory. With present-day technology this is an impossible task, so enthusiasts try to close the speed gaps between components as much as possible. Although system memory is up to 90x (9000%) slower than most processors, consider then that the hard drive is an added 1000x (100,000%) slower than that same memory. Essentially, these three components are as different in speed as walking is to driving and flying. Solid State Drive technology bridges the largest gap in these response times. The difference a SSD makes to operational response times and program speeds is dramatic, and takes the storage drive from a slow 'walking' speed to a much faster 'driving' speed. Solid State Drive technology improves initial response times by more than 450x (45,000%) for applications and Operating System software, when compared to their mechanical HDD counterparts. The biggest mistake PC hardware enthusiasts make with regard to SSD technology is grading them based on bandwidth speed. File transfer speeds are important, but only so long as the operational IOPS performance can sustain that bandwidth under load. Bandwidth Speed vs Operational PerformanceAs we've explained in our SSD Benchmark Tests: SATA IDE vs AHCI Mode guide, Solid State Drive performance revolves around two dynamics: bandwidth speed (MB/s) and operational performance (IOPS). These two metrics work together, but one is more important than the other. Consider this analogy: bandwidth determines how much cargo a ship can transport in one voyage, and operational IOPS performance is how fast the ship moves. By understanding this and applying it to SSD storage, there is a clear importance set on each variable depending on the task at hand. For casual users, especially those with laptop or desktop computers that have been upgraded to use an SSD, the naturally quick response time is enough to automatically improve the user experience. Bandwidth speed is important, but only to the extent that operational performance meets the minimum needs of the system. If an SSD has a very high bandwidth speed but a low operational performance, it will take longer to load applications and boot the computer into Windows than if the SSD offered a higher IOPS performance.
Closer Look: OWC Mercury Extreme Pro 6GSSDs are quickly gaining popularity because they work equally well in PC, Linux, or Apple Mac computers. Likewise, they install into both desktop and notebook platforms without modification. For this article Benchmark Reviews is testing the 120GB OWC Mercury Extreme Pro 6G SSD Solid State Drive, which is specified to reach speeds of 559 MB/s for sequential reads and 527 MB/s sequential writes. The OWCSSDMX6G120T model we've received for testing is built using the SandForce SF-2281 SSD controller and Intel-Micron NAND flash components. Other World Computing offers two capacities for their Mercury Extreme Pro 6G series of solid state drives: 120GB and 240GB. Performance specifications usually increase with capacity as a result of the larger integrated buffer, but OWC offers the same specifications for both models. All of the OWC Mercury Extreme Pro 6G SSD models share the same part numbers with a capacity designator: OWCSSDMX6G120T stands for 120GB.
The OWC Mercury Extreme Pro 6G SSD is best suited for performance-orientated personal computers, but could also work well for SOHO computer workstation systems. SandForce SF-2200 series SSDs have been designed with a focus on high-performance operational and data transfer speeds, and includes 256-bit encrypted data protection and improved NAND wear-leveling through their proprietary DuraWrite technology. Other World Computing recognizes that once installed, the SSD will be hidden away from view inside a notebook computer or desktop workstation, so they've remained conservative towards the design of their solid state drive appearance. Each half of the drive enclosure is given a textured blue anodized aluminum finish, which does not show fingerprints or smudges like a gloss surface would. A glossy label is attached to each side of the SSD enclosure, denoting model and capacity. Standard 2.5" drive bay mounting points are pre-drilled and threaded into the OWC Mercury Extreme Pro 6G SSD chassis, which allows for quick upgrade or addition into any existing notebook and other compact computer system. Unfortunately, OWC does not includes a 3.5" to 2.5" tray adapter with the Mercury Extreme Pro 6G kit. The mounting positions matched up to the drive bracket on my notebook computer, and after only a few minutes I was booting from a restored Windows 7 System Image without a hitch.
Unlike most Hard Disk Drive (HDD) storage products, SSDs are nearly impervious to impact damage and do not require (or benefit from) any kind of special vibration dampening or shock-proof enclosures. OWC utilizes a standard two-piece metal enclosure for their Mercury Extreme Pro 6G-series SSDs, which reveals the internal components after removing four small counter-sunk screws located along the sides of this solid state drive. The seam along the side is covered with a 'Warranty Void' label, which OWC attaches to warn consumers against taking apart their product. By removing the SSD cover it will also remove your consumer protection with it. If you're familiar with previous-generation OWC solid-state storage products, you'll notice that looks for the Mercury Extreme Pro 6G series haven't changed beyond the descriptive product decal. While its outward appearance is similar to many other solid state drives, the functionality and value packaged inside are considerably unique. Now that you're acquainted with the basic exterior features of this SSD, it's time to peek inside the metal enclosure and inspect the SandForce SF-2281 internal components...
SandForce introduces their new second generation solid state drives to both consumer and enterprise segments, with seven different models to choose from. On the consumer (retail) side you've got models using the older SATA 3Gb/s interface as well as the latest SATA 6Gb/s interface, while all enterprise drives utilize the 3rd-generation SATA 6Gb/s interface. More than any other factor, it's the Flash Channels/Byte Lanes configuration that these separate models. SandForce's SF-2000 series of SSDs continue to feature up to 8 data channels organized into 16 Byte lanes; similar to the previous generation of SF-1222/SF-1565 series SSD controllers, but now some models are scaled down for usage scenarios not requiring massive IO activity. On second-generation SandForce-driven SSDs, a new SATA 6Gb/s SandForce SF-2281VB1-SDC processor is part of their SF-2200 family of retail SSD controller chips, although and identical SF-2181 processor exists for older SATA 3Gb/s connections. Offering 8 flash channels with 8 Byte lanes configured (one lane per channel), the SF-2281 maintains a BGA-256 package whereas the top-end SF-2282 delivers two lanes per channel on a BGA-400 package. More detail is available in our SandForce SF-2000 Series SSD Processor Overview article. 
SandForce SF-2281VB1-SDC ControllerAll SandForce SSD controllers offer native TRIM garbage collection in supporting Operating System (such as Microsoft Windows-7), Native Command Queuing (NCQ) with 32 command slots, and basic Self-Monitoring, Analysis, and Reporting Technology (SMART) command set. SandForce built the SF-2200 series to produce 500 MB/s Sequential Read and Write bandwidth with 60K (burst)/20K (sustained) IOPS Random Write (4K transfers). The SF-2200 SSD processor provides enhanced ECC with BCH data protection, and also includes SandForce's unique RAISE (Redundant Array of Independent Silicon Elements) technology. RAISE provides the protection and reliability of RAID on a single SSD drive, thanks to flash architecture, without the significant write overhead of parity. The SandForce DuraClass technology automatically stores data using Trusted Computing Group (TCG) OPAL security with 256-bit AES encryption and automatic, line-rate double encryption with a drive-level password, preventing data extraction directly from the physical flash memory modules.
Toshiba TH58TAG7D2FBAS9 Toggle-NAND FlashSandForce enables support for advanced 30nm- and 20nm-class NAND flash from all leading flash vendors with Asynch/ONFi1/ONFi2/Toggle interfaces with data transfer rates up to 166 Mega Transfers per second. Their latest generation of controllers also offers advanced ECC engine correcting up to 55 bits per 512-byte sector to assure high data integrity and support for future generations of flash memory. On the OWC Mercury Extreme Pro 6G SSD, sixteen multi-layer cell Toshiba TH58TAG7D2FBAS9 Toggle-NAND flash modules are joined to the SandForce SF-2281 controller. Consumer-level SandForce SSDs generally allocate 7% capacity over-provisioning and 128GB devices will yield 120GB of usable storage space. SandForce SF-2200 Features
Endurance and Longevity
Performance and Power Optimization
Mobile Computing Security
Data Protection and Reliability SF-2281 Specifications
Source: SandForce SSD Testing MethodologySolid State Drives have traveled a long winding course to finally get where they are today. Up to this point in technology, there have been several key differences separating Solid State Drives from magnetic rotational Hard Disk Drives. While the DRAM-based buffer size on desktop HDDs has recently reached 64 MB and is ever-increasing, there is still a hefty delay in the initial response time. This is one key area in which flash-based Solid State Drives continually dominates because they lack moving parts to "get up to speed". However the benefits inherent to SSDs have traditionally fallen off once the throughput begins, even though data reads or writes are executed at a high constant rate whereas the HDD tapers off in performance. This makes the average transaction speed of a SSD comparable to the data burst rate mentioned in HDD tests, albeit usually lower than the HDD's speed. Comparing a Solid State Disk to a standard Hard Disk Drives is always relative; even if you're comparing the fastest rotational spindle speeds. One is going to be many times faster in response (SSDs), while the other is usually going to have higher throughput bandwidth (HDDs). Additionally, there are certain factors which can affect the results of a test which we do our best to avoid. SSD Testing DisclaimerEarly on in our SSD coverage, Benchmark Reviews published an article which detailed Solid State Drive Benchmark Performance Testing. The research and discussion that went into producing that article changed the way we now test SSD products. Our previous perceptions of this technology were lost on one particular difference: the wear leveling algorithm that makes data a moving target. Without conclusive linear bandwidth testing or some other method of total-capacity testing, our previous performance results were rough estimates at best. Our test results were obtained after each SSD had been prepared using DISKPART or Sanitary Erase tools. As a word of caution, applications such as these offer immediate but temporary restoration of original 'pristine' performance levels. In our tests, we discovered that the maximum performance results (charted) would decay as subsequent tests were performed. SSDs attached to TRIM enabled Operating Systems will benefit from continuously refreshed performance, whereas older O/S's will require a garbage collection (GC) tool to avoid 'dirty NAND' performance degradation. It's critically important to understand that no software for the Microsoft Windows platform can accurately measure SSD performance in a comparable fashion. Synthetic benchmark tools such as HD Tach and PCMark are helpful indicators, but should not be considered the ultimate determining factor. That factor should be measured in actual user experience of real-world applications. Benchmark Reviews includes both bandwidth benchmarks and application speed tests to present a conclusive measurement of product performance. Test System
Storage Hardware TestedThe following storage hardware has been used in our benchmark performance testing, and may be included in portions of this article:
Test Tools
Test Results DisclaimerThis article utilizes benchmark software tools to produce operational IOPS performance and bandwidth speed results. Each test was conducted in a specific fashion, and repeated for all products. These test results are not comparable to any other benchmark application, neither on this website or another, regardless of similar IOPS or MB/s terminology in the scores. The test results in this project are only intended to be compared to the other test results conducted in identical fashion for this article. AS-SSD BenchmarkAlex Schepeljanski of Alex Intelligent Software develops the free AS SSD Benchmark utility for testing storage devices. The AS SSD Benchmark tests sequential read and write speeds, input/output operational performance, and response times. Because this software receives frequent updates, Benchmark Reviews recommends that you compare results only within the same version family. Beginning with sequential read and write performance, the OWC Mercury Extreme Pro 6G Solid State Drive produced 503.62 MB/s read speed, and 238.51 MB/s write performance. Because this benchmark uses compressed data, sequential file transfer speeds are reported lower than with other tools using uncompressed data. For this section, we will concentrate on the operational IOPS performance using compressed data. Single-threaded 4K IOPS performance delivers 13.78 MB/s read and 64.55 MB/s write, while the 64-thread 4K reads recorded 187.41 MB/s and write performance was 191.55 MB/s.
AS-SSD 64-thread 4KB IOPS performance results are displayed in the chart below, which compares several enthusiast-level storage products currently on the market. In these 64-thread 4KB IOPS performance tests the OWC Mercury Extreme Pro 6G outperformed other SSDs and kept pace with the OCZ Vertex 3. The chart is sorted by total combined performance, which helps to illustrate which products offer the best operational input/output under load:
In the next section, Benchmark Reviews tests transfer rates using ATTO Disk Benchmark. ATTO Disk BenchmarkThe ATTO Disk Benchmark program is free, and offers a comprehensive set of test variables to work with. In terms of disk performance, it measures interface transfer rates at various intervals for a user-specified length and then reports read and write speeds for these spot-tests. There are some minor improvements made to the 2.46 version of the program that allow for test lengths up to 2GB, but all of our benchmarks are conducted with 256MB total length. ATTO Disk Benchmark requires that an active partition be set on the drive being tested. Please consider the results displayed by this benchmark to be basic bandwidth speed performance indicators.
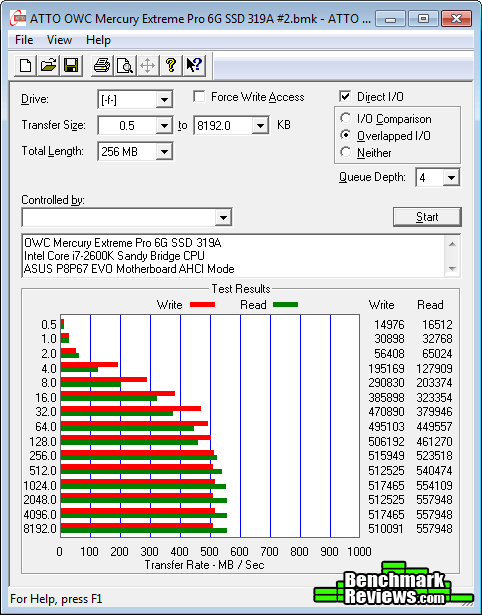
ATTO Disk Benchmark: Queue Depth 4 (Default)Our basic bandwidth speed tests begin with the OWC Mercury Extreme Pro 6G SSD attached to the Intel P67-Express SATA 6Gb/s controller operating in AHCI mode. Using the ATTO Disk Benchmark tool, the test drive performs file transfers ranging from 0.5 KB to 8192 KB. This 120GB model OWCSSDMX6G120T reveals 558 MBps maximum read speed that plateaus from 1024-8192 KB file chunks, and 517 MBps peak write bandwidth plateaus from 64-8192 KB. These results both closely maintain OWC's own specifications for the Mercury Extreme Pro 6G-series solid state drive.
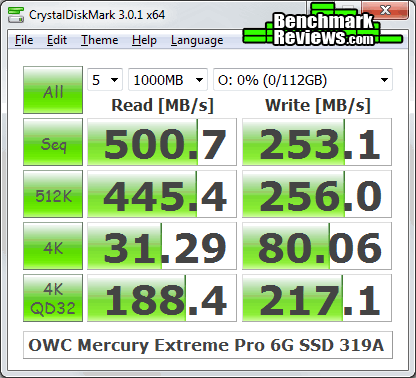
In the next section, Benchmark Reviews tests sequential performance using the CrystalDiskMark 3.0 software tool... CrystalDiskMark 3.0 TestsCrystalDiskMark 3.0 is a file transfer and operational bandwidth benchmark tool from Crystal Dew World that offers performance transfer speed results using sequential, 512KB random, and 4KB random samples. For our test results chart below, the 4KB 32-Queue Depth read and write performance was measured using a 1000MB space. CrystalDiskMark requires that an active partition be set on the drive being tested, and all drives are formatted with NTFS on the Intel P67 chipset configured to use AHCI-mode. Benchmark Reviews uses CrystalDiskMark to illustrate operational IOPS performance with multiple threads. In addition to our other tests, this benchmark allows us to determine operational bandwidth under heavy load. Each of our tests with the OWC Mercury Extreme Pro 6G Solid State Drive were consistent, and the best results obtained were used in the chart below. Because this benchmark uses compressed data, sequential file transfer (write) speeds are reported lower than with other tools using uncompressed data. CrystalDiskMark 3.0 reports sequential speeds at 500.7 MB/s read and 253.1 MB/s write. 512K results reached 445.4 MB/s read and 256.0 MB/s write performance.
For this section, we will concentrate on the operational IOPS performance using compressed data. 4K tests produced 31.29 read and 80.06 write performance. Displayed in the chart below, the maximum 4KB queue depth 32 IOPS performance results for several enthusiast-level storage products illustrate which products offer the best operation under load:
In the next section, we continue our testing using Iometer to measure input/output performance... Iometer IOPS PerformanceIometer is an I/O subsystem measurement and characterization tool for single and clustered systems. Iometer does for a computer's I/O subsystem what a dynamometer does for an engine: it measures performance under a controlled load. Iometer was originally developed by the Intel Corporation and formerly known as "Galileo". Intel has discontinued work on Iometer, and has gifted it to the Open Source Development Lab (OSDL). There is currently a new version of Iometer in beta form, which adds several new test dimensions for SSDs. Iometer is both a workload generator (that is, it performs I/O operations in order to stress the system) and a measurement tool (that is, it examines and records the performance of its I/O operations and their impact on the system). It can be configured to emulate the disk or network I/O load of any program or benchmark, or can be used to generate entirely synthetic I/O loads. It can generate and measure loads on single or multiple (networked) systems. To measure random I/O response time as well as total I/O's per second, Iometer is set to use 4KB file size chunks over a 100% random sequential distribution at a queue depth of 32 outstanding I/O's per target. The tests are given a 50% read and 50% write distribution. While this pattern may not match traditional 'server' or 'workstation' profiles, it illustrates a single point of reference relative to our product field. All of our SSD tests used Iometer 1.1.0 (build 08-Nov-2010) by Intel Corporation to measure IOPS performance, using a SandForce-created QD30 configuration: 4KB 100 Random 50-50 Read and Write.icf. The chart below illustrates combined random read and write IOPS over a 120-second Iometer test phase, where highest I/O total is preferred:
In our Iometer tests, which use 32 outstanding I/O's per target and a random 50/50 read/write distribution, SandForce SSDs generally outperform the competition when tested which a larger queue depth. The latest SATA 6Gb/s storage solutions lead the pack, and while the OCZ Vertex 3 Max IOPS Edition is on top with 83,117 IOPS. The 120GB OWC Mercury Extreme Pro 6G Solid State Drive produced 72,890 peak combined IOPS, positioned between the OCZ Vertex 3 and Agility 3. This level of I/O would certainly appeal to access-intensive computing environments, such as database transaction servers. In our next section, we test linear read and write bandwidth performance and compare its speed against several other top storage products using EVEREST Disk Benchmark. Benchmark Reviews feels that linear tests are excellent for rating SSDs, however HDDs are put at a disadvantage with these tests whenever capacity is high. EVEREST Disk BenchmarkMany enthusiasts are familiar with the Lavalys EVEREST benchmark suite, but very few are aware of the Disk Benchmark tool available inside the program. The EVEREST Disk Benchmark performs linear read and write bandwidth tests on each drive, and can be configured to use file chunk sizes up to 1MB (which speeds up testing and minimizes jitter in the waveform). Because of the full sector-by-sector nature of linear testing, Benchmark Reviews endorses this method for testing SSD products, as detailed in our Solid State Drive Benchmark Performance Testing article. However, Hard Disk Drive products suffer a lower average bandwidth as the capacity draws linear read/write speed down into the inner-portion of the disk platter. EVEREST Disk Benchmark does not require a partition to be present for testing, so all of our benchmarks are completed prior to drive formatting. Linear disk benchmarks are superior bandwidth speed tools in my opinion, because they scan from the first physical sector to the last. A side affect of many linear write-performance test tools is that the data is erased as it writes to every sector on the drive. Normally this isn't an issue, but it has been shown that partition table alignment will occasionally play a role in overall SSD performance (HDDs don't suffer this problem).
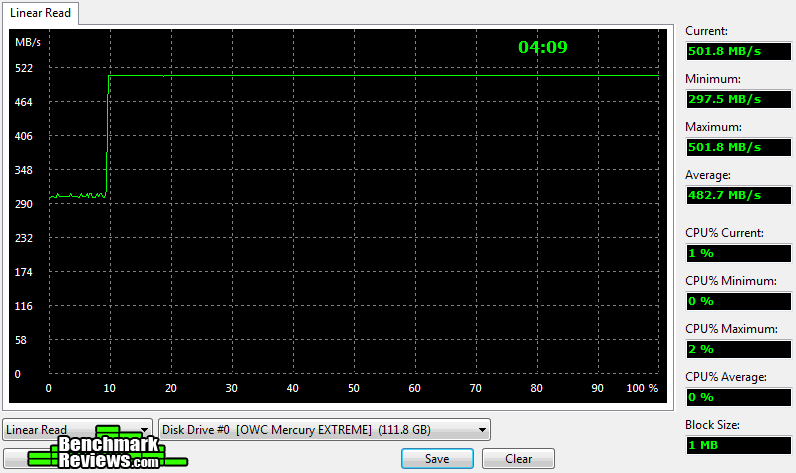
The high-performance storage products tested with EVEREST Disk Benchmark are connected to the Intel P67 SATA 6Gb/s controller and use a 1MB block size option. Read performance on the OWC Mercury Extreme Pro 6G SSD measured an average 482.7 MBps bandwidth with a relatively close maximum peak speed of 501.8 MBps. What's interesting about this test is that every Linear Read benchmark conducted with the OWC Mercury Extreme Pro 6G showed SATA-3Gb/s levels of performance for the first 10% of capacity. Everest linear write-to tests were next...
The waveform chart below illustrates how the integrated buffer manages file transfers, and makes linear write performance appears relatively even. The results seen here are still relatively consistent compared to most other SSD products we've tested in the past. The OWC Mercury Extreme Pro 6G series solid state drive recorded an average linear write-to speed of 459.7 MBps, with a maximum performance of 474.9 MBps. The chart below shows the average linear read and write bandwidth speeds for a cross-section of storage devices tested with EVEREST:
Linear tests are an important tool for comparing bandwidth speed between storage products - although HDD products suffer performance degradation over the span of their areal storage capacity. Linear bandwidth certainly benefits the Solid State Drive, since there's very little fluctuation in transfer speed. This is because Hard Disk Drive products decline in performance as the spindle reaches the inner-most sectors on the magnetic platter, away from the fast outer edge. In the next section we use PCMark Vantage to test real-world performance... PCMark Vantage HDD TestsPCMark Vantage is an objective hardware performance benchmark tool for PCs running 32- and 64-bit versions of Microsoft Windows Vista or Windows 7. PCMark Vantage is well suited for benchmarking any type of Microsoft Windows Vista/7 PC: from multimedia home entertainment systems and laptops, to dedicated workstations and high-end gaming rigs. Benchmark Reviews has decided to use the HDD Test Suite to demonstrate simulated real-world storage drive performance in this article. PCMark Vantage runs eight drive tests, each with a specific purpose. Once the benchmarking test were complete, the results are given a PCMark score while the detailed result show actual transaction speeds. The 120GB OWC Mercury Extreme Pro 6G Solid State Drive OWCSSDMX6G120T produced a total HDD Test Suite score of 48898 in PCMark Vantage:
Our tests were conducted on an Intel P67 Sandy Bridge motherboard using the onboard SATA 6Gb/s controller with 64-bit Windows 7. Results are displayed in the chart below:
In the next section I share my conclusion and share the final product rating. OWC Mercury Extreme Pro 6G Conclusion
IMPORTANT: Although the rating and final score mentioned in this conclusion are made to be as objective as possible, please be advised that every author perceives these factors differently at various points in time. While we each do our best to ensure that all aspects of the product are considered, there are often times unforeseen market conditions and manufacturer changes which occur after publication that could render our rating obsolete. Please do not base any purchase solely on our conclusion, as it represents our product rating specifically for the product tested which may differ from future versions. Benchmark Reviews begins our conclusion with a short summary for each of the areas that we rate. SandForce SSDs have taken the market by storm, which has helped companies like OWC expand their reach deep into the high-performance storage hardware segment. Not only are these SandForce-driven solid state drives extremely fast, but more importantly they're capable of SLC-level operational performance I/O and NAND durability. The OWC Mercury Extreme Pro 6G SSD builds from the powerful SandForce SF-2281 solid state processor, which brings innovation to the SSD industry by prolonging MLC NAND flash module lifetime and delivering RAID-like data redundancy. When one SandForce product is physically identical to another, the overall value depends on price, warranty, and customer support. If you're price shopping, a quick stroll through our Storage Section reviews will reveal how other SSD options compare. Our performance rating considers how effective the OWC Mercury Extreme Pro 6G solid state drive performs in operations against direct competitor storage solutions. For reference, SandForce specifies the SF-2281 with 500 MB/s read and write, which OWC increases to a very specific 559 MB/s read and 527 write maximum speed for the OWCSSDMX6G120T model. In our storage benchmark tests, the 120GB OWC Mercury Extreme Pro 6G performed at this speed, and surpassed several other SATA-based SSD's. Our test results proved the OWC Mercury Extreme Pro 6G SSD was good for delivering 558/517 MBps peak read and writes speeds using ATTO Disk Benchmark SSD speed tests. Everest Disk Benchmark produced 483/460 MBps. The OWC Mercury Extreme Pro 6G SSD SSD sent to us for testing is advertised to deliver 60,000 maximum combined IOPS; although it is unclear what tools and configuration were used to produce this particular figure. Using a SandForce-provided configuration for our own Iometer operational performance tests, we used a queue depth of 32 outstanding I/O's per target that measured 72,890 combined IOPS performance... nearly 13,000 IOPS beyond what's promised. In this test, the formatted OWC Mercury Extreme Pro 6G SSD outperformed several other SandForce SF-2200 products, and competed directly against the OCZ Vertex 3. In the 4K 32QD tests with AS-SSD and CrystalDiskMark, the OWC Mercury Extreme Pro 6G continued to surpass most other competing SSD storage solutions and kept pace with SandForce SF-2281 products. Solid State Drives are low-visibility products: you see them just long enough to install and then they're forgotten. Not unlike their Hard Disk Drive counterparts, Solid State Drives are meant to put function before fashion. For most, anything above and beyond a simple metal shell is already more than what's expected in terms of the appearance. Keeping with their previous designs and offering a swift departure from the mundane black finish of other manufacturers, OWC uses a blue anodized aluminum finish of their eye-catching Mercury Extreme Pro 6G series. As solid state storage controllers become faster and more advanced, heat dissipation through the enclosure walls may demand that chassis designs become more beneficial than they previously needed to be. This isn't the case yet, and a metal chassis suits SandForce SSDs nicely. Construction is probably the strongest feature credited to any solid state product line, and the OWC Mercury Extreme Pro series is no exception. Solid State Drives are by nature immune to most abuses because of their architecture and technology, but the hard metal shell adds a superfluous level of protection. Boasting an industry-leading 5-year product warranty, the OWC Mercury Extreme Pro 6G SSD offers consumers the highest level of protection for their premium investment. If any Mercury (RE) storage product does happen to fail during the 5-year warranty period, end-users can take advantage of free tech support by calling 1-800-275-4576 in North America, or 815-338-8685 Internationally. Additionally, an advance ship option is offered for failed SSDs within the first 30-days from date of purchase. As of August 2011, the following models and prices were available:
120GB (OWCSSDMX6G120T) $280 at MacSales.com Based on the SandForce SF-2281 SSD processor, the OWC Mercury Extreme Pro 6G SSD solid state drive delivers native TRIM garbage collection and basic SMART support with impressive 558 MB/s read transfer speed and nearly 73,000 IOPS. More importantly, SandForce DuraClass technology adds their proprietary RAISE and DuraWrite features not available to other SSDs, and the end result is a product that could last up to five times longer with less wear on NAND flash modules. While the OWC Mercury Extreme Pro 6G SSD has offered impressive performance rivaling the OCZ Vertex 3 and Patriot Wildfire series, price and warranty coverage are better with the Mercury Extreme Pro 6G. So far as we can find, Other World Computing is the only SSD company willing to offer a 5-year warranty on a second-generation SandForce storage products. That makes it the OWC Mercury Extreme Pro 6G SSD a worthwhile buy for both notebook and desktop computer users, and helps earn our Golden Tachometer Award. Pros:
|
|||||||||||||||||||||||||


Comments
First, the comparison of a OWC 120GB drive to OCZ's 240GB drives.
In this class 240GB drives are always faster.
Second, by not testing (or mentioning) the OWC extreme6, you completely missed that it now uses a different Sandforce controller! It uses the 2282, and is (as of now) the only drive to do so.
From your SandForce SF-2000 Series SSD Processor Overview:
"High-IO consumer systems will be well suited for the flagship consumer SSD processor: SF-2282. The SandForce SD-2282 is virtually an eight-channel/sixteen lane enterprise drive with MLC NAND, and won't be produced in the same quantities as other controllers."
What a shame to miss such a useful and helpful opportunity.
Had OWC offer other products or capacities, we'd use them. Besides, the difference would be less than 5% max.
As OWC seems to be a very customer friendly small shop, maybe you could just ask your contact?
This is a potential major difference in hardware, as your site had highlighted in your SandForce Processor Overview.
Kudos on even having that bye the way.
Hadn't seen that elsewhere, even the SandForce site.
I'm like many, who need experts to help find the differences.
I refer to the OWC 240GB and 480GB extreme6 drives with a "-T" part number as using the 2282 controller.
The OWC 120GB extreme6 drives with a "T" part number suffix still use the 2281, as you state in the review.
I should also mention that I have both a OCZ 120GB max IOPS, a OWC 120GB extreme6, and a pair of OWC 240 extreme6 drives.
I cloned my old HD (with Intel RST 10.6) onto all four drives and ran AS SSD benches, which I'll post later.
In brief OCZ 120 max IOPS was slowest, OWC 120GB extreme6 was quite a bit faster, and a OWC 240 extreme6 flat blew the others away.
Mind, this was just a quick test of just my drive set-up, but every thing was at least equal.
I just took the SSDs as shipped, cloned a HD and ran a canned test.
My results were:
OCZ 120GB Vertex 3 MI Overall = 356
OWC 120GB Mercury Extreme6 Overall = 373
OWC 240GB Mercury Extreme6 Overall = 489
Is that much of a difference that I might notice in doing video transcoding?
Thanks