| MSI 990FXA-GD80 AM3+ Motherboard |
| Reviews - Featured Reviews: Motherboards | |||||||||||||||||||||||||||||||||||||||||||||||||||||||||||||||||||||||||||||||||||||||||||||||||||||||||||||||||||||||||||||||||||||||||||||||
| Written by David Ramsey | |||||||||||||||||||||||||||||||||||||||||||||||||||||||||||||||||||||||||||||||||||||||||||||||||||||||||||||||||||||||||||||||||||||||||||||||
| Thursday, 20 October 2011 | |||||||||||||||||||||||||||||||||||||||||||||||||||||||||||||||||||||||||||||||||||||||||||||||||||||||||||||||||||||||||||||||||||||||||||||||
MSI 990FXA-GD80 Motherboard Review
Manufacturer: Micro-Star International (MSI) Full Disclosure: The product sample used in this article has been provided by MSI. AMD's 900 series chipsets preceded the introduction of their Bulldozer processors by several months. While this chipset offers no additional functionality to non-Bulldozer CPUs, manufacturers jumped on the bandwagon anyway, perhaps because Bulldozer was expected a little sooner than it was actually released, and MSI was one of the first. Benchmark Reviews takes a look at how MSI's 990FX-GD80 motherboard works, and we even use a Bulldozer CPU.
While our recent Bulldozer FX-8150 test results may have disappointed those who were hoping for AMD to unleash a Sandy Bridge killer, there are still reasons to prefer an Bulldozer system over a Sandy Bridge system. Perhaps you like the 42 full PCI-E lanes, or the many overclocking options. AMD's backwards compatibility is much better than Intels', who (most of the time) can't even be bothered to keep the same CPU cooler mounting holes. Then there are things like the six SATA6 ports or maybe you're just an Intel-hating AMD fanboy. I can relate. And so can MSI, with their top-of-the-line 990FX motherboard. Micro-Star International is one of the top three motherboard and video card manufacturers in the world, and manufacturers a complete line of products ranging from motherboards, video cards, servers, PCs, tablets, and all-in-one computers. 990FXA-GD80 SpecificationsSpecifications supplied by MSI.
The 990FXA-GD80 looks as if it has most of the features an enthusiast would want. The AMD 990FX ChipsetOfficially, Bulldozer requires a motherboard with an AMD 9-series chipset-- that is, a 970X, 990X, or 990FX. Unofficially, several vendors have claimed they can support Bulldozer on an 800-series motherboard with a BIOS update. Although as of the time of this writing, nobody's actually shown such a BIOS, so what if any downsides there will be to an upgraded 890FX as compared to a 990FX remain unknown. AMD provides this 990FX chipset architecture diagram:
You can be forgiven for thinking it looks very similar to an 890FX chipset architecture diagram. That's quite true, and it's because there are only three differences between the 890FX and the 990FX:
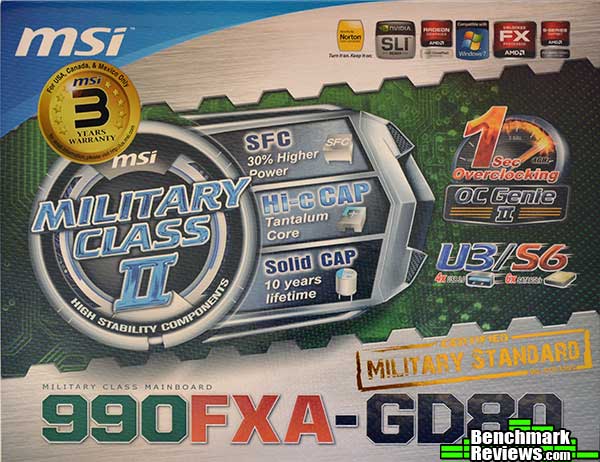
I find the last item the most interesting. NVIDIA SLI support for AMD platforms is something many enthusiasts have been wishing for, especially since the extra PCI-E lanes afforded by a 990FX system make multiple-card setups much more viable than Intel Cougar Point based systems. AMD distinguishes the three 9-series chipsets in their marketing materials by the number of graphics cards each will support: up to four for the 990FX used in the MSI 990FXA-GD80; up to two in the 990X; and one in the 970X. Actually the main difference is in the number of PCI-E lanes provided: for example, the 970X has only 16, so it actually can support a two-card CrossFireX system at 8x8. Let's take a look at this motherboard in the next section. Closer Look: MSI AM3+ motherboardThe box is MSI's now-standard semi-hologrammed glitter thing, with lots and lots of feature callouts. The three-year warranty is nice, although other companies are matching it now.
This is one of the larger accessories bundles I've seen with a motherboard; lots of manuals and guides (although the rather thin primary manual has four languages, with the result that there's really not a lot of information covered). MSI includes an I/O panel cover, three SLI bridges, 4 angled and latching SATA cables, a Molex to SATA power adapter, a USB 3.0 back panel you can plug into the motherboard header if your case doesn't have a USB 3.0 connector, and a "Certificate of Quality". Not shown is a separate little bag containing connectors into which you plug your case front panel wires, similar to the ones ASUS has had for a while. This makes wiring up the board a lot easier, since you can plug your case wires into a clearly labeled connector and then plug that assembly onto the motherboard.
The board itself uses MSI's corporate black, blue, and silver color scheme. The black CPU socket identifies it as AM3+. Personally I don't care for a PCI-E x1 slot in the first position, but that's really a matter of taste. The heat sinks over the voltage regulators and chipset are huge chunks of machined aluminum.
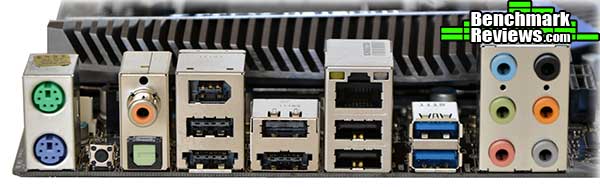
At the back we have (surprisingly, 'cause it's late 2011!) PS/2 mouse and keyhboard ports; a clear CMOS button, analog and optical audio, and FireWire, USB, eSATA, and Ethernet ports. The slightly odd appearance of a couple of the lower USB ports marks them as combination eSATA/USB ports.
These LEDs near the edge of the board, by the DIMM sockets, will illuminate in sequence as the motherboard shifts more phases to the CPU and northbridge power. Not shown are separate LEDs for the two phase RAM power. These blue LEDS are very bright.
Let's delve a little deeper into this motherboard... 990FXA-GD80 Detailed FeaturesI like POST code displays a lot better than beep codes for boot problems. Sadly, MSI doesn't list all possible POST codes in their aforementioned thin manual. What does "52" mean? I dunno; the manual doesn't list that one...but everything's working perfectly here.
As an enthusiast-level motherboard, the 990FXA-GD80 comes equipped with Start and Reset buttons, which we reviewers love because it means we don't have to connect the case wires on our test bench systems. The OC Genie button is here, too: pressing this button (it locks down) while your computer's off will apply an instant, albeit modest overclock to your system. It's nice for neophytes but experienced users will want to jump directly into the BIOS. Also visible in this shot, to the left of the buttons, are the FireWire (IEEE 1394) ports and serial port; to the right of the buttons you can see the two onboard USB 2.0 headers (four ports total). The one in red can supply extra current for charging consumer devices like an iPad.
Six SATA6 ports and a USB 3.0 header. Really, this should be standard on any motherboard these days.
I found the UEFI BIOS a little clunky. You'll never get lost because the upper status area (which occupies a third of the screen by itself) and the six giant navigation buttons at the sides are always present, relegating the content you actually want to see to the smallish center pane.
Another complaint: many BIOS settings are implemented as giant pick lists. I prefer typing in values myself, or using "+" and "-" keys, but my real problem is with the lack of information shown. For example, in this pick list of possible CPU voltages, what's the default? I can set it to AUTO, but I don't know how far I'm taking the CPU over stock unless I look up the stock voltage on Google or something. And there's nothing to indicate when I start straying into dangerous territory: voltages that would almost certainly kill the CPU in short order are in the same white-on-gray lettering as everything else. ASUS uses color coding (green, then yellow, then red) as you increase voltages, and this is something MSI should strongly consider.
But at least you have these cool power phase LEDs! 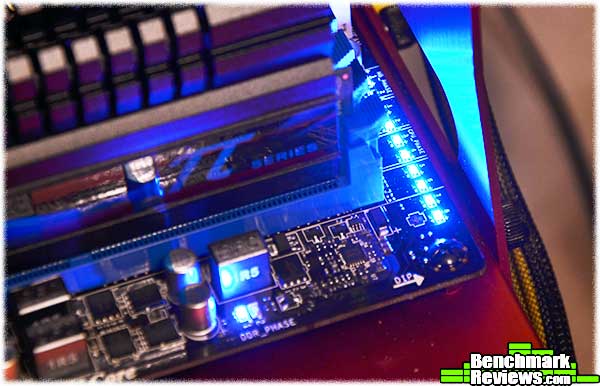
OK, let's start running some actual tests. Motherboard Testing MethodologyAMD got their 9-series chipsets out months before the Bulldozer processors that were their reason for existing, so vendors have had some time to tweak things...for Phenom II and lower processors, that is. Like most other vendors, MSI introduced a BIOS ugprade when the Bulldozer chips actually became available, and I updated the board before beginning any tests. For comparison purposes I used an ASUS Crosshair V Formula motherboard (supplied by AMD with their review FX-8150 Bulldozer CPUs), as well as an ASUS P8Z68-V Pro motherboard running an Intel Core i5 2500K processor. I also threw in a previous-generation AMD Phenom II X6 1100T. All test systems used the same memory, video card, and hard drive. The memory frequency was set to the maximum officially supported by each system: 1333MHz for the Intel system and 1866MHz for the two AMD systems. For overclocking, I simply increased the FX-8150 base multiplier and tweaked the voltage until I reached the highest setting at which the system could complete the SPECapc Lightwave benchmark. I've found this to be the best predictor of system stability: overclocks that will run under other stress tests for hours will crash in minutes under SPECapc Lightwave. In my test of the FX-8150 CPU, I only overclocked the ASUS motherboard, since that was what AMD had supplied. I was able to reach a stable 4.8GHz, but with the MSI board I could only get to 4.6GHz. 4.7GHz would run for quite a while before crashing, and 4.8 frequently wouldn't complete a boot into Windows 7, even when I raised the CPU voltage to 1.5 volts. This is a little surprising since pure multiplier overclocking isolates most of the other board components (i.e. it doesn't depend on the chipset or RAM or anything else to be able to overclock as well). I suspect the problem might be in the power circuitry: although the MSI board does have an 8-phase power system, it lacks the fine adjustments (load-line calibration and such) that the ASUS board has. The ASUS board also has an extra 4-pin EPS-12V connector in addition to its 8-pin connector, both of which I used in my ASUS overclocking tests and which might have afforded it an advantage. So here's the test lineup followed in all the charts:
Intel Z68 Test Platform
AMD 990FX Test Platforms
Benchmark Applications
AIDA64 Extreme Edition TestsAIDA64 Extreme Edition is the evolution of Lavalys' "Everest Ultimate Edition". Hungarian developer FinalWire acquired the rights to Everest in late November 2010, and renamed the product "AIDA64". The Everest product was discontinued and FinalWire is offering 1-year license keys to those with active Everest keys. AIDA64 is a full 64-bit benchmark and test suite utilizing MMX, 3DNow! and SSE instruction set extensions, and will scale up to 32 processor cores. An enhanced 64-bit System Stability Test module is also available to stress the whole system to its limits. For legacy processors all benchmarks and the System Stability Test are available in 32-bit versions as well. Additionally, AIDA64 adds new hardware to its database, including 300 solid-state drives. On top of the usual ATA auto-detect information the new SSD database enables AIDA64 to display flash memory type, controller model, physical dimensions, and data transfer performance data. AIDA64 v1.00 also implements SSD-specific SMART disk health information for Indilinx, Intel, JMicron, Samsung, and SandForce controllers. All of the benchmarks used in this test- Memory reads and writes, Queen, Photoworxx, ZLib, hash, and AES- rely on basic x86 instructions, and consume very little system memory while also being aware of Hyper-Threading, multi-processors, and multi-core processors. Of all the tests in this review, AIDA64 is the one that best isolates the processor's performance from the rest of the system. While this is useful in that it more directly compares processor performance, readers should remember that virtually no "real world" programs will mirror these results. Although I'm using the same physical memory on both the AMD and Intel systems, I'm running it at different speeds: the officially supported maximum on each platform, which is 1333MHz for the Intel Core i5 and AMD Phenom II 1100T, and DDR3-1866 for the FX-8150. Let's see how this plays out in AIDA64's memory throughput tests: 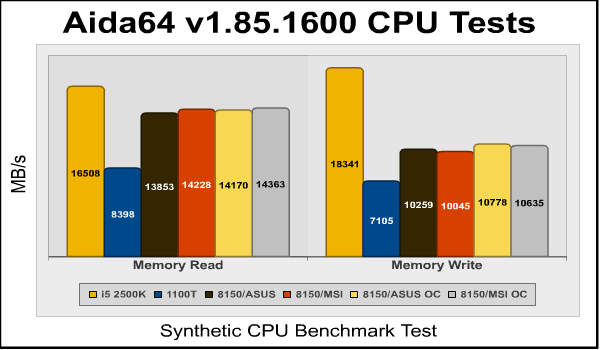
The MSI motherboard scores are, as you'd expect, very close to the ASUS motherboard scores, and both are far beyond the 1100T's scores. But the Intel 2500K system still wins by a huge margin, even with its lower memory frequency. 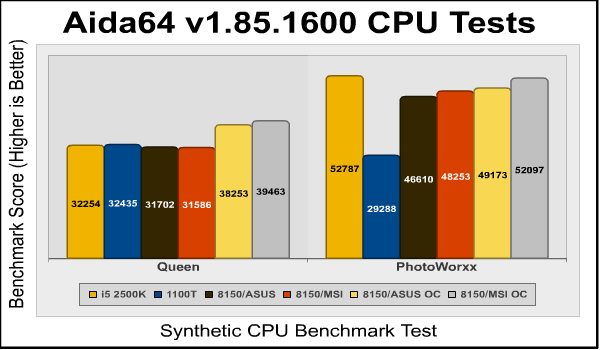
The Queen and Photoworxx tests are synthetic benchmarks that iterate the function many times and over-exaggerate what the real-world performance would be like. The Queen benchmark focuses on the branch prediction capabilities and misprediction penalties of the CPU. It does this by finding possible solutions to the classic queen problem on a chessboard. At the same clock speed theoretically the processor with the shorter pipeline and smaller misprediction penalties will attain higher benchmark scores. Like the Queen benchmark, the Photoworxx tests for penalties against pipeline architecture. The synthetic Photoworxx benchmark stresses the integer arithmetic and multiplication execution units of the CPU and also the memory subsystem. Due to the fact that this test performs high memory read/write traffic, it cannot effectively scale in situations where more than two processing threads are used, so quad-core processors with Hyper-Threading have no real advantage. The AIDIA64 Photoworxx benchmark performs the following tasks on a very large RGB image:
In the Queen test, all the processors, with their differing number of cores, different memory speeds, and different clock speeds, score about the same. The 2500K wins the Photoworxx benchmark, although not by much, while the 1100T is clearly playing out of its league. However, note something we'll be seeing a lot in this review: although I couldn't reach the same FX-8150 overclock in the MSI board that I did when it was in the ASUS board, the MSI still has slightly higher scores when overclocked. It's interesting that overclocking the FX-8150 leads to only minor Photoworxx improvements in its score in either motherboard. 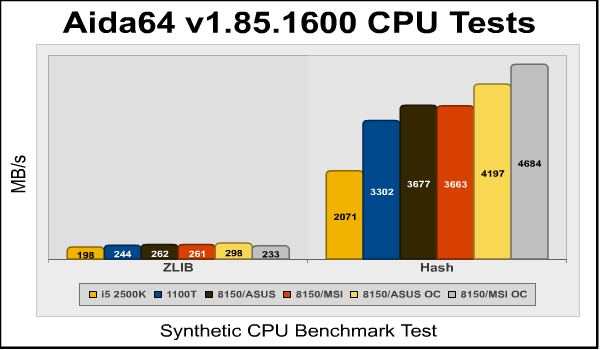
In the ZLib test, the AMD CPUs leap ahead of the Intel 2500K, with even the previous-generation 1100T beating the 2500K. In the Hash test, the difference is even more profound: the Intel CPU simply can't keep up with the AMD CPUs here. Again, note that the FX-8150 at 4.6GHz in the MSI motherboard beats the FX-8150 at 4.8GHz in the ASUS motherboard. Intel's Clarksdale and subsequent CPUs have dominated the AES test due to their Advanced Encryption Standard New Instructions (AES-NI), which dramatically accelerate AES code. AMD's own implementation of AES-NI makes its first appearance in Bulldozer-based CPUs, and in the ASUS motherboard turns in slightly better scores than the Intel CPU, although the score in the MSI motherboard is, oddly, about 11% lower. Overclocking has a minimal effect on this benchmark in either case, and the Phenom II X6-1100T, which does without AES-NI, just can't compete. 
So far, we've seen the Intel and AMD CPUs slug it out and swap wins in these tests. Let's move on to the PCMark Vantage benchmark. PCMark Vantage TestsPCMark Vantage is an objective hardware performance benchmark tool for PCs running 32- and 64-bit versions of Microsoft Windows Vista or Windows 7. It's well suited for benchmarking any type of Microsoft Windows Vista/7 PC: from multimedia home entertainment systems and laptops, to dedicated workstations and high-end gaming rigs. Benchmark Reviews has decided to use a few select tests from the suite to simulate real-world processor usage in this article. Our tests were conducted on 64-bit Windows 7, with results displayed in the chart below. TV and Movies Suite
Gaming Suite*
Music Suite
* EDITOR'S NOTE: Hopefully our readers will carefully consider how relevant PCMark Vantage is as a "real-world" benchmark, since many of the tests rely on unrelated hardware components. For example, per the FutureMark PCMark Vantage White Paper document, Gaming test #2 weighs the storage device for 100% of the test score. In fact, according to PCMark Vantage the video card only impacts 23% of the total gaming score, but the CPU represents 37% of the final score. As our tests in this article (and many others) have already proven, gaming performance has a lot more to do with the GPU than the CPU, and especially more than the hard drive or SSD (which is worth 38% of the final gaming performance score). 
The TV and Movies suite concentrates on video playback and transcoding, but only uses two threads at a maximum, so the extra cores of the AMD processors shouldn't be an advantage, and as we can see from the results, they're not. The Gaming benchmark relies on the hard disk and video card for over 50% of its score (see the Editor's Note above), and we're using the same HDD and video card for all platforms, so the Intel processor's decisive win in this test simply means that Vantage's gaming code is more optimized for Intel processors. Bear in mind, however, that most "real world" games will not show this difference; generally, in games, your video card matters most, followed by the clock speed (not number of cores) of your processor. The PCMark Vantage gaming test can use up to 16 threads, so it's very strange that the eight core FX-8150 turns in markedly lower scores than the six core 1100T. Unlike the Gaming test, the Music test results have more real-world relevance, since multi-threading is much more common in music transcoding applications than it is in games. Even so, the four core Intel CPU beats the six and eight core AMD processors. In every one of these tests, the MSI board is slower than the ASUS board, albeit only by very small amounts. CINEBENCH R11.5 BenchmarksMaxon CINEBENCH is a real-world test suite that assesses the computer's performance capabilities. CINEBENCH is based on Maxon's award-winning animation software, Cinema 4D, which is used extensively by studios and production houses worldwide for 3D content creation. Maxon software has been used in blockbuster movies such as Spider-Man, Star Wars, The Chronicles of Narnia, and many more. CINEBENCH Release 11.5 includes the ability to more accurately test the industry's latest hardware, including systems with up to 64 processor threads, and the testing environment better reflects the expectations of today's production demands. A more streamlined interface makes testing systems and reading results incredibly straightforward. The CINEBENCH R11.5 test scenario comprises three tests: an OpenGL-based test that models a simple car chase, and single-core and multi-core versions of a CPU-bound computation using all of a system's processing power to render a photo-realistic 3D scene, "No Keyframes", the viral animation by AixSponza. This scene makes use of various algorithms to stress all available processor cores, and all rendering is performed by the CPU: the graphics card is not involved except as a display device. The multi-core version of the rendering benchmark uses as many cores as the processor has, including the "virtual cores" in processors that support Hyper-Threading. The resulting "CineMark" is a dimensionless number only useful for comparisons with results generated from the same version of CINEBENCH. For the multi-core rendering test, we see that cores do in fact count: even the 1100T muscles past the Intel 2500K, if only by a whisker. Oddly, though, the FX-8150 scores are only fractionally higher than the 1100T scores even with their two-core advantage.
The single core rendering test sheds light on these results: the Intel CPU wins decisively, and even the 1100T beats the FX-8150. Individually, the Bulldozer's cores simply aren't as efficient at the Sandy Bridge and Thuban cores...at least in this test. CPU-Dependent 3D GamingStreet Fighter IV uses a new, built-from-scratch graphics engine that enables CAPCOM to tune the visuals and performance to fit the needs of the game, as well as run well on lower-end hardware. Although the engine is based on DX9 capabilities, it does add soft shadows, High Dynamic Range lighting, depth of field effects, and motion blur to enhance the game experience. The game is multi-threaded, with rendering, audio, and file I/O all running in different threads. The development team has also worked to maintain a relatively constant CPU load in all parts of the game so that on-screen performance does not change dramatically in different game scenarios.
I ran the Street Fighter IV benchmark at its lowest resolution (640x480) with all graphical features turned down to the minimum possible settings. This makes the video card much less of a factor in the results, biasing towards processor performance. Intel wins this one, but note the MSI 990FXA-GD80's advantage over the ASUS motherboard: 11.5% better FPS at stock speeds and 12.5% better when overclocked...to a slower speed. Something's going on here. PassMark PerformanceTest 7.0The PassMark PerformanceTest allows you to objectively benchmark a PC using a variety of different speed tests and compare the results to other computers. PassMark comprises a complete suite of tests for your computer, including CPU tests, 2D and 3D graphics tests, disk tests, memory tests, and even tests to determine the speed of your system's optical drive. PassMark tests support Hyper-Threading and systems with multiple CPUs, and allow you to save benchmark results to disk (or to export them to HTML, text, GIF, and BMP formats). Knowledgeable users can use the Advanced Testing section to alter the parameters for the disk, network, graphics, multitasking, and memory tests, and created individual, customized testing suites. But for this review I used only the built-in CPU tests, which aren't configurable. The CPU tests comprise a number of different metrics. The first three I'll look at are integer performance, floating point performance, and a benchmark that finds prime numbers.
Here we see more of what we expect: Intel wins in integer horsepower, and AMD wins for floating point...and by a very large margin, with the stock-clocked 1100T even beating the overclocked 2500K. AMD's FX-8150 takes the win in the Prime Number benchmark as well. Here there's no significant difference between the ASUS and MSI AM3+ motherboards.
SSE stands for "Streaming SIMD Extensions", and are instructions that handle multiple chuncks of data per instruction (SIMD = Single Instruction Multiple Data). SSE instructions work on single-precision floating point data and are typically used in graphical computations. SSE was Intel's response to AMD's "3D Now", which itself was a response to Intel's MMX instructions. Don't you love competition? AMD's current implementation still wins in this benchmark. The Encryption benchmark has historically been AMD's to win, and AMD does dominate here as well.
The Compress and String benchmarks are both integer-based, but the FX-8150 ekes out a win in both benchmarks. Here's another performance anomaly, though: the MSI's stock-clocked score is just over 17% better than the ASUS' score in the Compress benchmark. But enough with the synthetic benchmarks; let's move onto some more real-world applications. Handbrake Media EncodingIt's a truism that consumer-level computer performance reached the "fast enough" point years ago, where increases in system performance don't make things any faster for most people. Web browsing, e-mail, word processing, and even most games won't benefit dramatically from a super-fast CPU. There are some exceptions, though, and media encoding is one of them: transcoding video, especially high-definition video, can bring the strongest system to its knees. Fortunately, media transcoding is one of those things that (depending on the design of the code, of course) that scales really well with both clock speed and the number of cores, so the more you have of both, the better your results will be. The free and open-source Handbrake 0.95 video transcoder is an example of a program that makes full use of the computational resources available. For this test I used Handbrake 0.95 to transcode a standard-definition episode of Family Guy to the "iPhone & iPod Touch" presets, and recorded the total time (in seconds) it took to transcode the video.
Handbrake is one of the best "scales with number of cores" benchmarks out there, but AMD's win is by a pretty thin margin. Here the ASUS and MSI boards are virtually equal at both stock and overclocked speeds. x264 HD Benchmark 3.19Tech ARP's x264 HD Benchmark comprises the Avisynth video scripting engine, an x264 encoder, a sample 720P video file, and a script file that actually runs the benchmark. The script invokes four two-pass encoding runs and reports the average frames per second encoded as a result. The script file is a simple batch file, so you could edit the encoding parameters if you were interested, although your results wouldn't then be comparable to others.
The 2500K wins here, but what's really strange is that the six core 1100T and eight core FX-8150 return identical scores. I'd guess this part of the benchmark only uses a fixed number of threads, and that that number is less than eight. 
The AMD procs jump into the lead here, and the eight core FX-8150 has a noticeable advantage over the six core 1100T. The MSI motherboard posts a slight performance win over the ASUS motherboard. SPECviewperf 11 testsThe Standard Performance Evaluation Corporation is "...a non-profit corporation formed to establish, maintain and endorse a standardized set of relevant benchmarks that can be applied to the newest generation of high-performance computers." Their free SPECviewperf benchmark incorporates code and tests contributed by several other companies and is designed to stress computers in a reproducible way. SPECviewperf 11 was released in June 2010 and incorporates an expanded range of capabilities and tests. Note that results from previous versions of SPECviewperf cannot be compared with results from the latest version, as even benchmarks with the same name have been updated with new code and models. SPECviewperf comprises test code from several vendors of professional graphics modeling, rendering, and visualization software. Most of the tests emphasize the CPU over the graphics card, and have between 5 and 13 sub-sections. For this review I ran the Lightwave, Maya, and Seimens Teamcenter Visualization tests. Results are reported as abstract scores, with higher being better. LightwaveThe lightwave-01 viewset was created from traces of the graphics workloads generated by the SPECapc for Lightwave 9.6 benchmark. The models for this viewset range in size from 2.5 to 6 million vertices, with heavy use of vertex buffer objects (VBOs) mixed with immediate mode. GLSL shaders are used throughout the tests. Applications represented by the viewset include 3D character animation, architectural review, and industrial design. MayaThe maya-03 viewset was created from traces of the graphics workload generated by the SPECapc for Maya 2009 benchmark. The models used in the tests range in size from 6 to 66 million vertices, and are tested with and without vertex and fragment shaders. State changes such as those executed by the application- including matrix, material, light and line-stipple changes- are included throughout the rendering of the models. All state changes are derived from a trace of the running application. Siemens Teamcenter Visualization MockupThe tcvis-02 viewset is based on traces of the Siemens Teamcenter Visualization Mockup application (also known as VisMockup) used for visual simulation. Models range from 10 to 22 million vertices and incorporate vertex arrays and fixed-function lighting. State changes such as those executed by the application- including matrix, material, light and line-stipple changes- are included throughout the rendering of the model. All state changes are derived from a trace of the running application.
The SPECviewperf suite is a good example of a real-world test of applications that would normally be the province of a high-end workstation: the individual tests comprise code and models from real applications, running scripts that do real work. The 2500K wins decisively here, turning in scores that, at stock clocks, are 20% better than the stock-clocked FX-8150 in Lightwave, 53% better in Maya, and 47% better in Teamcenter Visualization. Overclocking brings the AMD processor close to the stock-clocked Intel score, but an overclocked 2500K (see our AMD Bulldozer review for details) would win here. SPECapc LightwaveSPECapc (Application Performance Characterization) tests are fundamentally different from the SPECviewperf tests. While SPECviewperf tests incorporate code from the various test programs directly into the benchmark, the SPECapc tests are separate scripts and datasets that are run against a stand-alone installation of the program being benchmarked. SPECapc group members sponsor applications and work with end-users, user groups, publications and ISVs to select and refine workloads, which consist of data sets and benchmark script files. Workloads are determined by end-users and ISVs, not SPECapc group members. These workloads will evolve over time in conjunction with end-users' needs and the increasing functionality of PCs and workstations. For this test, I ran the SPECapc "Lightwave" benchmark against a trial installation of Newtek's Lightwave 3D product. The benchmark, developed in cooperation with NewTek, provides realistic workloads that simulate a typical LightWave 3D workflow. It contains 11 datasets ranging from 64,000 to 1.75 million polygons and representing such applications as 3D character animation, architectural review, and industrial design. Scores for individual workloads are composited under three categories: interactive, render and multitask. The benchmark puts special emphasis on processes that benefit from multi-threaded computing, such as animation, OpenGL playback, deformations, and high-end rendering that includes ray tracing, radiosity, complex textures and volumetric lighting. The test reports three scores: Animation (multitasking), Animation (interactive), and Rendering. The numeric scores represent the time it took to complete each section of the benchmark, in seconds, so lower scores are better. I've found the SPECapc Lightwave 3D test to be an excellent indicator of overclock stability. In many cases, overclocked systems that will make it through every other benchmark here will crash in this test. 
Now, these results are interesting, and also show how much difference benchmark configuration can have on results. In the Lightwave portion of the SPECviewperf benchmark in the previous section, the Intel Core i5 2500K beat the AMD FX-8150 by about 20%. Here, however, it wins in only the Interactive section of the benchmark. In the Multitasking and Rendering section, the AMD processors win at stock clock speeds, with virtually no difference between the ASUA and MSI motherboards. BlenderBlender is an open-source, free content creation suite of 3D modeling, rendering, and animation capabilities. Originally released in 2002, it's available in versions for Mac OS X, Windows, Linux, and several Unix distributions. It supports rigid and soft-body objects and can handle the draping and animation of cloth, as well as the rendering and animation of smoke, water, and general particle handling. Our Blender test renders multiple frames of an animation of a rotating chunk of ice, with translucency and reflections. Rendering of this model uses ray-tracing algorithms and the program reports the rendering time for each of the animation's 25 frames. The results are a summation of the rendering time for all frames and the lower the score, the better. 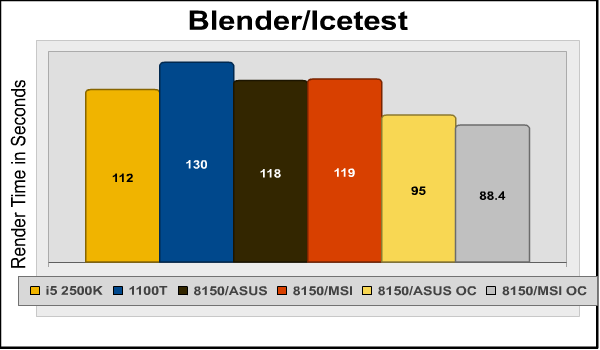
Another win for the Core i5 2500K, although by only a whisker-thin margin: 5% at stock clock speeds. The Bulldozer beats the stock-clocked 2500K when it's overclocked. POV-RayThe Persistence of Vision ray tracer is a free, open source 3D modeling program that uses ray-tracing algorithms to generate realistic three dimensional images. Ray tracing is very computationally intensive, and the POV-Ray program has a handy built-in benchmark to let you check the performance of your system. AMD wins this round, posting stock-clocked results that are 26% better than Intel, although the FX-8150's lead narrows to a mere percentage point when both processors are overclocked.
Another win for AMD, and another anomalous performance from MSI, with the 4.6GHz FX-8150 beating the 4.8GHz FX-8150...what does it mean? AM3+ Motherboard Final ThoughtsIt was strange to see the MSI motherboard post better scores than the ASUS motherboard with its CPU running at a lower clock speed. Here's a summary of the overclocked results. Remember, I was only able to get the FX-8150 running stably at 4.6GHz on the MSI 990FXA-GD80 while it was at 4.8GHz on the ASUS Crosshair V Formula:
The performance improvement when averaged isn't much, but I'm still at a loss to explain why there should be any performance improvement when running 200MHz slower. The MSI 990FXA-GD80 is a mid-level enthusiast board, which means you'll do without some of the features of the more expensive ASUS board. For example, only the CPU fan header is a 4-pin PWM header; there's no load-line voltage calibration, and so forth. But look at the performance: it's overall better than the ASUS in these tests. Sure, it's by a tiny average margin, but still.
My complaints about this board are not about the hardware (it's hard to argue with the results), but about software and documentation. The UEFI BIOS needs some usability work, especially since it makes overclocking (IMO) unnecessarily dangerous by not visually flagging dangerous voltages. Also, the manual might politely be described as "skimpy" (recall that some of the POST codes I saw aren't covered). ASUS' manual easily contains twice the information the MSI manual does. More documentation is always better. Cost of course is a factor. The ASUS Crosshair V Formula motherboard sells for $229 at Newegg.com, while the MSI 990FXA-GD80 is only $175. That $54 difference is enough for an extra 4G of enthusiast-grade memory these days, and that's something to consider carefully when you're building a system. MSI 990FXA-GD80 ConclusionA motherboard is the foundation of your rig, and thus merits the lion's share of your attention when deciding on components. If you're building a new AMD system, I think a 990FX platform is the way to go, especially for gamers: you can run any AM3 CPU in it and there are lots and lots of PCI-E lanes, so you don't have to worry about disabling a SATA6 or USB 3.0 port when you add that second or third graphics card. The performance of the MSI motherboard was excellent. I can't explain why it was often better than the ASUS motherboard, but there are the numbers, right there. Appearance is always subjective. Personally, I prefer ASUS red-and-black scheme to MSI's blue-and-black, but I'm sure there are others out there with the opposite preferences. MSI arguably goes a little overboard with the labels and silk-screen legends on its heat sinks and circuit board, but it's still a fairly handsome piece of kit. As you'd expect of any modern Taiwanese motherboard, the construction quality is excellent. And remember that MSI isn't just throwing "Military Grade" around as a marketing term: the components it brags about actually meet mil-spec standards. You give up a little hardware functionality as compared to some top-end 990FX motherboards, but the features the MSI doesn't have aren't features even most enthusiasts will miss, and there are enough extras, like a POST code display, power phase LEDs, and high-current USB ports, to keep most hackers happy. I think MSI should spend some more time on their BIOS and manuals, though, as both of these items impact the user experience with the motherboard. Value-wise, this is a hard board to beat: AMD's top-end chipset, a smattering of enthusiast features, and great performance, all for well under a mere $174.99. Sounds like a deal to me! Pros:
|
|||||||||||||||||||||||||||||||||||||||||||||||||||||||||||||||||||||||||||||||||||||||||||||||||||||||||||||||||||||||||||||||||||||||||||||||


Comments
Hmm. Does this board do that much better? Perhaps the higher end MSI boards are worth taking a look at.
Tell that to RTS/MMO gamers!
I find all this Military spec rubbish fairly annoying, can see that it has at least an element of truth behind it, but it's still grade A marketing bollocks.
I was one of 'them' who rolled the dice and invested in the BD platform a few months ago with a 990-UD7 and have a tin can of 8150 myself. I am hearing the "no BIOS" howl from the owners of the supposedly backwards compatible 890 crowd. are you suspecting as I am that the same power stability you ran into here is what the holdup is with the 890 chipset boards? One of the stated differences between the 990's and the 890's is supposedly a beefier VRM. and they need it...I think the lights on my block dim when I load it up.
I turned the processor up to 3700 mhz and the vid card to 835 mhz and it now runs around 83F under normal load and rarely goes over 101F when I game. I run the vid card @ 840 mhz when gaming.
That seems to be the sweet spot for this setup. Cool and quiet.
Thanks for your time!