3TB Seagate Barracuda XT ST33000651AS Review
Manufacturer: Seagate Technology LLC
Product Name: Barracuda XT Hard Disk Drive
Model Number: ST33000651AS
Price As Tested:$239.99 at Newegg and other Online Merchants
Full Disclosure: The product sample used in this article has been provided by Seagate.
Everyone knows that SSDs cannot offer the capacity of a hard drive, and HDDs will never deliver solid state response time. Somewhere between the speed of Solid State Drive technology and the reliability of value-priced Hard Disk storage is the Seagate Barracuda XT. The Seagate Barracuda XT series is designed for performance computer enthusiasts, as well as large-capacity storage systems. Enthusiast tools such as the free Seagate SeaTools software allows users to custom-define firmware parameters to enable performance features such as 'Short Stroke' and noise reduction. Featuring the industry's largest 3TB capacity and third-generation SATA 6Gb/s controller interface, the Seagate Barracuda XT is also the first product to create a Windows XP-safe software solution for overcoming the 2TB barrier. In this article, Benchmark Reviews tests the 3TB Seagate Barracuda XT hard drive, model ST33000651AS, against a cross-section of competing storage products using the native SATA-III controller present on the Intel P67 platform.
Back on 21 September 2009, Seagate Technology was the first manufacturer to offer a SATA 6Gb/s (aka SATA-III) hard drive product with the industry's largest 64MB cache buffer. At its time, the 2TB Seagate Barracuda XT ST32000641AS was an impressive leap for high-density mechanical storage devices; primarily because it offered tremendous capacity along side commendable performance levels. Launching just over a year later, the 3TB version offers all of the same benefits of that made the series popular, but improves transfer speed performance while including free software to take Seagate drives beyond the 2TB limitation. Early adopters of the SATA 6Gb/s interface will appreciate the high-bandwidth transfer speeds that all high-capacity Seagate Barracuda XT-series storage solutions provide. Seagate has pleased enthusiasts and gamers with a 64MB cache buffer; the largest DRAM buffer on any commercial hard drive on the consumer market.
But while both versions of the drive share similarities, there have also been a few industry changes since the 2TB Barracuda XT was originally unveiled. At its launch, the Seagate ST32000641AS sold for roughly $0.16 per gigabyte of storage. Now beefed up a fifth storage platter to reach 3TB, the Seagate Barracuda XT ST33000651AS sells for $.08 per gigabyte of storage. Both continue to share a 368 Gb/square inch aerial density with 512 Bytes per sector, but differ in their energy usage. The 2TB Barracuda XT requires 2.8A of power at startup, whereas the new 3TB model uses only 2A of startup current. Combined improvements to burst rate and sustained bandwidth will mark a substantial improvement to the design of Hard Disk Drive (HDD) storage products, and could give Solid State Drive (SSD) components serious competition.

What to expect from SATA 6Gb/s hard drives:
-
Not an immediate and dramatic across the board performance change.
-
Cache efficient and intensive applications will see immediate benefit.
-
Application optimization, controller, driver and OS optimization and areal density and other pending HDD technology will combine to push performance higher over the next 2-3 years.
Barracuda XT Features
The new Barracuda XT hard drive from Seagate delivers the industry's first 3TB desktop drive with a comprehensive, non-hardware solution to access the entire 3TB of data, even on legacy systems. Utilizing new features within the free Seagate Disc Wizard software, Barracuda XT users can now deploy 3TB of storage on legacy systems using Windows XP and PC BIOS systems or on newer Windows systems and systems equipped with new UEFI BIOS.
-
Maximize your system performance with the industry's biggest cache available-64 MB.
-
Future-proof your storage with the SATA 6Gb/s interface, which is fully compatible with legacy SATA controllers while also providing an upgrade path to a host of new SATA 6Gb/s motherboards and hard drive controllers.
-
Backed by the Seagate 5-Year Limited Warranty and boasting a massive 2 TB of storage capacity, you can rest easy knowing your Barracuda XT hard drive will provide you with more than ample space and years of worry-free operation.
Key Advantages
- Massive 3TB and 2TB capacity options provide plenty of room for downloading today's storage-craving PC games or storing many hours of high-definition video content.
- The first comprehensive, non-hardware solution to accessing 3TB of capacity by using Seagate DiscWizard software.
- The 7200-RPM performance platform complements high capacity, delivering a powerful combination of extreme storage and top-end desktop performance.
- A 64MB caches optimizes burst performance and reduces data throughput bottlenecks.
- The SATA 6Gb/s interface enables the use of the industry's newest and fastest hard drive controllers while providing backward compatibility to legacy SATA 1.5Gb/s or 3Gb/s systems.
Best-Fit Applications
- High-performance PC gaming systems
- High-definition video editing and production systems
- Home servers and workstations
- Desktop RAID
- Firewire 800- or eSATA-enabled external storage devices
ST33000651AS Specifications
-
Model Number: ST33000651AS
-
Interface Options: SATA 6Gb/s NCQ
-
Transfer Rate: Max Ext (MB/s) 600
-
Sustained Data Rate: OD (MB/s) 149
-
Cache (MB): 64
-
Average Latency (ms): 4.16
-
Spindle Speed (RPM): 7200
-
Heads/Disks: 10/5
-
Bytes per Sector: 512
-
Load/Unload Cycles: 300K
-
Nonrecoverable Read Errors per Bits Read: Max 1 per 10E14
-
Annualized Failure Rate: 0.34%
-
Mean Time Between Failures (hours): 750,000
-
Limited Warranty (years): 5
-
Startup Current +12 Peak (A, ±10%): 2.0
- Idle, Average (W): 7.37
-
Operating Temperature (°C): -5 to 60
-
Nonoperating Temperature (°C): -40 to 70
-
2 ms Operating Shock (Gs): 63
-
2 ms Nonoperating Shock (Gs): 300
-
Idle Acoustics (bels - sound power): 2.8
-
Seek Acoustics (bels - sound power): 3.2
-
Physical Height (in/mm) 1.028/26.1
-
Physical Width (in/mm) 4.00/101.6
-
Physical Depth (in/mm) 5.787/146.99
-
Physical Weight (lb/kg) 1.543/700
Source: Seagate Technology LLC
Drive Testing Methodology
Comparing a Solid State Disk to a standard Hard Disk Drives is always relative; even when you're comparing the fastest rotational spindle speeds. One is going to be much faster in response time (SSD's), while the other is usually going to have higher throughput bandwidth (HDD's). Additionally, there are certain factors which can affect the results of a test which we do our best to avoid.
There are various methods of overcoming the 2.2 TB storage barrier, however this article focuses on Microsoft Windows installations. Any hard drive initialized with a MBR (master boot record) will not see more than 2.19 TB. However, if initialized using a GPD (GUID Partition Table), which is available in Windows 7, it will see more than 2.2 TB.
Solid State Drives have traveled a long winding course to finally get where they are today. Up to this point in technology, there have been several key differences separating Solid State Drives from magnetic rotational Hard Disk Drives. While the DRAM-based buffer size on desktop HDD's has now reached 64 MB and is ever-increasing, there is still a hefty delay in the initial response time. This is one key area in which flash-based Solid State Drives continually dominates because they lack moving parts to "get up to speed".
However the benefits inherent to SSD's have traditionally fallen off once the throughput begins, even though data reads or writes are executed at a high constant rate whereas the HDD tapers off in performance. This makes the average transaction speed of a SSD comparable to the data burst rate mentioned in HDD tests, albeit usually lower than the HDD's speed.
SSD Testing Disclaimer
Early on in our SSD coverage, Benchmark Reviews published an article which detailed Solid State Drive Benchmark Performance Testing. The research and discussion that went into producing that article changed the way we now test SSD products. Our previous perceptions of this technology were lost on one particular difference: the wear leveling algorithm that makes data a moving target. Without conclusive linear bandwidth testing or some other method of total-capacity testing, our previous performance results were rough estimates at best.
Our test results were obtained after each SSD had been prepared using DISKPART or Sanitary Erase tools. As a word of caution, applications such as these offer immediate but temporary restoration of original 'pristine' performance levels. In our tests, we discovered that the maximum performance results (charted) would decay as subsequent tests were performed. SSDs attached to TRIM enabled Operating Systems will benefit from continuously refreshed performance, whereas older O/S's will require a garbage collection (GC) tool to avoid 'dirty NAND' performance degradation.
It's critically important to understand that no software for the Microsoft Windows platform can accurately measure SSD performance in a comparable fashion. Synthetic benchmark tools such as HD Tach and PCMark are helpful indicators, but should not be considered the ultimate determining factor. That factor should be measured in actual user experience of real-world applications. Benchmark Reviews includes both bandwidth benchmarks and application speed tests to present a conclusive measurement of product performance.
SSD Testing Methodology
Solid State Drives have traveled a long winding course to finally get where they are today. Up to this point in technology, there have been several key differences separating Solid State Drives from magnetic rotational Hard Disk Drives. While the DRAM-based buffer size on desktop HDDs has recently reached 64 MB and is ever-increasing, there is still a hefty delay in the initial response time. This is one key area in which flash-based Solid State Drives continually dominates because they lack moving parts to "get up to speed".
However the benefits inherent to SSDs have traditionally fallen off once the throughput begins, even though data reads or writes are executed at a high constant rate whereas the HDD tapers off in performance. This makes the average transaction speed of a SSD comparable to the data burst rate mentioned in HDD tests, albeit usually lower than the HDD's speed.
Comparing a Solid State Disk to standard Hard Disk Drives is always relative; even if you're comparing the fastest rotational spindle speeds. One is going to be many times faster in response (SSDs), while the other is usually going to have higher throughput bandwidth (HDDs). Additionally, there are certain factors which can affect the results of a test which we do our best to avoid.
Test System
- Motherboard: Gigabyte GA-X58A-UD7 (Intel X58-Express)
- Processor: Intel Core i7-920 BX80601920 @ 2.667 GHz
- System Memory: 6GB Triple-Channel DDR3 1600MHz CL6-6-6-18
- SATA 3Gb/s Storage HBA: Integrated Intel ICH10R Controller
- AHCI mode - Intel Rapid Storage Technology Driver 10.1.0.1008
- SATA 6Gb/s Storage HBA: Integrated Marvell SE9128 Controller
- AHCI mode - Marvell Magni Driver Marvell Magni Driver 1.0.0.1036
- Operating System: Microsoft Windows 7 Ultimate Edition 64-Bit
Storage Hardware Tested
The following storage hardware has been used in our benchmark performance testing, and may be included in portions of this article:
Test Tools
- AS SSD Benchmark 1.5.3784.37609: Multi-purpose speed and operational performance test
- ATTO Disk Benchmark 2.46: Spot-tests static file size chunks for basic I/O bandwidth
- Iometer 2008.06.28 by Intel Corporation: Tests IOPS performance and I/O response time
- Lavalys EVEREST Ultimate Edition 5.50: Disk Benchmark component tests linear read and write bandwidth speeds
- CrystalDiskMark 3.0.0 by Crystal Dew World: Sequential speed benchmark spot-tests various file size chunks
Test Results Disclaimer
This article utilizes benchmark software tools to produce operational IOPS performance and bandwidth speed results. Each test was conducted in a specific fashion, and repeated for all products. These test results are not comparable to any other benchmark application, neither on this website or another, regardless of similar IOPS or MB/s terminology in the scores. The test results in this project are only intended to be compared to the other test results conducted in identical fashion for this article.
Seagate Barracuda XT: SATA 3G vs 6G
This section illustrates how the Seagate Barracuda XT-series hard disk drive performs on various SATA interfaces, and what difference exists between them. When Benchmark Reviews first discussed the upcoming SATA 6Gb/s hard drive in our Seagate Barracuda XT Preview, I can honestly say that my expectations were optimistic. After all, it seemed that a 64MB cache buffer could really improve performance of this 7200 RPM disk, and designing it to be compliant with the third generation SATA specification was only going to raise the headroom for potential bandwidth speed. Being optimistic is very different from being convinced, and speculation doesn't offer the insight that benchmark performance tests can. In this section, Benchmark Reviews tests the Seagate Barracuda XT SATA 6Gb/s hard drive on three different platforms using the 2TB version of Seagate's Barracuda XT hard drive. Performance characteristics are comparable to the 3TB version.
To help compare and contrast performance differences, we've used three different test systems. All three have Intel's ICH10 Southbridge in common, a chip with a long driver development history that allows 3.0 Gb/s bandwidth throughput. The ASUS P7P55D Premium uses the Marvell 88SE9123 controller and the Gigabyte GA-P55A-UD6 motherboards utilizes a Marvell 88SE9128 SATA 6Gb/s controller. With the processor and memory matched as closely as possible between platforms, our test results should be as accurate as possible. On the ASUS and Gigabyte P55 motherboards our test performance on the ICH10 chipset was identical, so that specific test (labeled Intel P55/ICH10) is manufacturer non-specific.

Observing 4KB IOPS performance over four different SATA controllers, the Seagate Barracuda XT offered very little difference between them all. The ST32000641AS SATA 6Gb/s hard drive did perform well enough compared to other HDD storage devices, but it didn't seem to matter whether it was connected to SATA 3GBps or SATA 6Gb/s.

Switching to bandwidth speed tests didn't reveal anything new, and the difference between SATA controllers was almost irrelevant. As far as the Seagate Barracuda XT is concerned, this is good news. However, to add a little interest (and introduce our Marvell SATA-6G SSD Performance vs Intel ICH10 side piece that spawned from our tests), Benchmark Reviews offers the performance results of the OCZ Agility OCZSSD2-1AGT120G Solid State Drive while connected to each SATA controller.

The OCZ Agility is a MLC Solid State Drive based on the Indilinx 'Barefoot' controller, and is one of the most affordable high-performance SSDs currently on the market. Testing 4KB IOPS performance across four difference chipsets showed just how far Intel has come with their driver optimizations, and how far Marvell still needs to go. In the chart above, the OCZ Agility SSD performs at approximately 7,200 IOPS read, and 16,000 write on either the P55 or X58 platform and using Intel's ICH10 SATA controller. Switching to either the Marvell 88SE9123 or 88SE9123 SATA 6G controllers changed the IOPS performance dramatically, and IOPS dropped to approximately 5500 read and 8600 write. This equals a 28% improvement in IOPS read performance with Intel's ICH10 over Marvell's 9128/9123 chips, and 95% increase in write operations per second.

Results in bandwidth speed tests for the Agility SSD were very similar to the IOPS benchmarks. The X58 and P55 platforms produced roughly 222 MBps reads and 165 MBps writes, all while connected to the Intel ICH10 Southbridge. In comparison, the Marvell SATA 6G controllers produced approximately 154 MBps read speed, and 106 MBps write. This results in a 42% advantage for the ICH10 SATA 3G controller over Marvell's 9123/9128 SATA 6G controller in read speed, and a 55% advantage in write-to performance. Why, you might ask? It's all in the driver.
You see, Intel's ICH9 and ICH10 chips utilize a driver architecture that creates a virtual RAM-disk buffer for cached transactions. The amount of RAM-disk created depends on the chip and available system memory (which we detail in our spin-off article), but the combined driver refinement and memory cache capability lead to very high performance. This is where Marvell needs to grow, and do more than a simple reverse engineering Intel's work in creating their own driver.
Drive Hardware Tested
AS-SSD Benchmark
Alex Schepeljanski of Alex Intelligent Software develops the free AS SSD Benchmark utility for testing storage devices. The AS SSD Benchmark tests sequential read and write speeds, input/output operational performance, and response times. Because this software receives frequent updates, Benchmark Reviews recommends that you compare results only within the same version family.
Beginning with sequential read and write performance, the 3TB Seagate Barracuda XT hard drive produced 157 MB/s read speed, and 156 MB/s write performance. Single-threaded 4K IOPS performance delivers 0.68 MB/s read and 1.39 MB/s write, while the 64-thread 4K reads recorded 1.85 MB/s and write performance was 1.27 MB/s. These results fall well-below those of any solid state drive, but theye actually compare well against other mechanical storage products.

Displayed in the chart below, the 64-thread 4KB IOPS performance results for several enthusiast-level storage products helps to illustrate which products offer the best operational input/output under load:

In the next section, Benchmark Reviews tests transfer rates using ATTO Disk Benchmark.
ATTO Disk Benchmark
The ATTO Disk Benchmark program is free, and offers a comprehensive set of test variables to work with. In terms of disk performance, it measures interface transfer rates at various intervals for a user-specified length and then reports read and write speeds for these spot-tests. There are some minor improvements made to the 2.46 version of the program that allow for test lengths up to 2GB, but all of our benchmarks are conducted with 256MB total length. ATTO Disk Benchmark requires that an active partition be set on the drive being tested. Please consider the results displayed by this benchmark to be basic bandwidth speed performance indicators.

Our basic bandwidth speed tests begin with the 3TB Seagate Barracuda XT connected to the Intel ICH10 controller in AHCI mode, as the ATTO Disk Benchmark tools performs file transfers ranging from 0.5 KB to 8192 KB. The ST33000651AS model we received reveals 108 MBps maximum read speed that plateaus from 8.0-8192 KB file chunks, and 108 MBps peak write bandwidth plateaus from 8.0-8192 KB.

In the next section, Benchmark Reviews tests sequential performance using the CrystalDiskMark 3.0 software tool...
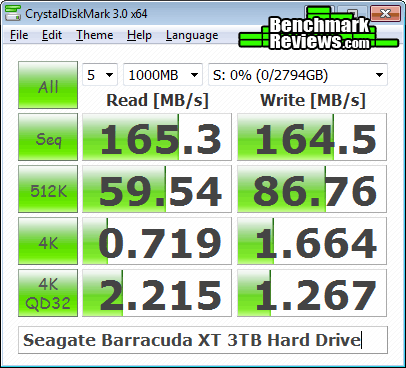
CrystalDiskMark 3.0 Tests
CrystalDiskMark 3.0 is a file transfer and operational bandwidth benchmark tool from Crystal Dew World that offers performance transfer speed results using sequential, 512KB random, and 4KB random samples. For our test results chart below, the 4KB 32-Queue Depth read and write performance was measured using a 1000MB space. CrystalDiskMark requires that an active partition be set on the drive being tested, and all drives are formatted with NTFS on the Intel ICH10 controller set to AHCI-mode. Benchmark Reviews uses CrystalDiskMark to illustrate operational IOPS performance with multiple threads. In addition to our other tests, this benchmark allows us to determine operational bandwidth under heavy load.
Each of our tests with the 3TB Seagate Barracuda XT hard drive were consistent, but only the best test result speeds were charted below. Sequential tests on this mechanical storage device produced a maximum read speed of 165 MB/s, while the write speed was also 165 MB/s. CrystalDiskMark 3.0 reported 512K results of 59.54 MB/s read and 86.76 MB/s write performance, which actually outperforms a few of the latest SSDs. 4K tests produced only 0.719 read and 1.664 write performance. 4KB queue depth 32 IOPS is one area where SSDs truly excel, and HDDs do not.
Displayed in the chart below, the maximum 4KB queue depth 32 IOPS performance results for several enthusiast-level storage products illustrate which products offer the best operation under load:

Iometer IOPS Performance
Iometer is an I/O subsystem measurement and characterization tool for single and clustered systems. Iometer does for a computer's I/O subsystem what a dynamometer does for an engine: it measures performance under a controlled load. Iometer was originally developed by the Intel Corporation and formerly known as "Galileo". Intel has discontinued work on Iometer, and has gifted it to the Open Source Development Lab (OSDL). There is currently a new version of Iometer in beta form, which adds several new test dimensions for SSDs.
Iometer is both a workload generator (that is, it performs I/O operations in order to stress the system) and a measurement tool (that is, it examines and records the performance of its I/O operations and their impact on the system). It can be configured to emulate the disk or network I/O load of any program or benchmark, or can be used to generate entirely synthetic I/O loads. It can generate and measure loads on single or multiple (networked) systems.
To measure random I/O response time as well as total I/O's per second, Iometer is set to use 4KB file size chunks over a 100% random sequential distribution at a queue depth of 32 outstanding I/O's per target. The tests are given a 50% read and 50% write distribution. While this pattern may not match traditional 'server' or 'workstation' profiles, it illustrates a single point of reference relative to our product field.
The chart below illustrates combined random read and write IOPS over a 120-second Iometer test phase, where highest I/O total is preferred:

Input/Output Operations per Second benchmarks are an excellent means of comparing solid state storage devices, but since all computers make operational requests these tests extend to mechanical storage devices as well. In this test the 3TB Seagate Barracuda XT hard drive may not have kept pace with SSDs, but it managed to exceed the IOPS performance of other mechanical storage devices.
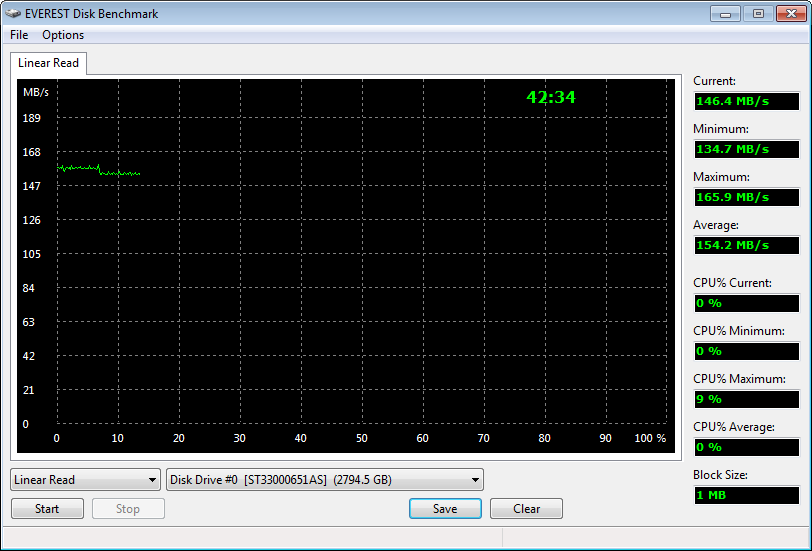
In our next section, we test linear read and write bandwidth performance and compare its speed against several other top storage products using EVEREST Disk Benchmark. Benchmark Reviews feels that linear tests are excellent for rating SSDs, however HDDs are put at a disadvantage with these tests whenever capacity is high.
Short Stroke Disk Performance
Not everyone is willing to make the leap into solid state technology, and with so many SSD failures resulting in catastrophic data loss there's still good reason to invest in a hard drive for your personal computer. Even so, there's an obvious difference in the overall performance you can expect between the two. The Seagate Barracuda XT series is designed for performance enthusiasts such as gamers, as well as small server systems. Enthusiast tools such as the free Seagate SeaTools software allows the user to custom-define firmware parameters to enable performance features such as 'Short Stroke'. With more capacity than a person might even realistically use, the 3TB Seagate Barracuda XT hard drive presents the ideal Short Stroke opportunity.
The EVEREST Disk Benchmark performs linear read and write bandwidth tests on each drive, and can be configured to use file chunk sizes up to 1MB (which speeds up testing and minimizes jitter in the waveform). Because of the full sector-by-sector nature of linear testing, mechanical storage products suffer a lower average bandwidth as the capacity draws linear read/write speed down into the inner-portion of the disk platter. In this particular example, we've demonstrated disk read/write speeds where only the outer-most portion is utilized.
All storage products tested with EVEREST Disk Benchmark are connected to the Intel ICH10 controller and use a 1MB block size option. Measuring the outer 15% of the 3TB Seagate Barracuda XT hard drive, which amounts to approximately 420 GB, the ST33000651AS model peaked at 166 MB/s read and write while averaging 154 MB/s. Partitioning the drive to use the outer portions will result in much faster performance than the inner sectors, and 154-166 MB/s is very close to the speeds of an average SSD.
Linear tests are an important tool for comparing bandwidth speed between storage products - although HDD products suffer performance degradation over the span of their areal storage capacity. Linear bandwidth certainly benefits the Solid State Drive, since there's very little fluctuation in transfer speed. This is because Hard Disk Drive products decline in performance as the spindle reaches the inner-most sectors on the magnetic platter, away from the fast outer edge.
In the next section I share my final thoughts on the struggle between SSD and HDD technology, as well as their new hybrid counterpart, before delivering my conclusion and final product rating.
Desktop Storage Final Thoughts
It's still too early to tell if or when HDDs will be replaced with SSDs, although basic wisdom indicates that both will be favored among their intended markets for a few years to come. Personally speaking, I have been a fan of SSD technology from the beginning; but even I can acquiesce to the Seagate and WD product road map for the short term future. SSDs can't possibly touch the value and capacity delivered by HDDs, and that's not something that will soon change.
There's no argument that HDDs still capture the capacity-hungry market segment; especially since SSDs cannot compete there. But the premium high-performance desktop storage enthusiast market is losing patience with Hard Disk Drive technology, and as a result those consumers are turning towards Solid State Drive technology in large numbers. This is exactly why the SATA 6Gb/s interface and 64MB cache buffer was so important to desktop storage technology, and delivered at exactly the right time. Sure, this new bump in performance will add considerable boost to the HDD market, but at the same time it's no surprise that premier names in the industry have also invested in their own SSD solutions.
Currently the Seagate SeaTools software only allows users to define a Logical Block Address (LBA) range, which can then be saved onto the drive's firmware. As of now this process requires an enthusiast to understand the total capacity of their drive in order to assign a short-stroke setting, but Seagate already has enthusiast how-to guides in the works. Taking a moment to step back and view the big picture, this could be Seagate's last stab at competing against the 10,000RPM WD VelociRaptor before launching their own SSD product line.

HDD vs Hybrid Drive vs SSD
It's been the same argument for over two years now: SSDs offer the best performance, but HDDs still offer the best capacity and price. Now that Solid State Hybrid drives are available, that argument changes. While the optimal blend of bandwidth speed, operational performance, storage capacity, and value has yet to be delivered, Seagate's Momentus-XT is an ultra-affordable start in the right direction. Admittedly, our benchmarks are a poor substitution for real-world user experience, and the Momentus-XT isn't designed to move large files at SSD speeds. Installed as a primary drive for notebook and value-conscious enthusiasts, the Seagate Momentus-XT Solid State Hybrid Drive delivers up to 500GB storage capacity while starting Windows and opening programs like an SSD.
The last days of old technology are always better than the first days of new technology. Never has this saying been more true than with the topic of storage technology, specifically in regard to the introduction of Solid State Drive technology a few years ago. The only things standing in the way of widespread Solid State Drive (SSD) adoption are high storage capacity and affordable price of Hard Disk Drive (HDD) devices. Because NAND flash-based SSD technology costs more per gigabyte of capacity than traditional magnetic hard drives, the benefits of immediate response time, transfer speeds, and operational input/output performance often get overlooked. Like most consumer products, it wasn't a question of how much improvement was evident in the new technology, it was price. I'll discuss product costs more in just a moment, but for now consider how each new series of SSD product employs greater performance than the one before it, convincing would-be consumers into waiting for the right time to buy.
There's also a gray area surrounding SSD performance benchmarks that has me concerned. You might not know this, but SSDs can be very temperamental towards the condition of their flash NAND. My experience testing dozens of Solid State Drives is that a freshly cleaned device (using an alignment tool) will always outperform the same device once it's been formatted and used. A perfect example is Indilinx Barefoot-based SSDs, which suffers severely degraded performance when writing to 'dirty' flash NAND. The reason that all of this will matter is simple: the performance results reported to consumers in product reviews (such as this one) often report the very best performance scores, and the process used to obtain these results is not applicable to real-world usage. This is where garbage collection techniques such as TRIM become important, so that end-users will experience the same performance levels as we do in our tests.
Seagate Barracuda XT Conclusion
IMPORTANT: Although the rating and final score mentioned in this conclusion are made to be as objective as possible, please be advised that every author perceives these factors differently at various points in time. While we each do our best to ensure that all aspects of the product are considered, there are often times unforeseen market conditions and manufacturer changes which occur after publication that could render our rating obsolete. Please do not base any purchase solely on our conclusion, as it represents our product rating specifically for the product tested which may differ from future versions. Benchmark Reviews begins our conclusion with a short summary for each of the areas that we rate.
Not every product we test here at Benchmark Reviews receives a warm conclusion, complete with happy ending and high recommendations. In the age of solid state drives, it's hard to find the good in mechanical storage. Fortunately, the Seagate Barracuda XT series has enough perk going for it to still earn high marks from us. Price, performance, and capacity are the biggest reasons to choose a Barracuda XT over any of the current-generation 3TB storage products. Here's what I think of the Seagate Barracuda XT hard drive, model ST33000651AS:
For a hard drive, the Barracuda XT series offers the best performance available from a 7200 RPM mechanical storage device. It's not quite as fast as the Seagate Momentus-XT Solid State Hybrid Drive, but then again that product series doesn't offer storage capacities beyond 500GB. The same is true for all modern SSDs, which outperform the Barracuda XT in terms of IOPS performance and transfer speed but fail to offer reasonable capacity. So then it seems fitting that the Barracuda XT is a solid choice for builders in need of storage space, or users wanting to short stroke the first 420GB partition for their OS and reap the rewards of using sectors located at the outer platter edges.
Touting a five-year warranty helps to position the Seagate Barracuda XT ahead of most other storage products, even though the low operational temperature and power saving rotational shut-down features may make the long-term warranty moot. Because spinning mechanical storage technology is so mature, especially from a company like Seagate, there are no issues with the Barracuda XT in terms of compatibility or firmware functionality. Seagate delivers industry-leading quality and construction in all of their products, and the high-performance/high-capacity Barracuda XT series is the end-result of years of proven industry experience.
Heading into April 2011, the Seagate Barracuda XT 3TB hard disk drive (model ST33000651AS) sells for $239.99 at Newegg and other online retailers. This works out to less than $0.08 per gigabyte of storage capacity, which is pennies on the dollar in comparison to SSD technology. In fact, at this rate a hypothetical 128GB Barracuda XT would be priced around $10 - costing only 5% the price for any solid state drive of the same capacity. For storage-hungry gamers and performance enthusiasts wanting performance and high-capacity storage, the Seagate Barracuda XT is an exceptional drive with plenty of value.
Based on the current condition of today's desktop storage market, it's still very much a hard drive friendly world. While SSD technology will eventually replace hard disk storage some day, there's no evidence as to when solid state storage can match capacity at the same price point. The 3TB Seagate Barracuda XT Hard Drive ST33000651AS resists that forthcoming change for at least a while longer, and its massive three-Terabyte capacity paired to the future-proof SATA 6Gb/s interface will certainly help punctuate this. The affordable cost to capacity ratio puts the Barracuda XT ahead of SSDs by a long-shot, while still offering respectable bandwidth performance speeds for enthusiast computer systems.
Pros:
+ Very good 162 MB/s read bandwidth with ATTO Benchmark
+ 3nd-generation SATA 6Gb/s compliant controller
+ Massive 3-Terabyte storage capacity
+ Outstanding total-package value
+ 64MB Cache buffer improves burst transactions
+ Low-power standby conserves energy
+ 5-Year Seagate product warranty
+ Additional performance available via short-stroking
Cons:
- 2.1TB Barrier not removed via native hardware instruction
Ratings:
-
Performance: 8.75
-
Appearance: 8.50
-
Construction: 9.00
-
Functionality: 9.00
-
Value: 8.50
Final Score: 8.75 out of 10.
Quality Recognition: Benchmark Reviews Silver Tachometer Award.
Questions? Comments? Benchmark Reviews really wants your feedback. We invite you to leave your remarks in our Discussion Forum.
Related Articles:
|

Comments
Also, UEFI replaced the BIOS, so a "UEFI BIOS" doesn't exist; only UEFI.