| MSI Radeon HD 7870 Hawk 2GB Video Card |
| Reviews - Featured Reviews: Video Cards | ||||||||||||||||||||||||||||||||||||||||||||||||||||||||||||||||||||||||||||||||||||||
| Written by Hank Tolman | ||||||||||||||||||||||||||||||||||||||||||||||||||||||||||||||||||||||||||||||||||||||
| Wednesday, 13 June 2012 | ||||||||||||||||||||||||||||||||||||||||||||||||||||||||||||||||||||||||||||||||||||||
MSI Radeon HD 7870 Hawk Video Card Review
Manufacturer: Micro-Star International Co. LTD
Product Name: Radeon HD R7870 Hawk 2GB Video Card
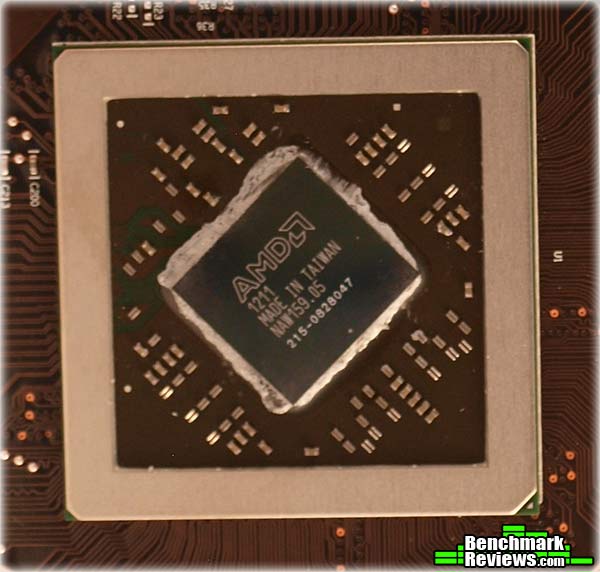
Model Number: R7870 HAWK Price As Tested: $379.99 (Amazon) Full Disclosure: The product sample used in this article has been provided by MSI. AMD's Radeon HD 7000 series is out in full force now and even with the NVIDIA 600 series launching, it's still getting a lot of attention. As is typical with video card releases, manufacturers like to make their own designs and subtle changes and release various different cards based off of the same GPU. Here at Benchmark Reviews, we've received the MSI Radeon HD R7870 Hawk video card and we are prepared to put it to the test. With an unlocked BIOS and a digital PWM, the MSI R7870 Hawk begs to be overclocked. Let's find out just how fast it can go. The Radeon HD 7800 series of video cards sports the Pitcairn GPU a scaled down version of the Tahiti GPU found in the HD 7900 series. Of course, with the scaled down GPU comes a scaled down price as well, making the HD 7800 cards a little easier on the wallet than their big brothers. The full-scaled Pitcairn GPU found in the Radeon HD 7870 cards comes equipped with 1280 Shader Units, 32 Raster Operations, about 2.8 billion Transistors, and 2GB of RAM. The GPU core is clocked at 1000 MHz and the Memory is clocked at 1200 MHz.
The MSI R7870 Hawk takes things just a little further, but doesn't change too much. It comes overclocked from the factory at 1100 MHz on the core clock. The Memory clock stays the same at 1200 MHz. The real value in the MSI R7870 Hawk, though, comes in the form of added features that enhance the card's ability to be overclocked and pushed to the limit. Follow us along inside to find out more about the R7870 Hawk's special features and to see just what they do for this card. Closer Look: MSI R7870 Hawk
|
||||||||||||||||||||||||||||||||||||||||||||||||||||||||||||||||||||||||||||||||||||||


|
Graphics Engine |
ATI Radeon HD 7870 |
|
Interface |
PCI Express x16 3.0 |
|
Memory Type |
GDDR5 |
|
Memory Size(MB) |
2048 |
|
Memory Interface |
256 bits |
|
Core Clock Speed(MHz) |
1100 |
|
Memory Clock Speed(MHz) |
4800 |
|
Memory Bandwidth(GB/sec) |
N/A |
|
Texture Fill Rate(billion/sec) |
N/A |
|
DVI Output |
1 |
|
D-SUB Output |
N/A |
|
HDMI-Output |
1 |
|
Mini HDMI-Output |
N/A |
|
DisplayPort |
N/A |
|
Mini DisplayPort |
2 |
|
TV-Output |
N/A |
|
VIVO(Video-in/out) |
N/A |
|
HDTV Support |
N/A |
|
HDCP Support |
Y |
|
HDMI Support |
Y |
|
Dual-link DVI |
Y |
|
Display Output (Max Resolution) |
2560x1600 |
|
RAMDACs |
400 |
|
DirectX Version Support |
11 |
|
OpenGL Version Support |
4.2 |
|
CrossFire Support |
Y |
|
SLI Support |
N/A |
|
3-way SLI |
N/A |
|
HyperMemory Tech. |
N/A |
|
TurboCache tech. |
N/A |
|
Card Dimension(mm) |
277 x 120 x 40.5mm |
|
Weight |
N/A |
Source: MSI.com
VGA Testing Methodology
Our site polls and statistics indicate that the over 90% of our visitors use their PC for playing video games, and practically every one of you are using a screen resolutions mentioned below. Since all of the benchmarks we use for testing represent different game engine technology and graphic rendering processes, this battery of tests will provide a diverse range of results for you to gauge performance on your own computer system. All of the benchmark applications are capable of utilizing DirectX 10 or DirectX 11, and that is how they were tested. Some of these benchmarks have been used widely for DirectX 9 testing in the XP environment, and it is critically important to differentiate between results obtained with different versions. Each game behaves differently in DX9 and DX10 formats. Crysis is an extreme example, with frame rates in DirectX 10 only about half what was available in DirectX 9.
At the start of all tests, the previous display adapter driver is uninstalled and trace components are removed using Driver Cleaner Pro. We then restart the computer system to establish our display settings and define the monitor. Once the hardware is prepared, we begin our testing. According to the Steam Hardware Survey published at the time of Windows 7 launch, the most popular gaming resolution is 1280x1024 (17-19" standard LCD monitors) closely followed by 1024x768 (15-17" standard LCD). However, because these resolutions are considered 'low' by most standards, our benchmark performance tests concentrate on the up-and-coming higher-demand resolution: 1920x1080 (24-28" widescreen LCD monitors).
Each benchmark test program begins after a system restart, and the very first result for every test will be ignored since it often only caches the test. This process proved extremely important in several benchmarks, as the first run served to cache maps allowing subsequent tests to perform much better than the first. Each test is completed five times, the high and low results are discarded, and the average of the three remaining results is displayed in our article.
A combination of synthetic and video game benchmark tests have been used in this article to illustrate relative performance among graphics solutions. Our benchmark frame rate results are not intended to represent real-world graphics performance, as this experience would change based on supporting hardware and the perception of individuals playing the video game.
Intel P67 Test System
- Motherboard: ASUS P67 Sabertooth
- Processor: Intel Core i5-2500K 3.3GHz
- System Memory: GSkill Ripjaws X Series 1600MHz (9-9-9-24)
- Primary Drive: Filemate SolidGO 60GB SSD
- Power Supply Unit: Corsair TX850W 850W 80+ Bronze Certified
DirectX-9 Benchmark Applications
- Mafia II
- Extreme Settings: (Antialiasing, 16x AF, High Shadow Quality, High Detail, High Geometry, Ambient Occlusion)
DirectX-10 Benchmark Application
- 3DMark Vantage v1.02
- Extreme Settings: (Extreme Quality, 8x Multisample Anti-Aliasing, 16x Anisotropic Filtering, 1:2 Scale)
DirectX-11 Benchmark Applications
- DIRT 2 DEMO Benchmark
- Extreme Settings: (High Quality, 8x AA, 16x AF, High DirectX 11 Features)
- Aliens vs Predator
- Extreme Settings: (High Quality, 4x AA, 16x AF, SSAO, Tessellation, Advanced Shadows)
- BattleField: Bad Company 2
- Extreme Settings: (Highest Quality, HBAO, 4x AA, 16x AF, 180s Fraps Single-Player Intro Scene)
- Lost Planet 2
- Extreme Settings: (4x MSAA, High Shadow Detail, High Texture, High Render, High DirectX 11 Features)
- Unigine Heaven Benchmark 2.5
- Extreme Settings: (High Quality, Normal Tessellation, 8x AF, 4x AA)
- 3DMark 11
- Settings: Performance Level Preset, 1280x720, 1x AA, Trilinear Filtering, Tessellation level 5)
Video Card Test Products
- MSI GeForce GTS 450 N450GTS Cyclone (850 MHz GPU/1700 MHz Shader/1000 MHz vRAM - Forceware 301.42)
- PowerColor Radeon HD 5770 PCS+ (875 MHz GPU/1225 MHz vRAM - ATI Catalyst Driver 12.4)
- EVGA GeForce GTX 460 SE 1GB (648MHz GPU/1296 MHz Shader/850 MHz vRAM - Forceware 301.42)
- VisionTek 900339 Radeon HD 6850 (775MHz GPU/1000MHz vRAM - ATI Catalyst Driver 12.4)
- MSI R6870 Hawk Radeon HD 6870 (930 MHz GPU/1050MHz vRAM - ATI Catalyst Driver 12.4)
- PNY GTX 570 1280MB VCGGTX570XPB (732MHz GPU/1464MHz Shader/950MHz vRAM - Forceware 301.42)
- EVGA GTX 560 Ti 448 Cores FTW (797MHz GPU/1594MHz Shader/975MHz vRAM - Forceware 301.42)
- MSI R7870 Hawk 2GB (1100MHz GPU/1200MHz vRAM - ATI Catalyst Driver12.4)
DX10: 3DMark Vantage
3DMark Vantage is a PC benchmark suite designed to test the DirectX10 graphics card performance. FutureMark 3DMark Vantage is the latest addition the 3DMark benchmark series built by FutureMark corporation. Although 3DMark Vantage requires NVIDIA PhysX to be installed for program operation, only the CPU/Physics test relies on this technology.
3DMark Vantage offers benchmark tests focusing on GPU, CPU, and Physics performance. Benchmark Reviews uses the two GPU-specific tests for grading video card performance: Jane Nash and New Calico. These tests isolate graphical performance, and remove processor dependence from the benchmark results.
3DMark Vantage GPU Test: Jane Nash
Of the two GPU tests 3DMark Vantage offers, the Jane Nash performance benchmark is slightly less demanding. In a short video scene the special agent escapes a secret lair by water, nearly losing her shirt in the process. Benchmark Reviews tests this DirectX-10 scene at 1920x1080 resolution, and uses Extreme quality settings with 8x anti-aliasing and 16x anisotropic filtering. The 1:2 scale is utilized, and is the highest this test allows. By maximizing the processing levels of this test, the scene creates the highest level of graphical demand possible and sorts the strong from the weak.

3DMark Vantage GPU Test: New Calico
New Calico is the second GPU test in the 3DMark Vantage test suite. Of the two GPU tests, New Calico is the most demanding. In a short video scene featuring a galactic battleground, there is a massive display of busy objects across the screen. Benchmark Reviews tests this DirectX-10 scene at 1920x1080 resolution, and uses Extreme quality settings with 8x anti-aliasing and 16x anisotropic filtering. The 1:2 scale is utilized, and is the highest this test allows. Using the highest graphics processing level available allows our test products to separate themselves and stand out (if possible).

DX9+SSAO: Mafia II
Mafia II is a single-player third-person action shooter developed by 2K Czech for 2K Games, and is the sequel to Mafia: The City of Lost Heaven released in 2002. Players assumAe the life of World War II veteran Vito Scaletta, the son of small Sicilian family who immigrates to Empire Bay. Growing up in the slums of Empire Bay teaches Vito about crime, and he's forced to join the Army in lieu of jail time. After sustaining wounds in the war, Vito returns home and quickly finds trouble as he again partners with his childhood friend and accomplice Joe Barbaro. Vito and Joe combine their passion for fame and riches to take on the city, and work their way to the top in Mafia II.
Mafia II is a DirectX 9 PC video game built on 2K Czech's proprietary Illusion game engine, which succeeds the LS3D game engine used in Mafia: The City of Lost Heaven. In our Mafia-II Video Game Performance article, Benchmark Reviews explored characters and gameplay while illustrating how well this game delivers APEX PhysX features on both AMD and NVIDIA products. Thanks to APEX PhysX extensions that can be processed by the system's CPU, Mafia II offers gamers equal access to high-detail physics regardless of video card manufacturer. Equal access is not the same thing as equal performance, though.
With PhysX technology turned off, both AMD and NVIDIA are on a level playing field in this test. In contrast to many gaming scenes, where other-worldly characters and environments allow the designers to amp up the detail, Mafia II uses human beings wearing ordinary period-correct clothes and natural scenery. Just like how high end audio equipment is easiest to judge using that most familiar of sounds - the human voice, graphics hardware is really put to the test when rendering things that we have real experience with. The drape of a woolen overcoat is a deceptively simple construct; easy to understand and implement, but very difficult to get perfect.

DX11: Aliens vs Predator
Rebellion, SEGA and Twentieth Century FOX have released the Aliens vs. Predator DirectX 11 Benchmark to the public. As with many of the already released DirectX 11 benchmarks, the Aliens vs. Predator DirectX 11 benchmark leverages your DirectX 11 hardware to provide an immersive game play experience through the use of DirectX 11 Tessellation and DirectX 11 Advanced Shadow features.
In Aliens vs. Predator, DirectX 11 Geometry Tessellation is applied in an effective manner to enhance and more accurately depict HR Giger's famous Alien design. Through the use of a variety of adaptive schemes, applying tessellation when and where it is necessary, the perfect blend of performance and visual fidelity is achieved with at most a 4% change in performance.

DirectX 11 hardware also allows for higher quality, smoother and more natural looking shadows as well. DirectX 11 Advanced Shadows allow for the rendering of high-quality shadows, with smoother, artifact-free penumbra regions, which otherwise could not be realized, again providing for a higher quality, more immersive gaming experience.
In our next section, Benchmark Reviews looks at one of the most popular games, Battlefield: Bad Company 2. The game lacks a dedicated benchmarking tool, so we'll be using FRAPS to measure frame rates within portions of the game itself.
DX11: Battlefield Bad Company 2
The Battlefield franchise has been known to demand a lot from PC graphics hardware. DICE (Digital Illusions CE) has incorporated their Frostbite-1.5 game engine with Destruction-2.0 feature set with Battlefield: Bad Company 2. Battlefield: Bad Company 2 features destructible environments using Frostbit Destruction-2.0, and adds gravitational bullet drop effects for projectiles shot from weapons at a long distance. The Frostbite-1.5 game engine used on Battlefield: Bad Company 2 consists of DirectX-10 primary graphics, with improved performance and softened dynamic shadows added for DirectX-11 users.
At the time Battlefield: Bad Company 2 was published, DICE was also working on the Frostbite-2.0 game engine. This upcoming engine will include native support for DirectX-10.1 and DirectX-11, as well as parallelized processing support for 2-8 parallel threads. This will improve performance for users with an Intel Core-i7 processor. Unfortunately, the Extreme Edition Intel Core i7-980X six-core CPU with twelve threads will not see full utilization.
In our benchmark tests of Battlefield: Bad Company 2, the first three minutes of action in the single-player raft night scene are captured with FRAPS. Relative to the online multiplayer action, these frame rate results are nearly identical to daytime maps with the same video settings. The Frostbite-1.5 game engine in Battlefield: Bad Company 2 appears to equalize our test set of video cards, and despite AMD's sponsorship of the game it still plays well using any brand of graphics card.

DX11: 3DMark 11
FutureMark 3DMark11 is the latest addition the 3DMark benchmark series built by FutureMark corporation. 3DMark11 is a PC benchmark suite designed to test the DirectX-11 graphics card performance without vendor preference. Although 3DMark11 includes the unbiased Bullet Open Source Physics Library instead of NVIDIA PhysX for the CPU/Physics tests, Benchmark Reviews concentrates on the four graphics-only tests in 3DMark11 and uses them with medium-level 'Performance' presets.

The 'Performance' level setting applies 1x multi-sample anti-aliasing and trilinear texture filtering to a 1280x720p resolution. The tessellation detail, when called upon by a test, is preset to level 5, with a maximum tessellation factor of 10. The shadow map size is limited to 5 and the shadow cascade count is set to 4, while the surface shadow sample count is at the maximum value of 16. Ambient occlusion is enabled, and preset to a quality level of 5.

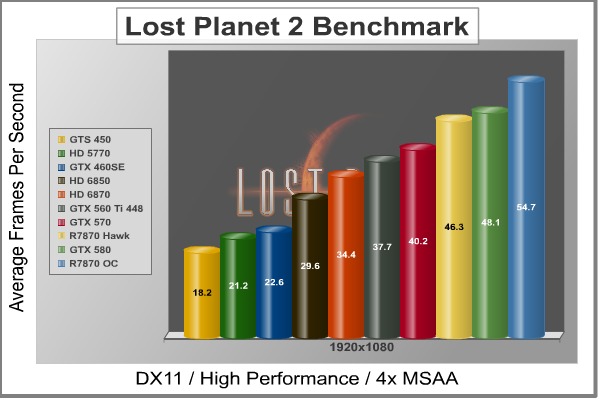
DX11: Lost Planet 2
Lost Planet 2 is the second instalment in the saga of the planet E.D.N. III, ten years after the story of Lost Planet: Extreme Condition. The snow has melted and the lush jungle life of the planet has emerged with angry and luscious flora and fauna. With the new environment comes the addition of DirectX-11 technology to the game.
Lost Planet 2 takes advantage of DX11 features including tessellation and displacement mapping on water, level bosses, and player characters. In addition, soft body compute shaders are used on 'Boss' characters, and wave simulation is performed using DirectCompute. These cutting edge features make for an excellent benchmark for top-of-the-line consumer GPUs.
The Lost Planet 2 benchmark offers two different tests, which serve different purposes. First up is test A.

Next is test B, which is designed to be a deterministic and effective benchmark tool featuring DirectX 11 elements.
DX11: DIRT 2 Demo
DiRT-2 features a roster of contemporary off-road events, taking players to diverse and challenging real-world environments. This World Tour has players competing in aggressive multi-car, and intense solo races at extraordinary new locations. Everything from canyon racing and jungle trails to city stadium-based events. Span the globe as players unlock tours in stunning locations spread across the face of the world. USA, Japan, Malaysia, Baja Mexico, Croatia, London, and more venues await, as players climb to the pinnacle of modern competitive off-road racing.

Multiple disciplines are featured; encompassing the very best that modern off-roading has to offer. Powered by the third generation of the EGO Engine's award-winning racing game technology, DiRT-2 benefits from tuned-up car-handling physics and new damaged engine effects. It showcases a spectacular new level of visual fidelity, with cars and tracks twice as detailed as those seen in GRID. The DiRT-2 garage houses a collection of officially licensed rally cars and off-road vehicles, specifically selected to deliver aggressive and fast paced racing. Covering seven vehicle classes, players are given the keys to powerful vehicles right away. In DiRT-2 the opening drive is the Group N Subaru, essentially making the ultimate car from the original game the starting point in the sequel, and the rides just get even more impressive as you rack up points.

The primary contribution that DirectX-11 makes to the DiRT-2 Demo benchmark is in the way water is displayed when a car is passing through it, and in the way cloth items are rendered. The water graphics are pretty obvious, and there are several places in the Moroccan race scene where cars are plowing through large and small puddles. Each one is unique, and they are all believable, especially when more than one car is in the scene. The cloth effects are not as obvious, except in the slower-moving menu screens; when there is a race on, there's precious little time to notice the realistic furls in a course-side flag. I should also note that the flags are much more noticeable in the actual game than in the demo, so they do add a little more to the realism there, that is absent from the benchmark.

DX11: Unigine Heaven 2.5
The Unigine Heaven 2.5 benchmark is a free publicly available tool that grants the power to unleash the graphics capabilities in DirectX-11 for Windows 7 or updated Vista Operating Systems. It reveals the enchanting magic of floating islands with a tiny village hidden in the cloudy skies. With the interactive mode, emerging experience of exploring the intricate world is within reach. Through its advanced renderer, Unigine is one of the first to set precedence in showcasing the art assets with tessellation, bringing compelling visual finesse, utilizing the technology to the full extend and exhibiting the possibilities of enriching 3D gaming.
The distinguishing feature in the Unigine Heaven benchmark is a hardware tessellation that is a scalable technology aimed for automatic subdivision of polygons into smaller and finer pieces, so that developers can gain a more detailed look of their games almost free of charge in terms of performance. Thanks to this procedure, the elaboration of the rendered image finally approaches the boundary of veridical visual perception: the virtual reality transcends conjured by your hand.
Although Heaven-2.1 was recently released and used for our DirectX-11 tests, the benchmark results were extremely close to those obtained with Heaven-1.0 testing. Since only DX11-compliant video cards will properly test on the Heaven benchmark, only those products that meet the requirements have been included.

MSI R7870 Hawk Temperatures
Benchmark tests are always nice, so long as you care about comparing one product to another. But when you're an overclocker, gamer, or merely a PC hardware enthusiast who likes to tweak things on occasion, there's no substitute for good information. Benchmark Reviews has a very popular guide written on Overclocking Video Cards, which gives detailed instruction on how to tweak a graphics cards for better performance. Of course, not every video card has overclocking head room. Some products run so hot that they can't suffer any higher temperatures than they already do. This is why we measure the operating temperature of the video card products we test.
To begin my testing, I use GPU-Z to measure the temperature at idle as reported by the GPU. Next I use FurMark's "Torture Test" to generate maximum thermal load and record GPU temperatures at high-power 3D mode. The ambient room temperature remained at a stable 23°C throughout testing. FurMark does two things extremely well: drive the thermal output of any graphics processor higher than applications of video games realistically could, and it does so with consistency every time. Furmark works great for testing the stability of a GPU as the temperature rises to the highest possible output. The temperatures discussed below are absolute maximum values, and not representative of real-world performance.
|
GPU |
Idle |
Load |
|
MSI R7870 Hawk |
32 C |
77 C |
|
MSI R7870 Hawk OC |
32 C |
79 C |
With the GPU idling at the Windows 7 desktop, the temperature rested at an easy 32 degrees Celsius. This is a little bit higher than other video cards that I have seen recently, but it's not terribly high. When I cranked FurMark the temperatures rose up to a max of 77 degrees Celsius. This is a little bit surprising for me. With the Twin Frozr IV design, I was expecting something a little lower. With the MSI R7870 Hawk overclocked, the idle temperature remained the same and the load temperature only raised 2 degrees to 79 degrees Celsius. This isn't really all that hot, but it is quite a bit higher than some other cards. I would have cranked the fan up to 100% to see if that made it a little cooler, but I discovered that the fan was already running at 100% on auto. Not only that, but it was pretty loud as well. I don't know the decibel rating, but when I can hear it rev up through my case and the other ambient noise in the room, its a little loud.
VGA Power Consumption
Life is not as affordable as it used to be, and items such as gasoline, natural gas, and electricity all top the list of resources which have exploded in price over the past few years. Add to this the limit of non-renewable resources compared to current demands, and you can see that the prices are only going to get worse. Planet Earth is needs our help, and needs it badly. With forests becoming barren of vegetation and snow capped poles quickly turning brown, the technology industry has a new attitude towards turning "green". I'll spare you the powerful marketing hype that gets sent from various manufacturers every day, and get right to the point: your computer hasn't been doing much to help save energy... at least up until now.
A baseline test is taken without a video card installed inside our test computer system, which is allowed to boot into Windows-7 and rest idle at the login screen before power consumption is recorded. Once the baseline reading has been taken, the graphics card is installed and the system is again booted into Windows and left idle at the login screen. Our final loaded power consumption reading is taken with the video card running a stress test using FurMark.
|
MSI R7870 Hawk |
Power Consumed |
|
Idle |
12 W |
|
2X Monitors Idle |
29 W |
|
Max |
249 W |
|
Streaming Movie |
88 W |
|
Gaming |
156 W |
The MSI R7870 Hawk idles very low. Even when running multiple monitors, the idle power consumption stays at a pretty good place. When streaming a movie off Netflix, the power consumption averaged 88 W. That's not too much, and it's definitely better than many video cards of older generations. Since most of you will probably be using your video cards for gaming, I've added in here the average power consumption used by the MSI R7870 Hawk while I was playing Mafia II on the settings listed in the Methodology section. Power consumption during gaming averaged at 156 W. That seems a little bit high for me, but it doesn't break the 200 W mark, so I'm not extremely concerned. The Max test was taken during the FurMark torture test and really doesn't represent something that you will likely experience during use.
MSI R7870 Hawk Overclocking
So this section is really what we all came for, right? The MSI R7870 Hawk is a video card that was designed to be overclocked. With the unlockable BIOS, there isn't much holding an enthusiast back from really pushing the R7870 Hawk to the limit. With that in mind, I set out on a mission to get the most I could out of this video card. I have seen other reviews of this card and come have been able to reach overclocks as high as 1400MHz on air. With the LN2 switch on the card, you can use liquid nitrogen to reach much higher than that, but 1400MHz is pretty amazing.

I started by leaving the voltage settings alone and just moving up the memory and GPU core clocks. The MSI R7870 Hawk comes equipped with Afterburner, an MSI utility that is outstanding for tweaking your GPU. Using Afterburner, I was able to get the MSI R7870 to 1260MHz on the core clock and 1300MHz on the memory clock without adjusting the voltage at all. That's respectable, but just not enough for me.
I decided to proceed cautiously. I pushed the GPU voltage up to 1.25v and left the memory voltage where it was. With this I was able to get the GPU core up to 1300MHz and the memory all the way to 1450MHz. The problem with this setting is that some of the benchmarks would fail. I decided it might be the memory voltage, so I pushed that up to 1.6v. That did the trick and the benchmark performances that you saw in the charts were from a 1300MHz GPU core and a 1450MHz memory clock.
That's almost a 20% increase in core clock speed and almost 21% in memory speed. Still, though, that's not enough for me. I saw someone get 1400MHz on air and I want it. I'm going to need a little more power to get it, though. For something that good, I need to push the envelope a little. I set the GPU voltage core to 1.4v. I'm too much of a weenie to go any higher without more than just air cooling. Even 1.4v frightens me. But this is go big or go home time, right? I pushed up the memory voltage to 1.7v as well. The memory, I think, has a lot of headroom in it. At the end of all that, I was able to get into windows with my 1400MHz and the memory clocked at 1600MHz. Not that it mattered. I couldn't run any tests. Any time I tried the driver failed. But I got it to boot at least!

I guess the moral of the story is that every GPU is different. Some will overclock better than others. If I was more daring, I might try a little more voltage, but I might also fry the GPU. At the end of the day, the most comfortably stable overclock I had was 1300MHz on the core and 1450MHz on the memory.
MSI R7870 Hawk Conclusion
IMPORTANT: Although the rating and final score mentioned in this conclusion are made to be as objective as possible, please be advised that every author perceives these factors differently at various points in time. While we each do our best to ensure that all aspects of the product are considered, there are often times unforeseen market conditions and manufacturer changes which occur after publication that could render our rating obsolete. Please do not base any purchase solely on our conclusion, as it represents our product rating specifically for the product tested which may differ from future versions. Benchmark Reviews begins our conclusion with a short summary for each of the areas that we rate.

The MSI R7870 Hawk performs very well. In almost every single benchmark, it outperformed the GTX 580. Nearly everything we threw at it came back with playable FPS rates. Almost any game that is available now will be playable at high performance settings on the MSI R7870 Hawk. Even if you weren't planning on overclocking the R7870 Hawk, it would still perform extremely well under almost any circumstance.
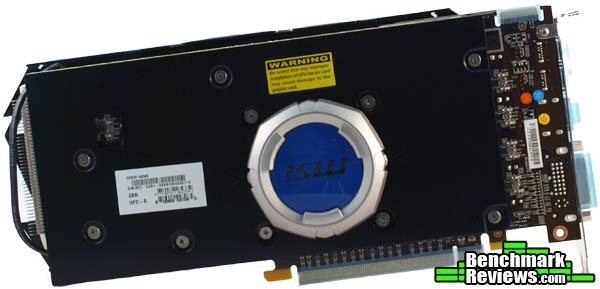
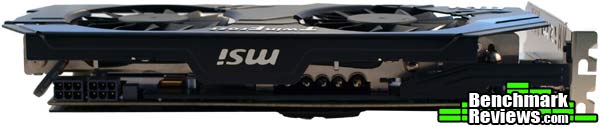
The R7870 Hawk looks pretty good. It follows a long line of Twin Frozr equipped MSI video cards and looks just like you would expect. I like the blue highlights on the black plastic shroud. The only real difference between the R7870 Hawk and other Twin Frozr equipped cards is the addition of the GPU reactor on the back. Along with the GPU reactor comes a black plate that covers the back of the card. I like the sleek look of that, although the bulge of the reactor seems a little out of place on the card. The GPU reactor, however, lights up a nice blue. That color adds a lot to the appearance of the MSI R7870 Hawk, especially if you have a windowed case.
MSI really shines when it comes to construction. They use extremely high quality, military grade components that can withstand even the most brutal of end-users. The VRM components are especially well constructed and held up to the brutal overclocking that I put the R7870 Hawk through. The additional plates on the front and the back of the PCB protect the components. Again, MSI is well-known for their high standard of construction. The R7870 Hawk doesn't compromise this standard. It even comes with a certificate from MSI to prove it.
The MSI R7870 Hawk was really designed for overclocking, so in terms of functionality, that's where it should excel. It certainly holds up in this area. This is one of the best video cards for overclocking that I have ever laid my hands on. The GPU reactor helps funnel more power to the components, which are made to withstand heavy loads. With all this, I was able to get the R7870 Hawk stably to 1300MHz on the GPU and 1450MHz on the memory. I was able to get it to boot at 1400MHz and 1600MHz respectively, and I'll bet with a little more tweaking I could get it more stable at that point. The MSI R7870 Hawk is certainly an overclocker with tons of headroom. As far as power consumption and temperatures go, the MSI R7870 Hawk ran a little higher than I would have liked to see in both those areas, but makes up for in overclockability.
The MSI R7870 Hawk presently sells for $379.99 at Amazon. That sits at the high end of Radeon HD 7870 cards, but it also comes packed full of features and hardware that help make up the difference. I'd like to see the price a little bit lower, as you can find factory overclocked 7870 cards for less. Basically, if you aren't planning on tweaking the MSI R7870 Hawk to take full potential of the high grade components and the GPU reactor, then I think you are probably better off going with a card that will end up costing you a little less. However, if you want to try your hand at overclocking and extreme tuning, you won't find a card that will let you experiment as forgivingly as this one.Pros:
+ Factory Overclocked to 1100MHz
+ GPU Reactor for more Current Volume and Less Ripple
+ Military Grade Components
+ Voltage Leads for VDDCI, GPU, and Memory
+ Outstanding Overclock Potential
+ CrossFire Support
Cons:
Ratings:
Final Score: 9.0 out of 10.
Excellence Achievement: Benchmark Reviews Golden Tachometer Award.
Benchmark Reviews invites you to leave constructive feedback below, or ask questions in our Discussion Forum.
Related Articles:
- NETGEAR ReadyNAS NV+ v2 NAS Server
- PNY XLR8 PRO Solid State Drive
- PowerColor PCS+ AX5870 1GBD5-PPDHG2
- HIS Solar LED Flashlight HSOLAR5S
- 120GB OCZ Vertex 3.20 Solid State Drive
- Super Talent UltraDrive ME SSD FTM28GX25H
- ASUS P6X58D-E Motherboard Performance
- NETGEAR XS708E ProSafe Plus 10GbE Switch
- Solid State Drive (SSD) Benchmark Performance Testing
- ZOTAC GeForce GTX 260 AMP! Edition

Comments
My specs are:
Gigabyte GA-78LMT-S2P
AMD FX-4100 at stock 3.6Ghz
8GB of Kingston hyperX 1600Mhz DDR3 RAM at 1300Mhz
500GB WD HDD running Win7 home 64bit
CX500w 80+Bronze PSU
##guru3d.com/articles_pages/msi_radeon_hd_7870_h awk_review,23.html
I Guess is your CPU and Power Supply is not enough to go further !
Here is where we begin the benchmark portion of this article, but first let me show you our test system plus the software we used.
Mainboard
MSI Big Bang XPower X58
Processor
Core i7 965 Extreme @ 3750 MHz
Graphics Card
MSI Radeon HD 7870 HAWK
Memory
6144 MB (3x 2048 MB) DDR3 Corsair @ 1500 MHz
Power Supply Unit
1200 Watt
Monitor
Dell 3007WFP - up to 2560x1600
OS related software
Windows 7 64-bit SP1
DirectX 9/10/11 End User Runtime (latest available)
AMD Catalyst AMD_PitCairn 8.95.5
NVIDIA GeForce series latest WHQL 285.62 WHQL
Radeon HD 7870 - On your average system the card requires you to have a 550 Watt power supply unit as minimum and 700 Watt if you go with two cards in Crossfire mode.
If you are going to overclock the GPU or processor, then we do recommend you purchase something with some more stamina.
There are many good PSUs out there, please do have a look at our many PSU reviews as we have loads of recommended PSUs for you to check out in there. What would happen if your PSU can't cope with the load:
bad 3D performance
crashing games
spontaneous reset or imminent shutdown of the PC
freezing during gameplay
PSU overload can cause it to break down
Let's move to the next page where we'll look into GPU heat levels and noise levels coming from the graphics cards.
As most of you know, with most videocards you can apply a simple series of tricks to boost the overall performance a little. You can do this at two levels, namely tweaking by enabling registry or BIOS hacks, or very simply to tamper with Image Quality. And then there is overclocking, which will give you the best possible results by far.
What do we need?
One of the best tools for overclocking NVIDIA and ATI videocards is our own AfterBurner which will work with 90% of the graphics cards out there. We can really recommend it, download here.
Where should we go?
Overclocking: By increasing the frequency of the videocard's memory and GPU, we can make the videocard increase its calculation clock cycles per second. It sounds hard, but it really can be done in less than a few minutes. I always tend to recommend to novice users and beginners, to not increase the frequency any higher than 5% on the core and memory clock. Example: If your card runs at 600 MHz then I suggest that you don't increase the frequency any higher than 30 to 50 MHz.
More advanced users push the frequency often way higher. Usually when your 3D graphics start to show artifacts such as white dots ("snow"), you should back down 10-15 MHz and leave it at that. Usually when you are overclocking too hard, it'll start to show artifacts, empty polygons or it will even freeze. Carefully find that limit and then back down at least 20 MHz from the moment you notice an artifact. Look carefully and observe well. I really wouldn't know why you need to overclock today's tested card anyway, but we'll still show it.
All in all... do it at your own risk.
The Radeon HD 7870
Original This sample Overclocked
Core Clock: 1000 MHz Core Clock: 1100 MHz Core Clock: 1300 MHz
Shader Clock: 1000 MHz Shader Clock: 1100 MHz Shader Clock: 1300 MHz
Memory Clock: 4800 MHz Memory Clock: 4800 MHz Memory Clock: 5800 MHz
Below, are some numbers based on the overclock we were able to pull off. The card is very flexible in terms of overclocking alright. Granted, the entire Radeon HD 7000 series is a gem when it comes to tweaking and the HAWK just upped it a notch.
MSI R7870 HAWK
Above, Crysis 2, same maxed out image quality settings as before yet now with added overclock results:
DirectX 11
High Resolution Texture Pack
Ultra Quality settings
4x AA
Level - Times Square (2 minute custom time demo)
MSI R7870 HAWK
MSI R7870 HAWK
Above, 3DMark 11 - the Performance test and score. As you can see, there is an additional bump in this very GPU limited software, lovely.
MSI R7870 HAWK
Above, Alien versus Predator, at 1920x1200 with 4x AA and 16X Anisotropic Filtering.