| PowerColor PCS+ AX5870 1GBD5-PPDHG2 |
| Reviews - Featured Reviews: Video Cards | ||||||||||||||||||||||||||||||||||||||||||||||||||||||||||||||||||||||||||||||||||||||||||||||||||||||||||||||||||||||||||||||||||||||||||||||||||||||||||||||||||||||||||||||||||||||||||||||||||||||||||||||||||||||||||||||||||||||||||||||||||||||||||||||||||||||||||||||||||||||||||||||||||||||||||||||||||||||||||||||||||||||||||||||||||||||||||||||||||||||||||||||||||||||||||||||||||||||||||||||||||||||||||||||||||||||||||||||||||||||||||||||||||||||||||||||||||||||||||||||||||||||||||||||||||||||||||||||||||||||||||||||||||||||||||||||||||||||||||||||||||||||||||||||||||||||||||||||||||||||||||||||||||||||||||||||||||||||||||||||||||||||||||||||||||||||||||||||||||||||||||||||||||||||||||||||||||||||||||||||||||||||||||||||||||||||||||
| Written by Bruce Normann | ||||||||||||||||||||||||||||||||||||||||||||||||||||||||||||||||||||||||||||||||||||||||||||||||||||||||||||||||||||||||||||||||||||||||||||||||||||||||||||||||||||||||||||||||||||||||||||||||||||||||||||||||||||||||||||||||||||||||||||||||||||||||||||||||||||||||||||||||||||||||||||||||||||||||||||||||||||||||||||||||||||||||||||||||||||||||||||||||||||||||||||||||||||||||||||||||||||||||||||||||||||||||||||||||||||||||||||||||||||||||||||||||||||||||||||||||||||||||||||||||||||||||||||||||||||||||||||||||||||||||||||||||||||||||||||||||||||||||||||||||||||||||||||||||||||||||||||||||||||||||||||||||||||||||||||||||||||||||||||||||||||||||||||||||||||||||||||||||||||||||||||||||||||||||||||||||||||||||||||||||||||||||||||||||||||||||||
| Tuesday, 20 April 2010 | ||||||||||||||||||||||||||||||||||||||||||||||||||||||||||||||||||||||||||||||||||||||||||||||||||||||||||||||||||||||||||||||||||||||||||||||||||||||||||||||||||||||||||||||||||||||||||||||||||||||||||||||||||||||||||||||||||||||||||||||||||||||||||||||||||||||||||||||||||||||||||||||||||||||||||||||||||||||||||||||||||||||||||||||||||||||||||||||||||||||||||||||||||||||||||||||||||||||||||||||||||||||||||||||||||||||||||||||||||||||||||||||||||||||||||||||||||||||||||||||||||||||||||||||||||||||||||||||||||||||||||||||||||||||||||||||||||||||||||||||||||||||||||||||||||||||||||||||||||||||||||||||||||||||||||||||||||||||||||||||||||||||||||||||||||||||||||||||||||||||||||||||||||||||||||||||||||||||||||||||||||||||||||||||||||||||||||
PowerColor PCS+ AX5870 Video Card ReviewIt's been some time since the launch of the ATI Radeon HD 5870, over six months from September of 2009. In that time, the graphics card world has not stood still, yet the HD 5870 reigned supreme for the entire time as the world's fastest (single) GPU. Now that Fermi has finally launched, that title belongs to the GTX480, but the 5870 has matured since its launch and it's time to take a look at where it's at today. Development has continued on both the hardware side and the software side. Driver updates have been a constant source of improvement and anguish, nothing unusual there. It seems like ATI and NVIDIA typically produce only one set of drivers in any given year that gets universal acclaim from the user community.
The PowerColor PCS+ AX5870 is one of several new HD 58xx series cards released by ATI AIB partners in the last few months that follow a new design pattern. Advances in power-semiconductor packaging have allowed for a simpler VRM implementation that also consumes much less real estate on the board. At the same time, the use of a down-flow HSF arrangement eliminates the dead spots found below and behind the blower wheel on the reference design. The combination makes for a smaller, more efficient, and more reliable card that's less costly to produce. I call that progress, but there are others who bemoan the process of removing cost from a design, commonly known as Value Engineering. I can understand the angst if functions and features are being removed, but finding a cheaper way to deliver the same performance is a good thing, unless you need to establish and maintain snob appeal for your product. Benchmark Reviews has tested a couple of ATI Radeon HD 5870 video cards already, so the performance and features of the GPU are hardly news, but with a number of second-generation cards appearing in the marketplace, we thought it was time to sample one and see how the basic design has matured. Please follow along as we give you a detailed look at one of the latest high-end Radeons from PowerColor. About the company: PowerColor
|
||||||||||||||||||||||||||||||||||||||||||||||||||||||||||||||||||||||||||||||||||||||||||||||||||||||||||||||||||||||||||||||||||||||||||||||||||||||||||||||||||||||||||||||||||||||||||||||||||||||||||||||||||||||||||||||||||||||||||||||||||||||||||||||||||||||||||||||||||||||||||||||||||||||||||||||||||||||||||||||||||||||||||||||||||||||||||||||||||||||||||||||||||||||||||||||||||||||||||||||||||||||||||||||||||||||||||||||||||||||||||||||||||||||||||||||||||||||||||||||||||||||||||||||||||||||||||||||||||||||||||||||||||||||||||||||||||||||||||||||||||||||||||||||||||||||||||||||||||||||||||||||||||||||||||||||||||||||||||||||||||||||||||||||||||||||||||||||||||||||||||||||||||||||||||||||||||||||||||||||||||||||||||||||||||||||||||


|
Product Series |
Stream Processors |
Core Clock (MHz) |
Shader Clock (MHz) |
Memory Clock (MHz) |
Memory Amount |
Memory Interface |
|
ASUS Radeon HD4850 (EAH4850 TOP) |
800 |
680 |
N/A |
1050 |
512MB GDDR3 |
256-bit |
|
ATI Radeon HD5770 (Engineering Sample) |
800 |
850 |
N/A |
1200 |
1.0GB GDDR5 |
128-bit |
|
XFX Radeon HD5830 (HD-583X-ZNFV) |
1120 |
800 |
N/A |
1000 |
1.0GB GDDR5 |
256-bit |
|
ASUS GeForce GTX 260 (ENGTX260 MATRIX) |
216 |
576 |
1242 |
999 |
896MB GDDR3 |
448-bit |
|
XFX Radeon HD5850 (21162-00-50R) |
1440 |
725 |
N/A |
1000 |
1.0GB GDDR5 |
256-bit |
|
MSI GeForce GTX 275 (N275GTX Twin Frozr OC) |
240 |
666 |
1476 |
1161 |
896MB GDDR3 |
448-bit |
|
ASUS GeForce GTX 285 (GTX285 MATRIX) |
240 |
662 |
1476 |
1242 |
1.0GB GDDR3 |
512-bit |
|
XFX Radeon HD5870 (HD-587X-ZNFC) |
1600 |
850 |
N/A |
1200 |
1.0GB GDDR5 |
256-bit |
|
PowerColor AX5870 (1GBD5-PPDHG2) |
1600 |
875 |
N/A |
1250 |
1.0GB GDDR5 |
256-bit |
|
PowerColor AX5870 (1GBD5-PPDHG2) |
1600 |
925 OC |
N/A |
1300 OC |
1.0GB GDDR5 |
256-bit |
-
ASUS Radeon HD4850 (EAH4850 TOP - Catalyst 8.712.0.0)
-
XFX Radeon HD5750 (HD-575X-ZN - Catalyst 8.712.0.0)
-
ATI Radeon HD5770 (Engineering Sample - Catalyst 8.712.0.0)
-
XFX Radeon HD5830 (HD-583X-ZNFV - Catalyst 8.712.0.0)
-
XFX Radeon HD5850 (21162-00-50R - ATI Catalyst 8.712.0.0)
-
ASUS GeForce GTX 260 (ENGTX260 MATRIX - Forceware v195.62)
-
MSI GeForce GTX 275 (N275GTX Twin Frozr OC - Forceware v195.62)
-
ASUS GeForce GTX 285 (GTX285 MATRIX - Forceware v195.62)
-
XFX Radeon HD5870 (HD-587X-ZNFC - Catalyst 8.712.0.0)
-
PowerColor PCS+ AX5870 (1GBD5-PPDHG2 - Catalyst 8.712.0.0)
3DMark Vantage Benchmark Results
3DMark Vantage is a computer benchmark by Futuremark (formerly named Mad Onion) to determine the DirectX 10 performance of 3D game performance with graphics cards. A 3DMark score is an overall measure of your system's 3D gaming capabilities, based on comprehensive real-time 3D graphics and processor tests. By comparing your score with those submitted by millions of other gamers you can see how your gaming rig performs, making it easier to choose the most effective upgrades or finding other ways to optimize your system.
There are two graphics tests in 3DMark Vantage: Jane Nash (Graphics Test 1) and New Calico (Graphics Test 2). The Jane Nash test scene represents a large indoor game scene with complex character rigs, physical GPU simulations, multiple dynamic lights, and complex surface lighting models. It uses several hierarchical rendering steps, including for water reflection and refraction, and physics simulation collision map rendering. The New Calico test scene represents a vast space scene with lots of moving but rigid objects and special content like a huge planet and a dense asteroid belt.
At Benchmark Reviews, we believe that synthetic benchmark tools are just as valuable as video games, but only so long as you're comparing apples to apples. Since the same test is applied in the same controlled method with each test run, 3DMark is a reliable tool for comparing graphic cards against one-another.
1680x1050 is rapidly becoming the new 1280x1024. More and more widescreen are being sold with new systems or as upgrades to existing ones. Even in tough economic times, the tide cannot be turned back; screen resolution and size will continue to creep up. Using this resolution as a starting point, the maximum settings were applied to 3DMark Vantage include 8x Anti-Aliasing, 16x Anisotropic Filtering, all quality levels at Extreme, and Post Processing Scale at 1:2.

Our first test looks promising; at 1680x1050 the PowerColor PCS+ 5870 shows nice gains from both the 25 MHz factory overclock and the additional 50 MHz overclock I threw on top of that. All the results are very even and linear, just the way synthetic benchmarks are supposed to be.

At 1920x1200 native resolution, things look much the same as they did at the lower screen size. The 5870 shows that it keeps going and going as the GPU clock rate goes up. It's the only card that can break 30FPS at this resolution, and it's pretty obvious as the test plays out on the screen. All the lower choices seem choppy by comparison. Let's take a look at test#2, which has a lot more surfaces to render, with all those asteroids flying around New Calico.

In the New Calico test, the PowerColor PCS+ AX5830 sits right on top again and performance scales well with higher clock rates. Once again, the only other card that comes close is the HD 5850, everyone's favorite overachiever.

At a higher screen resolution of 1920x1200, we see the lone 512MB card falling behind, and the HD 5850 retains its spot as the closest competitor to the 5870 cards. Even the fastest single GPU cards have trouble rendering this scene, with an average frame rate in the low 20s. Soon this benchmark suite may be replaced with DX11-based tests, but in the fading days of DX10 it has been a very reliable benchmark for high-end video cards. We need to look at some actual gaming performance to verify these results, so let's take a look in the next section, at how these cards stack up in the standard bearer for gaming benchmarks, Crysis.
|
Product Series |
Stream Processors |
Core Clock (MHz) |
Shader Clock (MHz) |
Memory Clock (MHz) |
Memory Amount |
Memory Interface |
|
ASUS Radeon HD4850 (EAH4850 TOP) |
800 |
680 |
N/A |
1050 |
512MB GDDR3 |
256-bit |
|
ATI Radeon HD5770 (Engineering Sample) |
800 |
850 |
N/A |
1200 |
1.0GB GDDR5 |
128-bit |
|
XFX Radeon HD5830 (HD-583X-ZNFV) |
1120 |
800 |
N/A |
1000 |
1.0GB GDDR5 |
256-bit |
|
ASUS GeForce GTX 260 (ENGTX260 MATRIX) |
216 |
576 |
1242 |
999 |
896MB GDDR3 |
448-bit |
|
XFX Radeon HD5850 (21162-00-50R) |
1440 |
725 |
N/A |
1000 |
1.0GB GDDR5 |
256-bit |
|
MSI GeForce GTX 275 (N275GTX Twin Frozr OC) |
240 |
666 |
1476 |
1161 |
896MB GDDR3 |
448-bit |
|
ASUS GeForce GTX 285 (GTX285 MATRIX) |
240 |
662 |
1476 |
1242 |
1.0GB GDDR3 |
512-bit |
|
XFX Radeon HD5870 (HD-587X-ZNFC) |
1600 |
850 |
N/A |
1200 |
1.0GB GDDR5 |
256-bit |
|
PowerColor AX5870 (1GBD5-PPDHG2) |
1600 |
875 |
N/A |
1250 |
1.0GB GDDR5 |
256-bit |
|
PowerColor AX5870 (1GBD5-PPDHG2) |
1600 |
925 OC |
N/A |
1300 OC |
1.0GB GDDR5 |
256-bit |
Crysis Benchmark Results
Crysis uses a new graphics engine: the CryENGINE2, which is the successor to Far Cry's CryENGINE. CryENGINE2 is among the first engines to use the Direct3D 10 (DirectX 10) framework, but can also run using DirectX 9, on Vista, Windows XP and the new Windows 7. As we'll see, there are significant frame rate reductions when running Crysis in DX10. It's not an operating system issue, DX9 works fine in WIN7, but DX10 knocks the frame rates in half.
Roy Taylor, Vice President of Content Relations at NVIDIA, has spoken on the subject of the engine's complexity, stating that Crysis has over a million lines of code, 1GB of texture data, and 85,000 shaders. To get the most out of modern multicore processor architectures, CPU intensive subsystems of CryENGINE 2 such as physics, networking and sound, have been re-written to support multi-threading.
Crysis offers an in-game benchmark tool, which is similar to World in Conflict. This short test does place some high amounts of stress on a graphics card, since there are so many landscape features rendered. For benchmarking purposes, Crysis can mean trouble as it places a high demand on both GPU and CPU resources. Benchmark Reviews uses the Crysis Benchmark Tool by Mad Boris to test frame rates in batches, which allows the results of many tests to be averaged.
Low-resolution testing allows the graphics processor to plateau its maximum output performance, and shifts demand onto the other system components. At the lower resolutions Crysis will reflect the GPU's top-end speed in the composite score, indicating full-throttle performance with little load. This makes for a less GPU-dependant test environment, but it is sometimes helpful in creating a baseline for measuring maximum output performance. At the 1280x1024 resolution used by 17" and 19" monitors, the CPU and memory have too much influence on the results to be used in a video card test. At the widescreen resolutions of 1680x1050 and 1900x1200, the performance differences between video cards under test are mostly down to the cards.

With medium screen resolution and no AA dialed in, the PowerColor PCS+ 5870 card continues to have a field day. Remember all the test results in this article are with maximum allowable image quality settings, plus all the performance numbers in Crysis took a major hit when Benchmark Reviews switched over to the DirectX 10 API for all our testing. Considering all that, the 5870 hits the sweet spot for Crysis, with no lag detectable in game play.

At 1900 x 1200 resolution, everything looks the same; even the 512MB card is still hanging in there. Those old HD4850 cards were really good performers in Crysis with DX9, but they can't compete in DX10 with today's powerhouses. Both the HD5870 cards take about a 7FPS hit when moving up to 1920x1200, but they're still comfortably above the 30 FPS mark.

Now let's turn up the heat a bit, and add some Anti-Aliasing. With 4x MSAA cranked in, the PCS+ AX5870 backs off slightly, only making 42 FPS when overclocked to 925 MHz. Of course this result demolishes all the GTX cards again.

This is one of our toughest tests, at 1900 x 1200, maximum quality levels, and 4x AA. Only one GPU gets above 30 FPS in this test, and until recently it was the fastest single-GPU card on the planet, the Radeon HD 5870. The PowerColor PCS+ gains a little ground on its stock counterpart, and gains even more when pushed to a 9% overclock. The scaling in Crysis is almost as linear as a synthetic benchmark, I think that's one of the reasons it has stayed relevant all this time. In the middle ranges, the HD 5850 holds on to its spot as the value proposition to beat. Even with its low stock clocks, it beats the GTX285 by 29%.
|
Product Series |
Stream Processors |
Core Clock (MHz) |
Shader Clock (MHz) |
Memory Clock (MHz) |
Memory Amount |
Memory Interface |
|
ASUS Radeon HD4850 (EAH4850 TOP) |
800 |
680 |
N/A |
1050 |
512MB GDDR3 |
256-bit |
|
ATI Radeon HD5770 (Engineering Sample) |
800 |
850 |
N/A |
1200 |
1.0GB GDDR5 |
128-bit |
|
XFX Radeon HD5830 (HD-583X-ZNFV) |
1120 |
800 |
N/A |
1000 |
1.0GB GDDR5 |
256-bit |
|
ASUS GeForce GTX 260 (ENGTX260 MATRIX) |
216 |
576 |
1242 |
999 |
896MB GDDR3 |
448-bit |
|
XFX Radeon HD5850 (21162-00-50R) |
1440 |
725 |
N/A |
1000 |
1.0GB GDDR5 |
256-bit |
|
MSI GeForce GTX 275 (N275GTX Twin Frozr OC) |
240 |
666 |
1476 |
1161 |
896MB GDDR3 |
448-bit |
|
ASUS GeForce GTX 285 (GTX285 MATRIX) |
240 |
662 |
1476 |
1242 |
1.0GB GDDR3 |
512-bit |
|
XFX Radeon HD5870 (HD-587X-ZNFC) |
1600 |
850 |
N/A |
1200 |
1.0GB GDDR5 |
256-bit |
|
PowerColor AX5870 (1GBD5-PPDHG2) |
1600 |
875 |
N/A |
1250 |
1.0GB GDDR5 |
256-bit |
|
PowerColor AX5870 (1GBD5-PPDHG2) |
1600 |
925 OC |
N/A |
1300 OC |
1.0GB GDDR5 |
256-bit |
In our next section, Benchmark Reviews tests with Devil May Cry 4 Benchmark. Read on to see how a blended high-demand GPU test with low video frame buffer demand will impact our test products.
Devil May Cry 4 Benchmark
Devil May Cry 4 was released for the PC platform in early 2007 as the fourth installment to the Devil May Cry video game series. DMC4 is a direct port from the PC platform to console versions, which operate at the native 720P game resolution with no other platform restrictions. Devil May Cry 4 uses the refined MT Framework game engine, which has been used for many popular Capcom game titles over the past several years.
MT Framework is an exclusive seventh generation game engine built to be used with games developed for the PlayStation 3 and Xbox 360, and PC ports. MT stands for "Multi-Thread", "Meta Tools" and "Multi-Target". Originally meant to be an outside engine, but none matched their specific requirements in performance and flexibility. Games using the MT Framework are originally developed on the PC and then ported to the other two console platforms. On the PC version a special bonus called Turbo Mode is featured, giving the game a slightly faster speed, and a new difficulty called Legendary Dark Knight Mode is implemented. The PC version also has both DirectX 9 and DirectX 10 mode for Windows XP, Vista, and Widows 7 operating systems.
It's always nice to be able to compare the results we receive here at Benchmark Reviews with the results you test for on your own computer system. Usually this isn't possible, since settings and configurations make it nearly difficult to match one system to the next; plus you have to own the game or benchmark tool we used. Devil May Cry 4 fixes this, and offers a free benchmark tool available for download. Because the DMC4 MT Framework game engine is rather low-demand for today's cutting edge video cards, Benchmark Reviews uses the 1920x1200 resolution to test with 8x AA (highest AA setting available to Radeon HD video cards) and 16x AF.
Devil May Cry 4 is not as demanding a benchmark as it used to be. Only scene #2 and #4 are worth looking at from the standpoint of trying to separate the fastest video cards from the slower ones. Still, it represents a typical environment for many games that our readers still play on a regular basis, so it's good to see what works with it and what doesn't. Any of the tested cards will do a credible job in this application, and the performance scales in a pretty linear fashion. You get what you pay for when running this game, at least for benchmarks. This is one time where you can generally use the maximum available anti-aliasing settings, so NVIDIA users should feel free to crank it up to 16X. The DX10 "penalty" is of no consequence here.

The GTX cards from NVIDIA stage a comeback in Devil May Cry 4, but the 5870 cards still take top place. They also show that a little bit of overclocking still works, even at crazy frame rates, where the slowest HD 5870 video card still pulls down 117 FPS.

In Scene #4, the GTX cards pull a little bit closer, but are still about 30 FPS behind the 5870 trio, not that you'd notice at 90+ frame rates.
|
Product Series |
Stream Processors |
Core Clock (MHz) |
Shader Clock (MHz) |
Memory Clock (MHz) |
Memory Amount |
Memory Interface |
|
ASUS Radeon HD4850 (EAH4850 TOP) |
800 |
680 |
N/A |
1050 |
512MB GDDR3 |
256-bit |
|
ATI Radeon HD5770 (Engineering Sample) |
800 |
850 |
N/A |
1200 |
1.0GB GDDR5 |
128-bit |
|
XFX Radeon HD5830 (HD-583X-ZNFV) |
1120 |
800 |
N/A |
1000 |
1.0GB GDDR5 |
256-bit |
|
ASUS GeForce GTX 260 (ENGTX260 MATRIX) |
216 |
576 |
1242 |
999 |
896MB GDDR3 |
448-bit |
|
XFX Radeon HD5850 (21162-00-50R) |
1440 |
725 |
N/A |
1000 |
1.0GB GDDR5 |
256-bit |
|
MSI GeForce GTX 275 (N275GTX Twin Frozr OC) |
240 |
666 |
1476 |
1161 |
896MB GDDR3 |
448-bit |
|
ASUS GeForce GTX 285 (GTX285 MATRIX) |
240 |
662 |
1476 |
1242 |
1.0GB GDDR3 |
512-bit |
|
XFX Radeon HD5870 (HD-587X-ZNFC) |
1600 |
850 |
N/A |
1200 |
1.0GB GDDR5 |
256-bit |
|
PowerColor AX5870 (1GBD5-PPDHG2) |
1600 |
875 |
N/A |
1250 |
1.0GB GDDR5 |
256-bit |
|
PowerColor AX5870 (1GBD5-PPDHG2) |
1600 |
925 OC |
N/A |
1300 OC |
1.0GB GDDR5 |
256-bit |
Our next benchmark of the series is for a very popular FPS game that rivals Crysis for world-class graphics in a far away land.
Far Cry 2 Benchmark Results
Ubisoft has developed Far Cry 2 as a sequel to the original, but with a very different approach to game play and story line. Far Cry 2 features a vast world built on Ubisoft's new game engine called Dunia, meaning "world", "earth" or "living" in Farci. The setting in Far Cry 2 takes place on a fictional Central African landscape, set to a modern day timeline.
The Dunia engine was built specifically for Far Cry 2, by Ubisoft Montreal development team. It delivers realistic semi-destructible environments, special effects such as dynamic fire propagation and storms, real-time night-and-day sun light and moon light cycles, dynamic music system, and non-scripted enemy A.I actions.
The Dunia game engine takes advantage of multi-core processors as well as multiple processors and supports DirectX 9 as well as DirectX 10. Only 2 or 3 percent of the original CryEngine code is re-used, according to Michiel Verheijdt, Senior Product Manager for Ubisoft Netherlands. Additionally, the engine is less hardware-demanding than CryEngine 2, the engine used in Crysis. However, it should be noted that Crysis delivers greater character and object texture detail, as well as more destructible elements within the environment. For example; trees breaking into many smaller pieces and buildings breaking down to their component panels. Far Cry 2 also supports the amBX technology from Philips. With the proper hardware, this adds effects like vibrations, ambient colored lights, and fans that generate wind effects.
There is a benchmark tool in the PC version of Far Cry 2, which offers an excellent array of settings for performance testing. Benchmark Reviews used the maximum settings allowed for our tests, with the resolution set to 1920x1200. The performance settings were all set to 'Very High', Render Quality was set to 'Ultra High' overall quality level, 8x anti-aliasing was applied, and HDR and Bloom were enabled. Of course DX10 was used exclusively for this series of tests.

Even on a game that typically favors the Green Machine, the HD 5870 cards are top dog again. They also respond well to the GPU overclocks of 25 MHz and 75MHz above standard. Even with the higher overclock, the GPU temperature only maxed out at 59C. This test is generally one of the lighter GPU loads among our benchmarks; the coding appears to be highly optimized.
Although the Dunia engine in Far Cry 2 is slightly less demanding than CryEngine 2 engine in Crysis, the strain appears to be extremely close. In Crysis we didn't dare to test AA above 4x, whereas we use 8x AA and 'Ultra High' settings in Far Cry 2. Using the short 'Ranch Small' time demo (which yields the lowest FPS of the three tests available), many of the midrange products we've tested are capable of producing playable frame rates with the settings all turned up. We also see a different effect when switching our testing to DirectX 10. Far Cry 2 seems to have been optimized, or at least written with a clear understanding of DX10 requirements.

The higher resolution test doesn't change the rankings at all, and the overclock scaling for the PowerColor PCS+ AX5870 is right on target, netting a 9% gain in frame rates for a 9% overclock.
|
Product Series |
Stream Processors |
Core Clock (MHz) |
Shader Clock (MHz) |
Memory Clock (MHz) |
Memory Amount |
Memory Interface |
|
ASUS Radeon HD4850 (EAH4850 TOP) |
800 |
680 |
N/A |
1050 |
512MB GDDR3 |
256-bit |
|
ATI Radeon HD5770 (Engineering Sample) |
800 |
850 |
N/A |
1200 |
1.0GB GDDR5 |
128-bit |
|
XFX Radeon HD5830 (HD-583X-ZNFV) |
1120 |
800 |
N/A |
1000 |
1.0GB GDDR5 |
256-bit |
|
ASUS GeForce GTX 260 (ENGTX260 MATRIX) |
216 |
576 |
1242 |
999 |
896MB GDDR3 |
448-bit |
|
XFX Radeon HD5850 (21162-00-50R) |
1440 |
725 |
N/A |
1000 |
1.0GB GDDR5 |
256-bit |
|
MSI GeForce GTX 275 (N275GTX Twin Frozr OC) |
240 |
666 |
1476 |
1161 |
896MB GDDR3 |
448-bit |
|
ASUS GeForce GTX 285 (GTX285 MATRIX) |
240 |
662 |
1476 |
1242 |
1.0GB GDDR3 |
512-bit |
|
XFX Radeon HD5870 (HD-587X-ZNFC) |
1600 |
850 |
N/A |
1200 |
1.0GB GDDR5 |
256-bit |
|
PowerColor AX5870 (1GBD5-PPDHG2) |
1600 |
875 |
N/A |
1250 |
1.0GB GDDR5 |
256-bit |
|
PowerColor AX5870 (1GBD5-PPDHG2) |
1600 |
925 OC |
N/A |
1300 OC |
1.0GB GDDR5 |
256-bit |
Our next benchmark of the series puts our collection of video cards against some fresh graphics in the newly released Resident Evil 5 benchmark.
Resident Evil 5 Benchmark Results
PC gamers get the ultimate Resident Evil package in this new PC version with exclusive features including NVIDIA's new GeForce 3D Vision technology (wireless 3D Vision glasses sold separately), new costumes and a new mercenary mode with more enemies on screen. Delivering an infinite level of detail, realism and control, Resident Evil 5 is certain to bring new fans to the series. Incredible changes to game play and the world of Resident Evil make it a must-have game for gamers across the globe.
Years after surviving the events in Raccoon City, Chris Redfield has been fighting the scourge of bio-organic weapons all over the world. Now a member of the Bio-terrorism Security Assessment Alliance (BSSA), Chris is sent to Africa to investigate a biological agent that is transforming the populace into aggressive and disturbing creatures. New cooperatively-focused game play revolutionizes the way that Resident Evil is played. Chris and Sheva must work together to survive new challenges and fight dangerous hordes of enemies.
From a gaming performance perspective, Resident Evil 5 uses Next Generation of Fear - Ground breaking graphics that utilize an advanced version of Capcom's proprietary game engine, MT Framework, which powered the hit titles Devil May Cry 4, Lost Planet and Dead Rising. The game uses a wider variety of lighting to enhance the challenge. Fear Light as much as Shadow - Lighting effects provide a new level of suspense as players attempt to survive in both harsh sunlight and extreme darkness. As usual, we maxed out the graphics settings on the benchmark version of this popular game, to put the hardware through its paces. Much like Devil May Cry 4, it's relatively easy to get good frame rates in this game, so take the opportunity to turn up all the knobs and maximize the visual experience.

The Resident Evil5 benchmark tool provides a graph of continuous frame rates and averages for each of four distinct scenes which take place in different areas of the compound. In addition it calculates an overall average for the four scenes. The averages for scene #3 and #4 are what we report here, as they are the most challenging. Looking at the results for area #3, it's obvious that the NVIDIA cards do exceptionally well in this benchmark, and the HD 5870 doesn't have nearly the same advantage it had in the other tests. The overclocks on the PowerColor PCS+ card help put some distance between the two competitors, but the GTX285 card we tested still has some overclocking room left in it, too. If this is your main game, the GTX cards may offer better value in this one instance. There is quite a bit of variation in the game play between the four areas, so let's see what happens in the next most challenging scene, area #4.

In area #4, the 5870 convincingly reclaims its title, and the 5850 comes back to compete with the GTX285, just like we've seen on the other titles so far. I'm not sure what it is in area #3 that gives the GT200 cards such an advantage, but it doesn't last throughout the entire benchmark. Let's keep looking, especially at some new titles that were developed for DX11, and see if there's any more give-and-take, or if it remains all take for the HD 5870.
|
Product Series |
Stream Processors |
Core Clock (MHz) |
Shader Clock (MHz) |
Memory Clock (MHz) |
Memory Amount |
Memory Interface |
|
ASUS Radeon HD4850 (EAH4850 TOP) |
800 |
680 |
N/A |
1050 |
512MB GDDR3 |
256-bit |
|
ATI Radeon HD5770 (Engineering Sample) |
800 |
850 |
N/A |
1200 |
1.0GB GDDR5 |
128-bit |
|
XFX Radeon HD5830 (HD-583X-ZNFV) |
1120 |
800 |
N/A |
1000 |
1.0GB GDDR5 |
256-bit |
|
ASUS GeForce GTX 260 (ENGTX260 MATRIX) |
216 |
576 |
1242 |
999 |
896MB GDDR3 |
448-bit |
|
XFX Radeon HD5850 (21162-00-50R) |
1440 |
725 |
N/A |
1000 |
1.0GB GDDR5 |
256-bit |
|
MSI GeForce GTX 275 (N275GTX Twin Frozr OC) |
240 |
666 |
1476 |
1161 |
896MB GDDR3 |
448-bit |
|
ASUS GeForce GTX 285 (GTX285 MATRIX) |
240 |
662 |
1476 |
1242 |
1.0GB GDDR3 |
512-bit |
|
XFX Radeon HD5870 (HD-587X-ZNFC) |
1600 |
850 |
N/A |
1200 |
1.0GB GDDR5 |
256-bit |
|
PowerColor AX5870 (1GBD5-PPDHG2) |
1600 |
875 |
N/A |
1250 |
1.0GB GDDR5 |
256-bit |
|
PowerColor AX5870 (1GBD5-PPDHG2) |
1600 |
925 OC |
N/A |
1300 OC |
1.0GB GDDR5 |
256-bit |
In our next section, we look at the one of the newest DX11 benchmarks, straight from Russia and the studios of Unigine. Their latest benchmark is called "Heaven", and it has some very interesting and non-typical graphics. So, let's take a peek at what Heaven v2.0 looks like.
Unigine - Heaven Benchmark Results
Unigine Corp. released the first DirectX 11 benchmark "Heaven" that is based on its proprietary UnigineTM engine. The company has already made a name among the overclockers and gaming enthusiasts for uncovering the realm of true GPU capabilities with previously released "Sanctuary" and "Tropics" demos.
Recently Unigine released Heaven 2.0 with some new scenes and features. The biggest difference (besides all the newly installed cannons...?!?) is the ability to change the tessellation load. The jaded among us call the new Extreme Mode - "Fermi Mode", given the timing of the release and the fact that Heaven 1.0 was developed using the ATI Cypress chips and Heaven 2.0 was likely developed using NVIDIA GTX480s. For now, the Normal Mode seems best suited for today's hardware and it matches the results from Heaven 1.0 pretty well, so that what I used for testing.
Changes in version 2.0
-
Heavier tessellation load
-
Several major optimizations of the engine (including more effective culling of tessellated geometry)
-
Added new elaborated objects in the world (airship, fort, pier)
-
Physics-driven flags
-
Added more dynamic lights
-
Enhancements of some old assets
-
Introduced "moderate" and "extreme" tessellation modes in addition to the "normal" one
-
Moderate Mode - This mode is targeted to provide reasonable performance on a wide range of DX11 hardware.
-
Normal Mode - Default mode available in the benchmark shows optimal quality-to-performance ratio.
-
Extreme Mode - Designed to meet the perspectives of the next series of DX11-capable hardware, pushing up the tessellation level to the extreme in the next 1-2 years.
-
The "Heaven" benchmark excels at providing the following key features:
-
Native support of OpenGL, DirectX 9, DirectX 10 and DirectX 11
-
Comprehensive use of tessellation technology
-
Advanced SSAO (screen-space ambient occlusion)
-
Volumetric cumulonimbus clouds generated by a physically accurate algorithm
-
Dynamic simulation of changing environment with high physical fidelity
-
Interactive experience with fly/walk-through modes
-
ATI EyeFinity support
Unigine Corp. is an international company focused on top-notch real-time 3D solutions. The development studio is located in Tomsk, Russia. Main activity of Unigine Corp. is development of UnigineTM, a cross-platform engine for virtual 3D worlds. Since the project start in 2004, it attracts attention of different companies and groups of independent developers, because Unigine is always on the cutting edge of real-time 3D visualization and physics simulation technologies.

Starting off with a lighter load of 4x MSAA, we see a steady progression of performance as you move up the ATI 5xxx ladder. The HD 5870 still puts on a star performance and leads the crowd, and the overclocks certainly don't hurt anything either. There is still some jerkiness with most of the cards, until you get to the top two. This test was run with 4x anti-aliasing; let's see how the cards stack up when we increase MSAA to the maximum level of 8x.

Increasing the anti-aliasing did nothing to the relative rankings; it just pushed everything down about 15%. It's interesting to note that the HD 5850 doesn't stand out so much with this benchmark; everywhere else, it seems to jump a little higher that its neighbors. I also noticed less impact in Heaven 2.0 from the chimney smoke. In Heaven 1.0, when there was a bit of smoke in the scene, the frame rate dropped radically, and it really hurt the older cards in DX10 mode.
|
Product Series |
Stream Processors |
Core Clock (MHz) |
Shader Clock (MHz) |
Memory Clock (MHz) |
Memory Amount |
Memory Interface |
|
ASUS Radeon HD4850 (EAH4850 TOP) |
800 |
680 |
N/A |
1050 |
512MB GDDR3 |
256-bit |
|
ATI Radeon HD5770 (Engineering Sample) |
800 |
850 |
N/A |
1200 |
1.0GB GDDR5 |
128-bit |
|
XFX Radeon HD5830 (HD-583X-ZNFV) |
1120 |
800 |
N/A |
1000 |
1.0GB GDDR5 |
256-bit |
|
ASUS GeForce GTX 260 (ENGTX260 MATRIX) |
216 |
576 |
1242 |
999 |
896MB GDDR3 |
448-bit |
|
XFX Radeon HD5850 (21162-00-50R) |
1440 |
725 |
N/A |
1000 |
1.0GB GDDR5 |
256-bit |
|
MSI GeForce GTX 275 (N275GTX Twin Frozr OC) |
240 |
666 |
1476 |
1161 |
896MB GDDR3 |
448-bit |
|
ASUS GeForce GTX 285 (GTX285 MATRIX) |
240 |
662 |
1476 |
1242 |
1.0GB GDDR3 |
512-bit |
|
XFX Radeon HD5870 (HD-587X-ZNFC) |
1600 |
850 |
N/A |
1200 |
1.0GB GDDR5 |
256-bit |
|
PowerColor AX5870 (1GBD5-PPDHG2) |
1600 |
875 |
N/A |
1250 |
1.0GB GDDR5 |
256-bit |
|
PowerColor AX5870 (1GBD5-PPDHG2) |
1600 |
925 OC |
N/A |
1300 OC |
1.0GB GDDR5 |
256-bit |
Let's take a look at one more benchmark, a decidedly less cheerful scenario in a post-apocalyptic "Zone", which is traversed by mercenary guides called Stalkers.
S.T.A.L.K.E.R.: Call of Pripyat Benchmark Results
The events of S.T.A.L.K.E.R.: Call of Pripyat unfolds shortly after the end of S.T.A.L.K.E.R.: Shadow of Chernobyl. Having discovered about the open path to the Zone center, the government decides to hold a large-scale military "Fairway" operation aimed to take the CNPP under control. According to the operation's plan, the first military group is to conduct an air scouting of the territory to map out the detailed layouts of anomalous fields location. Thereafter, making use of the maps, the main military forces are to be dispatched. Despite thorough preparations, the operation fails. Most of the avant-garde helicopters crash. In order to collect information on reasons behind the operation failure, Ukraine's Security Service sends their agent into the Zone center.
S.T.A.L.K.E.R.: CoP is developed on X-Ray game engine v.1.6, and implements several ambient occlusion (AO) techniques including one that AMD has developed. AMD's AO technique is optimized to run on efficiently on Direct3D11 hardware. It has been chosen by a number of games (e.g. BattleForge, HAWX, or the new Aliens vs. Predator) for the distinct effect in it adds to the final rendered images. This AO technique is called HDAO which stands for ‘High Definition Ambient Occlusion' because it picks up occlusions from fine details in normal maps.

Within the limits imposed by the NVIDIA cards that don't support DirectX 11, we can turn the settings on S.T.A.L.K.E.R.: Call of Pripyat all the way up. We're using SSAO, one of the technologies that first made its appearance in DirectX 10. In the first test, with SSAO turned on in Default Mode, and Quality set to High, we see a drastic performance advantage with the ATI boards. As an example, the HD5850 burns up the screen with 70% better performance than a mildly overclocked, and more expensive GTX285. Apparently, SSAO really hates the GTX platform. Despite the company's insistence that DX11 is largely unnecessary, their performance on one of the key enabling technologies of DX10 is less than compelling. One other thing looks a little different; the overclocking of the Radeon HD 5870 didn't have nearly as much effect in this benchmark. For a 9% increase in GPU clock, we only got a 4% increase in frames per second.

Once we turn on DirectX 11, we're left with only Radeon GPUs to test with. There's a fairly even step up from one card to the next, similar to what you see in a synthetic benchmark. Also, overclocking of the GPU failed to provide any real advantage here with DX11.
|
Product Series |
Stream Processors |
Core Clock (MHz) |
Shader Clock (MHz) |
Memory Clock (MHz) |
Memory Amount |
Memory Interface |
|
ASUS Radeon HD4850 (EAH4850 TOP) |
800 |
680 |
N/A |
1050 |
512MB GDDR3 |
256-bit |
|
ATI Radeon HD5770 (Engineering Sample) |
800 |
850 |
N/A |
1200 |
1.0GB GDDR5 |
128-bit |
|
XFX Radeon HD5830 (HD-583X-ZNFV) |
1120 |
800 |
N/A |
1000 |
1.0GB GDDR5 |
256-bit |
|
ASUS GeForce GTX 260 (ENGTX260 MATRIX) |
216 |
576 |
1242 |
999 |
896MB GDDR3 |
448-bit |
|
XFX Radeon HD5850 (21162-00-50R) |
1440 |
725 |
N/A |
1000 |
1.0GB GDDR5 |
256-bit |
|
MSI GeForce GTX 275 (N275GTX Twin Frozr OC) |
240 |
666 |
1476 |
1161 |
896MB GDDR3 |
448-bit |
|
ASUS GeForce GTX 285 (GTX285 MATRIX) |
240 |
662 |
1476 |
1242 |
1.0GB GDDR3 |
512-bit |
|
XFX Radeon HD5870 (HD-587X-ZNFC) |
1600 |
850 |
N/A |
1200 |
1.0GB GDDR5 |
256-bit |
|
PowerColor AX5870 (1GBD5-PPDHG2) |
1600 |
875 |
N/A |
1250 |
1.0GB GDDR5 |
256-bit |
|
PowerColor AX5870 (1GBD5-PPDHG2) |
1600 |
925 OC |
N/A |
1300 OC |
1.0GB GDDR5 |
256-bit |
In our next section, we investigate the thermal performance of the Radeon HD5830, and see if the gimped Cypress GPU die runs cool enough with the simple radial heatpipe cooler that XFX brings to bear on it.
PowerColor PCS+ AX5870 Temperature
It's hard to know exactly when the first video card got overclocked, and by whom. What we do know is that it's hard to imagine a computer enthusiast or gamer today that doesn't overclock their hardware. Of course, not every video card has the head room. Some products run so hot that they can't suffer any higher temperatures than they generate straight from the factory. This is why we measure the operating temperature of the video card products we test.
To begin testing, I use GPU-Z to measure the temperature at idle as reported by the GPU. Next I use FurMark 1.7.0 to generate maximum thermal load and record GPU temperatures at high-power 3D mode. The ambient room temperature remained stable at 24C throughout testing. The PowerColor PCS+ AX5870 video card recorded 36C in idle 2D mode, and increased to 79C after 20 minutes of stability testing in full 3D mode, at 1920x1200 resolution, and the maximum MSAA setting of 8X. With the fan set on Automatic, the speed rose from 11% at idle to 61% under full load. I then set the fan speed manually, using Catalyst Control Center, to 100% and ran the load test again, and the GPU reached a slightly lower maximum temperature of 70C.
|
Load |
Fan Speed |
GPU Temperature |
|
Idle |
11% - AUTO |
36C |
|
Furmark |
61% - AUTO |
79C |
|
Furmark |
100% - MANUAL |
70C |
79C is a good result for temperature stress testing, especially with such a powerful GPU, stock fan settings and fan speeds controlled by the card. It's not quite as good as the result on the Sapphire Vapor-X that Benchmark Reviews tested last year, but the test conditions are not identical, particularly the ambient temp, so direct comparisons are not really possible. I rarely do my benchmarking tests with fans set on Automatic, preferring to give the GPU or CPU the best shot at surviving the day intact. With an integrated temperature controller in play though, I want to show how the manufacturer programmed the system. 70C is obviously a better result, and running the fan on Manual at 100% is not unusual or unwarranted when running such a punishing benchmark as FurMark.
Load temps never got higher than 68C when running gaming benchmarks on Automatic fan settings, so the cooling system definitely does the job, and there is a lot of temperature headroom left for the GPU. With only a single axial fan running, the noise at 100% speed was noticeable, and had the typical sound characteristic for this fan type, but I wouldn't have any problem leaving it there while gaming. For normal usage patterns, I'd leave the fan settings on Auto. Unfortunately, due to the simple 2-wire DC motor controller, I can't tell you the actual RPMs produced, only the percentages that were reported in GPU-Z.
FurMark is an OpenGL benchmark that heavily stresses and overheats the graphics card with fur rendering. The benchmark offers several options allowing the user to tweak the rendering: fullscreen / windowed mode, MSAA selection, window size, duration. The benchmark also includes a GPU Burner mode (stability test). FurMark requires an OpenGL 2.0 compliant graphics card with lot of GPU power! As an oZone3D.net partner, Benchmark Reviews offers a free download of FurMark to our visitors.

FurMark does do two things extremely well: drive the thermal output of any graphics processor higher than any other application or video game, and it does so with consistency every time. While FurMark is not a true benchmark tool for comparing different video cards, it still works well to compare one product against itself using different drivers or clock speeds, or testing the stability of a GPU, as it raises the temperatures higher than any program. But in the end, it's a rather limited tool.
In our next section, we discuss electrical power consumption and learn how well (or poorly) each video card will impact your utility bill...
VGA Power Consumption
Life is not as affordable as it used to be, and items such as gasoline, natural gas, and electricity all top the list of resources which have exploded in price over the past few years. Add to this the limit of non-renewable resources compared to current demands, and you can see that the prices are only going to get worse. Planet Earth is needs our help, and needs it badly. With forests becoming barren of vegetation and snow capped poles quickly turning brown, the technology industry has a new attitude towards suddenly becoming "green". I'll spare you the powerful marketing hype that I get from various manufacturers every day, and get right to the point: your computer hasn't been doing much to help save energy... at least up until now.

To measure isolated video card power consumption, Benchmark Reviews uses the Kill-A-Watt EZ (model P4460) power meter made by P3 International. A baseline test is taken without a video card installed inside our computer system, which is allowed to boot into Windows and rest idle at the login screen before power consumption is recorded. Once the baseline reading has been taken, the graphics card is installed and the system is again booted into Windows and left idle at the login screen. Our final loaded power consumption reading is taken with the video card running a stress test using FurMark. Below is a chart with the isolated video card power consumption (not system total) displayed in Watts for each specified test product:
VGA Product Description(sorted by combined total power) |
Idle Power |
Loaded Power |
|---|---|---|
NVIDIA GeForce GTX 480 SLI Set |
82 W |
655 W |
NVIDIA GeForce GTX 590 Reference Design |
53 W |
396 W |
ATI Radeon HD 4870 X2 Reference Design |
100 W |
320 W |
AMD Radeon HD 6990 Reference Design |
46 W |
350 W |
NVIDIA GeForce GTX 295 Reference Design |
74 W |
302 W |
ASUS GeForce GTX 480 Reference Design |
39 W |
315 W |
ATI Radeon HD 5970 Reference Design |
48 W |
299 W |
NVIDIA GeForce GTX 690 Reference Design |
25 W |
321 W |
ATI Radeon HD 4850 CrossFireX Set |
123 W |
210 W |
ATI Radeon HD 4890 Reference Design |
65 W |
268 W |
AMD Radeon HD 7970 Reference Design |
21 W |
311 W |
NVIDIA GeForce GTX 470 Reference Design |
42 W |
278 W |
NVIDIA GeForce GTX 580 Reference Design |
31 W |
246 W |
NVIDIA GeForce GTX 570 Reference Design |
31 W |
241 W |
ATI Radeon HD 5870 Reference Design |
25 W |
240 W |
ATI Radeon HD 6970 Reference Design |
24 W |
233 W |
NVIDIA GeForce GTX 465 Reference Design |
36 W |
219 W |
NVIDIA GeForce GTX 680 Reference Design |
14 W |
243 W |
Sapphire Radeon HD 4850 X2 11139-00-40R |
73 W |
180 W |
NVIDIA GeForce 9800 GX2 Reference Design |
85 W |
186 W |
NVIDIA GeForce GTX 780 Reference Design |
10 W |
275 W |
NVIDIA GeForce GTX 770 Reference Design |
9 W |
256 W |
NVIDIA GeForce GTX 280 Reference Design |
35 W |
225 W |
NVIDIA GeForce GTX 260 (216) Reference Design |
42 W |
203 W |
ATI Radeon HD 4870 Reference Design |
58 W |
166 W |
NVIDIA GeForce GTX 560 Ti Reference Design |
17 W |
199 W |
NVIDIA GeForce GTX 460 Reference Design |
18 W |
167 W |
AMD Radeon HD 6870 Reference Design |
20 W |
162 W |
NVIDIA GeForce GTX 670 Reference Design |
14 W |
167 W |
ATI Radeon HD 5850 Reference Design |
24 W |
157 W |
NVIDIA GeForce GTX 650 Ti BOOST Reference Design |
8 W |
164 W |
AMD Radeon HD 6850 Reference Design |
20 W |
139 W |
NVIDIA GeForce 8800 GT Reference Design |
31 W |
133 W |
ATI Radeon HD 4770 RV740 GDDR5 Reference Design |
37 W |
120 W |
ATI Radeon HD 5770 Reference Design |
16 W |
122 W |
NVIDIA GeForce GTS 450 Reference Design |
22 W |
115 W |
NVIDIA GeForce GTX 650 Ti Reference Design |
12 W |
112 W |
ATI Radeon HD 4670 Reference Design |
9 W |
70 W |
The PowerColor PCS+ AX5870 pulled 27 (157-130) watts at idle and 253 (383-130) watts when running full out, using the test method outlined above. The idle power consumption test is right on the factory number of 27W, and the load value is 65W above the 188W factory spec from PowerColor. That's about normal for this test, as it isn't possible to isolate the CPU load from the power measurements. You also have to factor in the efficiency of the power supply, which changes at different load levels. I think it's fair to say that the card pulls every bit of the full load current that is specified by the manufacturer, and maybe a few watts beyond that.
So, no major surprises in the power consumption area; it's ATI's biggest GPU, running at high clock rates. A good thing it's built on 40nm technology, otherwise those two billion transistors would be pulling a lot more power and generating a lot more heat. I next offer you some final thoughts, and my conclusions. On to the next page...
Radeon HD 5870 Final Thoughts
The ATI Radeon HD 5870 has been king of the single-GPU hill for 6 months now. Fermi finally launched early this month, and cards are now winding their way into the retail channels. With 50% more transistors and an architecture that is able to use the shader cores for tessellation computing, the GTX480 almost always pulls ahead of the 5870 in gaming benchmarks, particularly DX11 titles. Some of the games that feature "TWIMTBP" still radically favor the NVIDIA architecture, even though the GF100 has evolved quite a bit from the GT200 of the last decade.
So, where does that leave the HD 5870? Last I heard, the word on everyone's lips was "Fermi = competition". Well, unfortunately, I don't see it happening any time soon. The GTX480 launched at $500, with 50% more transistors, about 25% better performance and a price that's 25% higher, give or take a few bucks. That's not competition for the HD 5870, that's a different price point. Tell me why ATI or their partners are going to lower their 5870 prices, because the GTX480 costs more, does more and sucks electricity like it's free or something. In fact, pricing on the lowest priced 5870 cards is up $10 since the Fermi launch. Maybe if NVIDIA launches a GTX475 we'll have a comparable card that will offer real competition. That also won't happen soon, because the Green Team needs to focus on filling out the lower price segments, where there's a much larger market to tap into.
By all accounts, it wasn't the drivers that delayed the release of Fermi, it was the hardware. The software developers actually had an extra couple of months to optimize the driver package before the products were released to the public. So I think you have to figure that ATI doesn't really have a 6-month lead on NVIDIA for their drivers. Still, beta testing is not the same thing as consumer usage, so from a "bug" standpoint, there is probably still some work to be done on the NVIDIA side. There are also some features that they will want to expand upon and refine as time goes on. As far as graphics performance goes, they're probably on equal footing for now.
It seems like ATI and NVIDIA typically produce only one set of drivers in any given year that gets universal acclaim from the user community. The other ten times, there is always a small group who are dreadfully unhappy and a sizeable number who say, "That was OK, but what I really want is..." There are also a large number of people who are genuinely happy with that particular update because it fixes the one thing that they were having trouble with. Unfortunately, there is a vocal minority that insists every driver update should improve performance by 15-20% over the last update. I don't know why they get as much press as they do, since they only incite confusion and disappointment for those who have recently joined the gaming community.

So, at the end of its six month reign as champion, I still think you can call the HD 5870 a viable leader in its segment. It has no competition at its price point and it runs cooler with less power consumption than the GT200 or GF100 GPUs from NVIDIA. Essentially, the Fermi introduction had absolutely no effect on the HD 5870 market position, and the GTX285 had already been blown into the weeds six months ago.
PowerColor PCS+ AX5870 Conclusion
The PowerColor PCS+ AX5870 easily improved on the basic performance levels set by the reference cards. That's important, because the AIB partners don't want to be in the position of degrading the performance capability just to save a few bucks. In almost every benchmark, the mild overclock that they incorporated improved gaming performance. Further proof that the 2nd generation card hasn't lost anything in translation is the increased performance I got by overclocking it even further. A 9% increase in clock rates, with no loss of stability or extreme temperatures is respectable, if not extraordinary.
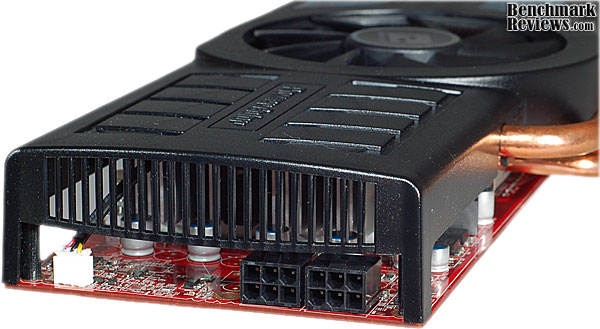
The appearance of the PowerColor PCS+ video cards is quite good. It follows the trend of partial shrouds with a central fan, but the routing of the heatpipes above ground, so to speak, adds some flair to the visual design. The image on the box cover makes it look like the shroud is done up to look like a race car; fortunately that's just artistic license. Although some may have issues with the height of the card, most gamers will have a case large enough to fit it without interference problems. There continues to be an abundance of creativity in the area of GPU cooling, and I expect to see more use of this heatpipe arrangement on cards with high thermal loads.

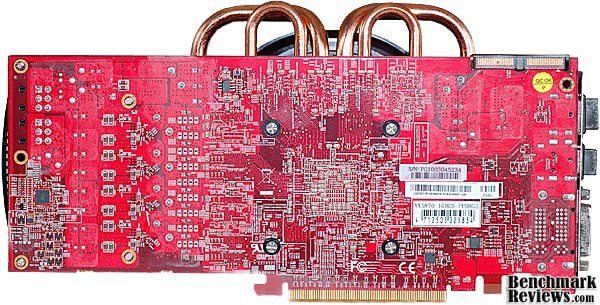
The build quality of the PowerColor PCS+ AX5870 was mixed. Everything is well put together, the overall assembly of the card is fully up to standard for this type of product, and the packaging was also first rate. That's the good part, now the bad: I usually say "assembly and soldering" together in this section, but there was a major solder defect present on the board. After testing, I removed it and looked carefully for any more defects; there were none. There was also some residue on the back surface of the board that should have been removed in a cleaning step at the end of the wave soldering process. These are not the sort of defects that a company like PowerColor should put up with; I expect they will either hound their board supplier to improve their quality, or find a new one. This kind of defect almost always produces infant failures or it does nothing at all, which was the case here.
The features of the HD 5870 may seem slightly less amazing, now that we've been using them on a whole host of Radeon 5xxx cards since last September. Still, no one else has an equivalent combination of features that compete fully with DirectX 11, Full ATI Eyefinity Support, ATI Stream Technology Support, DirectCompute 11, OpenCL Support, HDMI 1.3 with Dolby True HD and DTS Master Audio. We've barely scratched the surface of all the features in this review, focusing almost exclusively on gaming performance, but the card excels at other uses as well. This is an area that will change eventually, as NVIDIA ramps up the feature set of their product line with new capabilities. They just got their first working products out the door, now they can expand on some features as they release new driver packages.
As of mid April 2010, the price for the PowerColor PCS+ AX5870 is $409.99 at my favorite PC component supplier, Newegg. This is currently the lowest price on that site for an HD 5870 and the PowerColor card is the only one at that price. It's a simple fact to call that a good value.
The PowerColor PCS+ AX5870 earns a recommendation for pushing the design of the HD58xx series further down the path of increasing value. As a result, they've been able to undercut the pricing of most of the competition in the e-tail market with this new series of cards. The power supply is state-of-the-art in ways that make it smaller, cheaper and more efficient, not more complex. The cooling solution is more efficient than most, because of the innovative use of space and it cools the VRM section better than the reference design. With the exception of software voltage control, they've improved the stock performance of what was a high performance model to begin with. Were it not for the solder quality issues that showed up on this sample, the overall rating would clearly have been higher.
Pros:
+ Robust, modern power supply design runs cool
+ Unmatched feature set of HD 5xxx series
+ High value, lowest pricing
+ 1250 MHz Samsung GDDR5 memory
+ Easy to overclock with ATI Overdrive
+ Good cooling performance
+ Free Call of Duty: Modern Warfare 2 game
+ Driver updates have offered real improvements
+ The power to run ATI Eyefinity
Cons:
- Major quality problem with wave soldering process
- No software voltage control, limits OC abilities
- Fan noise unpleasant at 100%
- Still a few driver bugs to work out on the latest games
Ratings:
-
Performance: 9.75
-
Appearance: 9.25
-
Construction: 7.75
-
Functionality: 9.50
-
Value: 7.50
Final Score: 8.75 out of 10.
Quality Recognition: Benchmark Reviews Silver Tachometer Award.
Questions? Comments? Benchmark Reviews really wants your feedback. We invite you to leave your remarks in our Discussion Forum.
Related Articles:
- Ozone Radon 5K Laser Gaming Mouse
- Vendetta 2 vs TRUE vs HDT-S1283
- SilverStone Grandia SST-GD07B HTPC Enclosure
- Corsair Vengeance LP 16GB DDR3-1600
- XFX GeForce 8800 GTS 320MB XXX Edition Video Card
- CyberPower CP1500AVRLCD 1500VA 900W LCD UPS
- ASUS P6X58D-E Motherboard Performance
- ASUS P8Z77-V Deluxe Motherboard Components
- Lian Li PC-B20A Aluminum Mid-Tower ATX Case
- Antec P182 Performance One ATX Case

Comments
The solder joint on R639, tho may be intact, but I would hesitate to guess that given a bit more time, and temperature cycling that you'll have a dry joint on the upper left.
C658 & C660 seem to not have a good flow on the upper pad to the component, this should have been picked up in rework/inspection before it went in to the tester.
Though you say that even knowing those caps are on a 1mm grid, they are still HUGE components compared to whats out there and what I have worked with, 1mm gridding is still quite a large grid to work with.
Care to see the hi-res photos?
BTW, what component pitch is considered SOTA today?
Thanks for the feedback. FWIW, it's tough for the average person to even see this stuff. I have a 10X loupe, and it doesn't cut it. I have to go 2.5X with my Micro-Nikkor on a DSLR to see it properly.
BTDT
Thanks!
I am a little surprised by your experience with the ASUS model, they have been good cards for me...but nobody's perfect ALL the time.