PNY XLR8 PRO Solid State Drive Review
Manufacturer: PNY Technologies Inc.
Product Name: XLR8 PRO SSD
Model Number: SSD9SC120GCDA-RB (120GB), SSD9SC240GCDA-RB (240GB), SSD9SC480GCDA-RB (480GB)
UPC: 751492536248 (120GB), 751492536262 (240GB), 751492536286 (480GB)
Prices: 120GB (Newegg), 240GB (Newegg), 480GB (Newegg)
Full Disclosure: The product sample used in this article has been provided by PNY.
Not many Solid State Drive manufacturers offer a five-year full-replacement product warranty, but PNY does. Built in the USA, the PNY XLR8 PRO SSD series combines a second-generation LSI/SandForce SF-2281 SATA 6Gb/s controller with fast IMFT-branded NAND flash components to produce up to 85,000 IOPS. PNY has tweaked the XLR8 PRO SSD-series to deliver transfer speeds up to 550 MB/s read and 520 MB/s write. In this article Benchmark Reviews tests these claims, and compares XLR8 PRO SSD performance to competing storage solid-state solutions to find out which SSD is best.
The second-generation SF-2281 SSD processor maintains all of the original core technology SandForce originally introduced in the SF-1200 series, but now improves SSD performance with 20% faster IOPS and 40% faster sequential read/write throughput. They've enhanced BCH ECC capability, and the new processor now supports ATA-7 Security Erase. Finally, the new SF-2200 series implements cost-effective 20nm-class NAND flash from all leading flash vendors with Asynch/ONFi1/ONFi2/Toggle interfaces.

Solid State vs Hard Disk
Despite decades of design improvements, the hard disk drive (HDD) is still the slowest component of any personal computer system. Consider that modern desktop processors have a 1 ns response time (nanosecond = one billionth of one second), while system memory responds between 30-90 ns. Traditional hard drive technology utilizes magnetic spinning media, and even the fastest spinning mechanical storage products still exhibit a 9,000,000 ns / 9 ms initial response time (millisecond = one thousandth of one second). In more relevant terms, the processor receives the command and must then wait for system memory to fetch related data from the storage drive. This is why any computer system is only as fast as the slowest component in the data chain; usually the hard drive.
In a perfect world all of the components operate at the same speed. Until that day comes, the real-world goal for achieving optimal performance is for system memory to operate as quickly as the central processor and then for the storage drive to operate as fast as memory. With present-day technology this is an impossible task, so enthusiasts try to close the speed gaps between components as much as possible. Although system memory is up to 90x (9000%) slower than most processors, consider then that the hard drive is an added 1000x (100,000%) slower than that same memory. Essentially, these three components are as different in speed as walking is to driving and flying.
Solid State Drive technology bridges the largest gap in these response times. The difference a SSD makes to operational response times and program speeds is dramatic, and takes the storage drive from a slow 'walking' speed to a much faster 'driving' speed. Solid State Drive technology improves initial response times by more than 450x (45,000%) for applications and Operating System software, when compared to their mechanical HDD counterparts. The biggest mistake PC hardware enthusiasts make with regard to SSD technology is grading them based on bandwidth speed. File transfer speeds are important, but only so long as the operational IOPS performance can sustain that bandwidth under load.
Bandwidth Speed vs Operational Performance
As we've explained in our SSD Benchmark Tests: SATA IDE vs AHCI Mode guide, Solid State Drive performance revolves around two dynamics: bandwidth speed (MB/s) and operational performance (IOPS). These two metrics work together, but one is more important than the other. Consider this analogy: bandwidth determines how much cargo a ship can transport in one voyage, and operational IOPS performance is how fast the ship moves. By understanding this and applying it to SSD storage, there is a clear importance set on each variable depending on the task at hand.
For casual users, especially those with laptop or desktop computers that have been upgraded to use an SSD, the naturally quick response time is enough to automatically improve the user experience. Bandwidth speed is important, but only to the extent that operational performance meets the minimum needs of the system. If an SSD has a very high bandwidth speed but a low operational performance, it will take longer to load applications and boot the computer into Windows than if the SSD offered a higher IOPS performance.
Closer Look: PNY XLR8 PRO SSD
SSDs are quickly gaining popularity because they work equally well in PC, Linux, or Apple computers. Likewise, they easily install into both desktop and notebook platforms without modification. For this article Benchmark Reviews is testing the PNY XLR8 PRO Solid State Drive, which is specified to reach speeds of 550 MB/s for sequential reads and 520 MB/s sequential writes. The 240GB model we received for testing is built using the LSI/SandForce SF-2281 SSD controller and 25nm synchronous Intel-Micron NAND flash components. The PNY XLR8 PRO uses synchronous NAND flash components, which offers higher performance when compared to the asynchronous NAND flash inside other SSDs.

PNY offers several capacities for their XLR8 PRO-series solid state drives: 120GB, 240GB, and 480GB, with a SATA 6Gb/s cable included in each kit. The PNY XLR8 PRO measures 3.94"/100mm long, by 2.76"/70mm wide, by 0.37"/9.5mm tall. The PNY XLR8 PRO solid state drive is covered by a three-year warranty, plus two additional years with registration.
PNY XLR8 PRO-series SSDs are best suited for performance-orientated personal computers, and could also work well for SOHO computer workstation systems. LSI/SandForce SF-2200 series SSDs have been designed with a focus on high-performance operational and data transfer speeds, and includes 256-bit encrypted data protection with improved NAND wear-leveling through their proprietary DuraWrite technology.

PNY recognizes that once installed, the SSD will be hidden away from view inside a notebook computer or desktop workstation, so they've remained conservative towards the design of their solid state drive's appearance. Each half of the drive enclosure is given a textured finish, which does not reveal fingerprints or smudges like a glossy painted surface would. PNY branding is marked at the topside of the SSD enclosure, with a label attached to the bottom that denotes model and capacity.
Standard 2.5" drive bay mounting points are pre-drilled and threaded into the PNY XLR8 PRO SSD chassis, which allows for quick upgrade or addition into any existing notebook and other compact computer system. Using a universal 3.5" to 2.5" tray adapter (included with this kit), the SSD fits easily into desktop computers. The mounting positions matched up to the drive bracket on my notebook computer, and after only a few minutes I was booting from a restored Windows 7 System Image with ease.
Unlike most Hard Disk Drive (HDD) storage products, SSDs are nearly impervious to impact damage and do not require (or benefit from) any kind of special vibration dampening or shock-proof enclosures. PNY utilizes a standard two-piece metal enclosure for their XLR8 PRO-series SSDs, which reveals the internal components after removing four small counter-sunk screws located along the sides of this solid state drive. On the underside a screw is covered by a 'Warranty Void' label that is attached to warn consumers against taking apart their product. By removing the SSD cover it will also remove your consumer protection with it.

LSI/SandForce introduced their new second generation solid state drives to both consumer and enterprise segments, with seven different processor models to choose from. On the consumer (retail) side you've got models using the older SATA 3Gb/s interface as well as the latest SATA 6Gb/s interface, while all enterprise drives utilize the 3rd-generation SATA 6Gb/s interface. More than any other factor, it's the Flash Channels/Byte Lanes configuration that these separate models. LSI/SandForce's SF-2000 series of SSDs continue to feature up to 8 data channels organized into 16 Byte lanes; similar to the previous generation of SF-1222/SF-1565 series SSD controllers, but now some models are scaled down for usage scenarios not requiring massive IO activity.
On second-generation LSI/SandForce-driven SSDs, a new SATA 6Gb/s LSI/SandForce SF-2281VB1-SDC processor is part of their SF-2200 family of retail SSD controller chips, although and identical SF-2181 processor exists for older SATA 3Gb/s connections. Offering 8 flash channels with 8 Byte lanes configured (one lane per channel), the SF-2281 maintains a BGA-256 package whereas the top-end SF-2282 delivers two lanes per channel on a BGA-400 package. More detail is available in our LSI/SandForce SF-2000 Series SSD Processor Overview article.
LSI/SandForce SF-2281VB1-SDC Controller
All LSI/SandForce SSD controllers offer native TRIM garbage collection in supporting Operating System (such as Microsoft Windows-7), Native Command Queuing (NCQ) with 32 command slots, and basic Self-Monitoring, Analysis, and Reporting Technology (SMART) command set. LSI/SandForce built the SF-2200 series to produce 500 MB/s sequential read and write bandwidth with 60K (burst)/20K (sustained) IOPS random write (4K transfers). The firmware controls the performance variables on LSI/SandForce SSDs, and some manufacturers have licensed custom firmware to unlock additional performance for their products.
The SF-2200 SSD processor provides enhanced ECC with BCH data protection, and also includes LSI/SandForce's unique RAISE (Redundant Array of Independent Silicon Elements) technology. RAISE provides the protection and reliability of RAID on a single SSD drive, thanks to flash architecture, without the significant write overhead of parity. The LSI/SandForce DuraClass technology automatically stores data using Trusted Computing Group (TCG) OPAL security with 256-bit AES encryption and automatic, line-rate double encryption with a drive-level password, preventing data extraction directly from the physical flash memory modules.

Micron 29F128G08CFAAB Synchronous NAND Flash
LSI/SandForce processors enable support for advanced 30nm- and 20nm-class NAND flash from all leading flash vendors with synch/asynch/ONFi1/ONFi2/toggle interfaces that offer data transfer rates up to 166 Mega Transfers per second. Their latest generation of controllers also offers advanced ECC engine correcting up to 55 bits per 512-byte sector to assure high data integrity and support for future generations of flash memory. On the 240GB PNY XLR8 PRO solid state drive, sixteen multi-layer cell Intel/Micron Flash Technology (IMFT) 29F16B08CCME3 synchronous NAND Flash modules are joined to the LSI/SandForce SF-2281 controller.
PNY XLR8 PRO Features
XLR8 PRO SSDs feature a 2.5" SATA III, 6Gbps interface, support 128-bit AES encryption and is powered by the SandForce 2281 controller, offering up to 550MB/s seq. read, 520MB/s seq. write speeds, and 85,000 random read/write IOPS. Manufactured in the USA and designed for gaming, photo/video applications and faster system performance for quick OS booting and program launching.
- Better endurance, enthusiast edition
- Shock proof, no moving parts, low power consumption
- 5-Year Warranty (3 years plus 2 additional years with registration at https://www3.pny.com/homepage.aspx)
Source: PNY Technologies Inc.
SSD9SC240GCDA-RB Specifications
| RELIABILITY/SECURITY |
| MTBF |
1.2 million hours |
| Data Fail Recovery |
Recovers data from up to one NAND flash block
(available on 120GB and up) |
| Data Path Protection |
ECC: Up to 55 bits correctable per 512-byte sector |
| Data Reliability |
Read unrecoverable bit error rate (UBER) 10e-16 |
| Data Encryption |
128-bit AES-compliant |
| Product Health Monitoring |
Self-Monitoring, Analysis and Reporting Technology (SMART) Support |
| ADDITIONAL FEATURES |
| Performance Optimization |
TRIM (requires OS support) |
| Service & Support |
5-Year Warranty (3 years plus 2 additional years with registration at https://www3.pny.com/homepage.aspx) |
| PERFORMANCE |
| Max Read |
up to 550 MB/s |
| Max Write |
up to 520 MB/s |
| Random Read/Write Operations (4kB) |
up to 85,000 IOPS |
| COMPATIBILITY |
| Serial ATA |
Fully compliant with Serial ATA International Organization: Serial ATA Revision 3.0. Fully compliant with ATA/ATAPI-8 Standard Native Command Queuing (NCQ) |
| Operating System |
Windows XP 32-bit / 64-bit; Windows Vista 32-bit / 64-bit; Windows 7 32-bit / 64-bit; Linux; Mac OS X |
| Power Requirements |
Standard SATA Power Connector |
| ENVIRONMENTAL |
| Power Consumption |
5W Typical, 0.1W Idle |
| Ambient Temperature |
0°C ~ 55°C |
| Operating Temperature |
0°C ~ 70°C |
| Storage Temperature |
-45°C ~ 85°C |
| Certifications |
RoHS, CE, FCC, REACH, BEMI, UL |
| PHYSICAL |
| Usable Capacities* (IDEMA) |
240 GB |
| Controller |
SandForce 2281 |
| NAND Components |
Synchronous-Mode 3K P/E rated Multi-Level Cell (MLC) |
| Interface |
Serial ATA 6Gb/s* (SATA III) |
| Form Factor |
2.5 inch |
| Dimensions (L x W x H) |
100 x 70 x 9.5 mm |
| Weight |
80g |
Source: PNY Technologies Inc.
SSD Testing Methodology
Solid State Drives have traveled a long winding course to finally get where they are today. Up to this point in technology, there have been several key differences separating Solid State Drives from magnetic rotational Hard Disk Drives. While the DRAM-based buffer size on desktop HDDs has recently reached 64 MB and is ever-increasing, there is still a hefty delay in the initial response time. This is one key area in which flash-based Solid State Drives continually dominates because they lack moving parts to "get up to speed".
However the benefits inherent to SSDs have traditionally fallen off once the throughput begins, even though data reads or writes are executed at a high constant rate whereas the HDD tapers off in performance. This makes the average transaction speed of a SSD comparable to the data burst rate mentioned in HDD tests, albeit usually lower than the HDD's speed.
Comparing a Solid State Disk to a standard Hard Disk Drives is always relative; even if you're comparing the fastest rotational spindle speeds. One is going to be many times faster in response (SSDs), while the other is usually going to have higher throughput bandwidth (HDDs). Additionally, there are certain factors which can affect the results of a test which we do our best to avoid.
SSD Testing Disclaimer
Early on in our SSD coverage, Benchmark Reviews published an article which detailed Solid State Drive Benchmark Performance Testing. The research and discussion that went into producing that article changed the way we now test SSD products. Our previous perceptions of this technology were lost on one particular difference: the wear leveling algorithm that makes data a moving target. Without conclusive linear bandwidth testing or some other method of total-capacity testing, our previous performance results were rough estimates at best.
Our test results were obtained after each SSD had been prepared using DISKPART or Sanitary Erase tools. As a word of caution, applications such as these offer immediate but temporary restoration of original 'pristine' performance levels. In our tests, we discovered that the maximum performance results (charted) would decay as subsequent tests were performed. SSDs attached to TRIM enabled Operating Systems will benefit from continuously refreshed performance, whereas older O/S's will require a garbage collection (GC) tool to avoid 'dirty NAND' performance degradation.
It's critically important to understand that no software for the Microsoft Windows platform can accurately measure SSD performance in a comparable fashion. Synthetic benchmark tools such as ATTO Disk Benchmark and Iometer are helpful indicators, but should not be considered the ultimate determining factor. That factor should be measured in actual user experience of real-world applications. Benchmark Reviews includes both bandwidth benchmarks and application speed tests to present a conclusive measurement of product performance.
Test System
- Motherboard: ASUS P8P67 EVO (Intel P67 Sandy Bridge Platform, B3 Stepping)
- Processor: Intel Core i7-2600K 3.4 GHz Quad-Core CPU
- System Memory: 4GB Dual-Channel DDR3 1600MHz CL6-6-6-18
- SATA 6Gb/s Storage HBA: Integrated Intel P67 Controller
- AHCI mode - Intel Rapid Storage Technology Driver 11.7.0.1013
- SATA 3Gb/s Storage HBA: Integrated Intel P67 Controller
- AHCI mode - Intel Rapid Storage Technology Driver 11.7.0.1013
- Operating System: Microsoft Windows 7 Ultimate Edition 64-Bit with Service Pack 1
Storage Hardware Tested
The following storage hardware has been used in our benchmark performance testing, and may be included in portions of this article:
Test Tools
- AS SSD Benchmark 1.6.4067.34354: Multi-purpose speed and operational performance test
- ATTO Disk Benchmark 2.46: Spot-tests static file size chunks for basic I/O bandwidth
- CrystalDiskMark 3.0.1a by Crystal Dew World: Sequential speed benchmark spot-tests various file size chunks
- Iometer 1.1.0 (built 08-Nov-2010) by Intel Corporation: Tests IOPS performance and I/O response time
- Lavalys EVEREST Ultimate Edition 5.50: Disk Benchmark component tests linear read and write bandwidth speeds
- Futuremark PCMark Vantage 1.02: HDD Benchmark Suite tests real-world drive performance
Test Results Disclaimer
This article utilizes benchmark software tools to produce operational IOPS performance and bandwidth speed results. Each test was conducted in a specific fashion, and repeated for all products. These test results are not comparable to any other benchmark application, neither on this website or another, regardless of similar IOPS or MB/s terminology in the scores. The test results in this project are only intended to be compared to the other test results conducted in identical fashion for this article.
AS-SSD Benchmark
Alex Schepeljanski of Alex Intelligent Software develops the free AS SSD Benchmark utility for testing storage devices. The AS SSD Benchmark tests sequential read and write speeds, input/output operational performance, and response times. Because this software receives frequent updates, Benchmark Reviews recommends that you compare results only within the same version family.
Beginning with sequential transfer performance, the PNY XLR8 PRO solid state drive produced speeds up to 504.21 MB/s for reads and 314.89 MB/s writes. Because this benchmark uses compressed data, sequential file transfer speeds are reported lower than with other tools using uncompressed data. For this reason, we will concentrate on the operational IOPS performance for this section. Single-threaded 4K IOPS performance tests deliver 21.06 MB/s read and 62.70 MB/s write, while the 64-thread 4K reads recorded 214.97 MB/s and write performance was 239.40 MB/s.

AS-SSD 64-thread 4KB IOPS performance results are displayed in the chart below, which compares several enthusiast-level storage products currently on the market. In these 64-thread 4KB IOPS performance tests the PNY XLR8 PRO-series outperformed many other SSDs, even surpassing OCZ's Vertex 3 Max IOPS Edition SSD built with the same controller. The chart below is sorted by total combined performance, which helps illustrate which products offer the best operational input/output under load:

In the next section, Benchmark Reviews tests transfer rates using ATTO Disk Benchmark.
ATTO Disk Benchmark
The ATTO Disk Benchmark program is free, and offers a comprehensive set of test variables to work with. In terms of disk performance, it measures interface transfer rates at various intervals for a user-specified length and then reports read and write speeds for these spot-tests. There are some minor improvements made to the 2.46 version of the program that allow for test lengths up to 2GB, but all of our benchmarks are conducted with 256MB total length. ATTO Disk Benchmark requires that an active partition be set on the drive being tested. Please consider the results displayed by this benchmark to be basic bandwidth speed performance indicators.

ATTO Disk Benchmark: Queue Depth 4 (Default)
Our bandwidth speed tests begin with the PNY XLR8 PRO solid state drive attached to the Intel P67-Express SATA 6Gb/s controller operating in AHCI mode. Using the ATTO Disk Benchmark tool, the test drive performs basic file transfers ranging from 0.5 KB to 8192 KB. This 240GB model reports 559 MBps maximum read speeds that plateau from about 1024-8192 KB file chunks, and 533 MBps peak write bandwidth plateaus from 128-8192 KB. These results slightly exceed PNY's own performance specifications of 550/530 MBps for the PNY XLR8 PRO series.

In the next section, Benchmark Reviews tests sequential performance using the CrystalDiskMark 3.0 software tool...
CrystalDiskMark 3.0 Tests
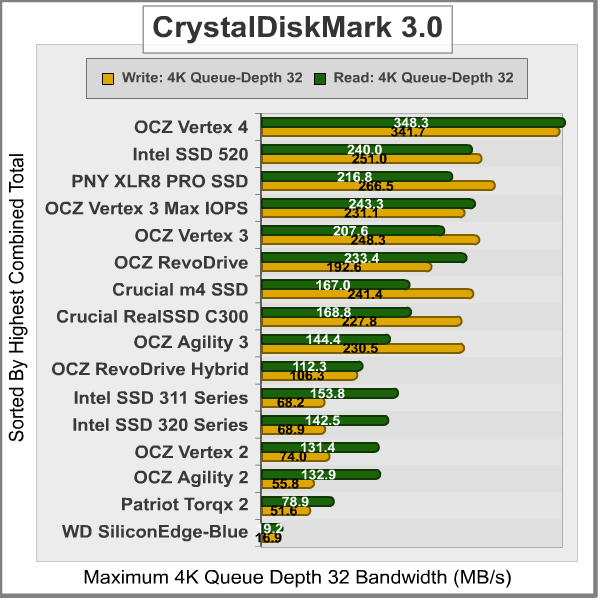
CrystalDiskMark 3.0 is a file transfer and operational bandwidth benchmark tool from Crystal Dew World that offers performance transfer speed results using sequential, 512KB random, and 4KB random samples. For our test results chart below, the 4KB 32-Queue Depth read and write performance was measured using a 1000MB space. CrystalDiskMark requires that an active partition be set on the drive being tested, and all drives are formatted with NTFS on the Intel P67 chipset configured to use AHCI-mode. Benchmark Reviews uses CrystalDiskMark to illustrate operational IOPS performance with multiple threads. In addition to our other tests, this benchmark allows us to determine operational bandwidth under heavy load.
CrystalDiskMark uses compressed data in its benchmark tests, so sequential file transfer speeds appear lower compared to those tested with other tools using uncompressed data. This section concentrates on operational IOPS performance using compressed data.
CrystalDiskMark 3.0 reports sequential speeds reaching 492.5 MB/s reads and 326.4 MB/s writes on the PNY XLR8 PRO. 512K test results reached 425.1 MB/s read and 319.7 MB/s write performance. 4K tests produced 32.62 read and 78.07 write performance. All of these results are significantly better than many previous generation solid state drive storage products.

Maximum 4KB IOPS performance results at queue depth 32 are reported in the chart below. These values represent the performance levels for several enthusiast-level storage solutions, and illustrates which products offer the best operational performance under load:
In the next section, we continue our testing using Iometer to measure input/output performance...
Iometer IOPS Performance
Iometer is an I/O subsystem measurement and characterization tool for single and clustered systems. Iometer does for a computer's I/O subsystem what a dynamometer does for an engine: it measures performance under a controlled load. Iometer was originally developed by the Intel Corporation and formerly known as "Galileo". Intel has discontinued work on Iometer, and has gifted it to the Open Source Development Lab (OSDL). There is currently a new version of Iometer in beta form, which adds several new test dimensions for SSDs.
Iometer is both a workload generator (that is, it performs I/O operations in order to stress the system) and a measurement tool (that is, it examines and records the performance of its I/O operations and their impact on the system). It can be configured to emulate the disk or network I/O load of any program or benchmark, or can be used to generate entirely synthetic I/O loads. It can generate and measure loads on single or multiple (networked) systems.
To measure random I/O response time as well as total I/O's per second, Iometer is set to use 4KB file size chunks over a 100% random sequential distribution at a queue depth of 32 outstanding I/O's per target. The tests are given a 50% read and 50% write distribution. While this pattern may not match traditional 'server' or 'workstation' profiles, it illustrates a single point of reference relative to our product field.
All of our SSD tests used Iometer 1.1.0 (build 08-Nov-2010) by Intel Corporation to measure IOPS performance, using a SandForce-created QD30 configuration: 4KB 100 Random 50-50 Read and Write.icf. The chart below illustrates combined random read and write IOPS over a 120-second Iometer test phase, where highest I/O total is preferred:

In our Iometer tests, which are configured to use 32 outstanding I/O's per target and random 50/50 read/write distribution, SandForce SSDs generally outperform the competition when tested with this large queue depth. The OCZ Vertex 4 SSD delivered the best combined IOPS performance we've seen from any SATA-based SSD with 83,494, followed by the 240GB OCZ Vertex 3 Max IOPS Edition with 83,117 IOPS, then the Intel SSD 520 Series At 80,433 peak combined IOPS. This 240GB PNY XLR8 PRO solid state drive kept pace with the leaders, delivering 74,179 combined IOPS. All of our top performers deliver I/O far beyond the needs of multi-tasking power users and hardcore gamers, and would be ideal for systems running several virtual machines.
In our next section, we test linear read and write bandwidth performance and compare its speed against several other top storage products using EVEREST Disk Benchmark. Benchmark Reviews feels that linear tests are excellent for rating SSDs, however HDDs are put at a disadvantage with these tests whenever capacity is high.
EVEREST Disk Benchmark
Many enthusiasts are familiar with the Lavalys EVEREST benchmark suite, but very few are aware of the Disk Benchmark tool available inside the program. The EVEREST Disk Benchmark performs linear read and write bandwidth tests on each drive, and can be configured to use file chunk sizes up to 1MB (which speeds up testing and minimizes jitter in the waveform). Because of the full sector-by-sector nature of linear testing, Benchmark Reviews endorses this method for testing SSD products, as detailed in our Solid State Drive Benchmark Performance Testing article. However, Hard Disk Drive products suffer a lower average bandwidth as the capacity draws linear read/write speed down into the inner-portion of the disk platter. EVEREST Disk Benchmark does not require a partition to be present for testing, so all of our benchmarks are completed prior to drive formatting.
Linear disk benchmarks are superior bandwidth speed tools in my opinion, because they scan from the first physical sector to the last. A side affect of many linear write-performance test tools is that the data is erased as it writes to every sector on the drive. Normally this isn't an issue, but it has been shown that partition table alignment will occasionally play a role in overall SSD performance (HDDs don't suffer this problem).

The high-performance storage products we've tested with EVEREST Disk Benchmark are connected to the Intel P67-Express SATA 6Gb/s controller and use a 1MB block size option. Read performance on the PNY XLR8 PRO solid state drive measured average speeds of 491.4 MB/s, with a maximum peak speed of 512.6 MB/s. Almost all SF-2281 SSDs we've tested begin the test at SATA 3Gb/s speeds before peaking, just as the PNY XLR8 PRO does before maintaining a 505 MB/s pace. Everest linear write-to tests were next...

The waveform chart above illustrates how well the PNY XLR8 PRO managed file transfers, making linear write performance appears very consistent. PNY's XLR8 PRO solid state drive recorded an average linear write-to speed of 476.3 MB/s, with maximum performance reaching 482.0 MB/s. The chart below shows the average linear read and write bandwidth speeds for a cross-section of storage devices tested with EVEREST:
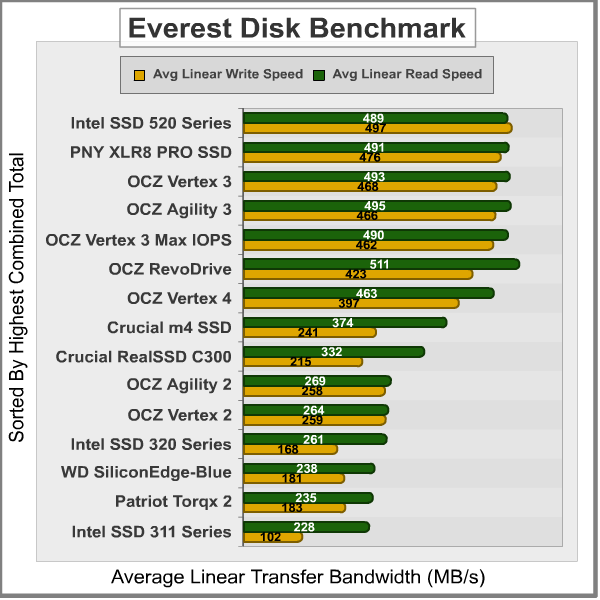
Linear tests are an important tool for comparing bandwidth speed between storage products - although HDD products suffer performance degradation over the span of their areal storage capacity. Linear bandwidth certainly benefits the Solid State Drive, since there's very little fluctuation in transfer speed. This is because Hard Disk Drive products decline in performance as the spindle reaches the inner-most sectors on the magnetic platter, away from the fast outer edge.
In the next section we use PCMark Vantage to test real-world performance...
PCMark Vantage HDD Tests
PCMark Vantage is an objective hardware performance benchmark tool for PCs running 32- and 64-bit versions of Microsoft Windows Vista or Windows 7. PCMark Vantage is well suited for benchmarking any type of Microsoft Windows Vista/7 PC: from multimedia home entertainment systems and laptops, to dedicated workstations and high-end gaming rigs. Benchmark Reviews has decided to use the HDD Test Suite to demonstrate simulated real-world storage drive performance in this article.
PCMark Vantage runs eight different storage benchmarks, each with a specific purpose. Once testing is complete, results are given a PCMark score while and detailed results indicate actual transaction speeds. The 240GB PNY XLR8 PRO solid state drive produced a total PCMark Vantage (secondary disk) HDD Test Suite score of 51997, with specific speeds reported below:

Our tests were conducted on an Intel P67-Express Sandy Bridge motherboard using the onboard native SATA 6Gb/s controller with 64-bit Windows 7. Performance results are displayed in the chart below:

In the next section, I share my review conclusion and final product rating.
PNY XLR8 PRO SSD Conclusion
IMPORTANT: Although the rating and final score mentioned in this conclusion are made to be as objective as possible, please be advised that every author perceives these factors differently at various points in time. While we each do our best to ensure that all aspects of the product are considered, there are often times unforeseen market conditions and manufacturer changes which occur after publication that could render our rating obsolete. Please do not base any purchase solely on our conclusion, as it represents our product rating specifically for the product tested which may differ from future versions. Benchmark Reviews begins our conclusion with a short summary for each of the areas that we rate.
Compared to toggle and asynchronous components used in older solid state products, synchronous NAND flash used in new products like the PNY XLR8 PRO represent the future of consumer-level solid state drives. Not only are these components fast, but they maintain better performance throughout the product's lifetime. Compared to toggle and asynchronous NAND flash, synchronous components resist performance degradation as storage capacity is filled. Add this to an already-impressive SandForce SF-2281 solid state processor, and there's a good chance you'll have enough speed and performance to last the drive's lifetime.
Our performance rating considers how effective the PNY XLR8 PRO solid state drive performs in operations against direct competitor storage solutions. For reference, SandForce specifies the SF-2281 controller capable of 500 MB/s maximum read/write speeds, which PNY increases to 550/520 MB/s read/write for uncompressed data on all XLR8 PRO models. In our storage benchmark tests, the PNY XLR8 PRO solid state drive (model SSD9SC240GCDA-RB) performed at or above this speed, and competed with the fastest products previously tested. Our test results proved the PNY XLR8 PRO was good for delivering 559/533 MBps peak read/writes speeds using ATTO Disk Benchmark. Linear testing with Everest Disk Benchmark produced 491/476 MB/s, placing the PNY XLR8 PRO at the top of our SATA SSD results.
The 240GB retail kit sent us for testing advertises up to 85,000 maximum combined IOPS, although it is unclear what tools were used to produce this figure. Using a SandForce-provided configuration for our own Iometer operational performance tests, we used a queue depth of 32 outstanding I/O's per target that measured 74,179 combined IOPS performance. In this test, the PNY XLR8 PRO performed well and positioned itself among the highest-I/O products. In the 4K 32QD tests with AS-SSD and CrystalDiskMark, the PNY XLR8 PRO continued to match up to enthusiast storage solutions like the OCZ Vertex 3 Max IOPS Edition.
Solid State Drives are low-visibility products: you see them just long enough to install and then they're forgotten. Like their Hard Disk Drive counterparts, SSDs are meant to place function before fashion. Anything above and beyond a simple metal shell is already more than what's expected in terms of the appearance. PNY uses a textured metal finish on their XLR8 PRO-series SSDs, which hides smudges and fingerprints very well. As solid state storage controllers become faster and more advanced, heat dissipation through the enclosure walls may demand that chassis designs become more beneficial than they previously needed to be. This isn't the case yet, and a metal chassis suits SandForce SSDs nicely.
Construction is probably the strongest feature credited to the entire SSD product segment, and PNY believes their XLR8 PRO-series is no exception. The PNY XLR8 PRO solid state drive is covered by an industry leading five-year warranty (three years standard warranty, plus two additional years with registration at https://www.pny.com/). Aside from a fairly extensive FAQ section, there are no online discussion forums, technical support chat, or local telephone service numbers available.
Because so many SandForce products are physically identical to each another, the overall value tends to focus on price, warranty, and customer support. As of mid-October 2012, the PNY XLR8 PRO solid state drive is available online in the following capacities and prices:
- 120GB Model SSD9SC120GCDA-RB: $130 (Newegg)
- 240GB Model SSD9SC240GCDA-RB: $205 (Newegg)
- 480GB Model SSD9SC480GCDA-RB: $460 (Newegg)
XLR8 PRO's 2nd-generation LSI/SandForce SF-2281 SSD controller delivered performance among the fastest SATA-based storage solutions we've tested, but like many hardware enthusiasts I am more concerned about solid state drive durability. Of the SSDs that have failed on me in the past, most problems occur after the product warranty expires. PNY's standard three years product warranty is better than most, especially since most failures occur in the first year, but by merely registering your solid state product it receives an extended five-year warranty. For its top-level performance, reasonable price, and 5-year extended product warranty, the PNY XLR8 PRO solid state drive series earns our Golden Tachometer Award for excellence.
Pros:
+ Outstanding 559/533 MBps read/write speed with ATTO
+ Produced 74,179 combined 4K IOPS
+ Among the fastest SATA-based SSDs available
+ TCG OPAL security with 256-bit AES encryption
+ Uses synchronous NAND flash components
+ SandForce SF-2281 processor supports TRIM, SMART, and RAISE
+ DuraWrite technology extends NAND lifetime
+ Enthusiast-level operational I/O performance
+ 5-Year extended PNY product warranty support
+ Available in 120/240/480GB storage capacities
+ Lightweight compact storage solution
+ Resistant to extreme shock impact
+ Low power consumption may extend battery life
Cons:
- Limited community support
- Expensive enthusiast-level product
Ratings:
- Performance: 9.75
- Appearance: 9.00
- Construction: 9.75
- Functionality: 9.50
- Value: 8.00
Final Score: 9.0 out of 10.
Excellence Achievement: Benchmark Reviews Golden Tachometer Award.
Benchmark Reviews invites you to leave constructive feedback below, or ask questions in our Discussion Forum.
Related Articles:
|


Comments
They each have a 3 year warranty. Not 5 years as you've stated.
NewEgg also doesn't even sell the 240GB XLR8 Pro SSD. The link you gave is for a completely different PNY SSD.
And yes, NewEgg did sell the 240GB XLR8 Pro SSD in November of 2012, when you posted that message. I know because I bought and installed three of them. And now,a year later, it's on sale for $129.
#newegg.com/Product/Product.aspx?Item=20-178-453&nm_mc=EMC-GD121813&cm_mmc=EMC-GD121813-_-index-_-Item-_-20-178-453
I bought a few XLR8 GTX-570s and they have turned out to be excellent video cards.