| MSI N550GTX-Ti Cyclone-II OC Video Card |
| Reviews - Featured Reviews: Video Cards | |||||||||||||||||||||||||||||||||||||||||||||||||||||||||||||||||||||||||||||||||||||||||||||||||||||||||||||||||||||||||||||||||||||||||||||||||||||||||||||||||||||||||||||||||||||||||||||||||||||||||||||||||||||||||||||||||||||||||||||||||||||||||||||||||||||||||||||||||||||||||||||||||||||||||||||||||||||||||||||||||||||||||||||||||||||||||||||||||||||||||||||||||||||||||||||||||||||||||||||||||||||||||||||||||||||||||||||||||||||||||||||||||||||||||||||||||||||||||||||||||||||||||||||||||||||||||||||||||||||||||||||||||||||||||||||||||||||||||||||||||||||||||||||||||||||||||||||||||||||||||||||
| Written by Steven Iglesias-Hearst | |||||||||||||||||||||||||||||||||||||||||||||||||||||||||||||||||||||||||||||||||||||||||||||||||||||||||||||||||||||||||||||||||||||||||||||||||||||||||||||||||||||||||||||||||||||||||||||||||||||||||||||||||||||||||||||||||||||||||||||||||||||||||||||||||||||||||||||||||||||||||||||||||||||||||||||||||||||||||||||||||||||||||||||||||||||||||||||||||||||||||||||||||||||||||||||||||||||||||||||||||||||||||||||||||||||||||||||||||||||||||||||||||||||||||||||||||||||||||||||||||||||||||||||||||||||||||||||||||||||||||||||||||||||||||||||||||||||||||||||||||||||||||||||||||||||||||||||||||||||||||||||
| Tuesday, 15 March 2011 | |||||||||||||||||||||||||||||||||||||||||||||||||||||||||||||||||||||||||||||||||||||||||||||||||||||||||||||||||||||||||||||||||||||||||||||||||||||||||||||||||||||||||||||||||||||||||||||||||||||||||||||||||||||||||||||||||||||||||||||||||||||||||||||||||||||||||||||||||||||||||||||||||||||||||||||||||||||||||||||||||||||||||||||||||||||||||||||||||||||||||||||||||||||||||||||||||||||||||||||||||||||||||||||||||||||||||||||||||||||||||||||||||||||||||||||||||||||||||||||||||||||||||||||||||||||||||||||||||||||||||||||||||||||||||||||||||||||||||||||||||||||||||||||||||||||||||||||||||||||||||||||
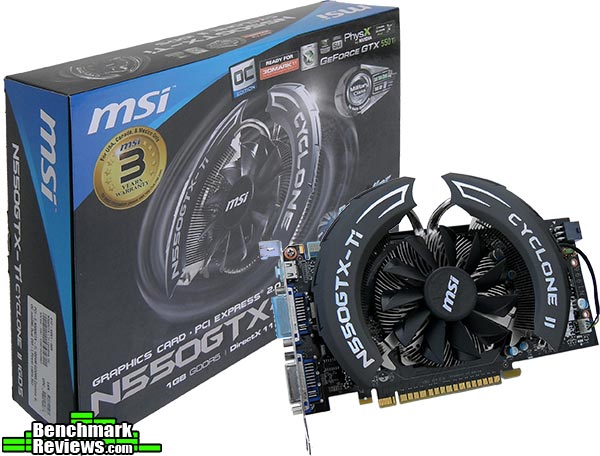
MSI N550GTX-Ti Cyclone-II OC Video Card
Manufacturer: MSI Full Disclosure: The product sample used in this article has been provided by MSI. NVIDIA have completely blown away their previous generation GPU's with the introduction of the 5xx line up and now it is the turn of the GTX550-Ti to show the world what it is made of. Rumours of the specifications suggesting the GTX550-Ti is just an overclocked GTS 450 have been around for a while now but all the details have not quite been correct. The MSI N550GTX-Ti Cyclone II OC video card looks a whole lot like its predecessor but as we have seen with the previous 5xx video cards the revised GF1xx GPU easily out performs its counterpart. Also working in the favor of the GTX550-Ti is the 192-bit wide memory interface giving MSI N550GTX-Ti Cyclone II OC video card 103.2GB/s memory bandwidth, which is closer to the GTX460 than the GTS450. Price wise the GTX550-Ti will fit in just nicely between the GTX460 and GTS450 and the Radeon HD5770, so let's find out where it fits performance wise. Benchmark Reviews aims to provide you with an unbiased review of the MSI N550GTS-Ti Cyclone II OC and report back our findings, keeping you informed on the latest technologies available on the market today.
For this review we will be comparing the MSI N550GTX-Ti Cyclone II OC to the VisionTek Killer HD5770, ASUS GTS450 DirectCU OC and GTX460 video cards in our usual mixture of DX10 / DX11 synthetic benchmarks and current games to get a good idea where it fits in performance and price wise. We also intend to overclock the GPU to its limits and see if the Cyclone II cooler with its improved fan design has what it takes to cool a GPU effectively, so without further delay let's move on and get stuck in. Closer Look: MSI N550GTX-Ti Cyclone II OCLet's take a good look at the MSI N550GTX-Ti Cyclone II OC video card. The PCB is 8.5 inches long by 4 inches tall and the cooler shroud hangs over another 1.5" and makes the total height 5.5 inches. Definitely something to consider if space is tight, but I expect most will have no problems.
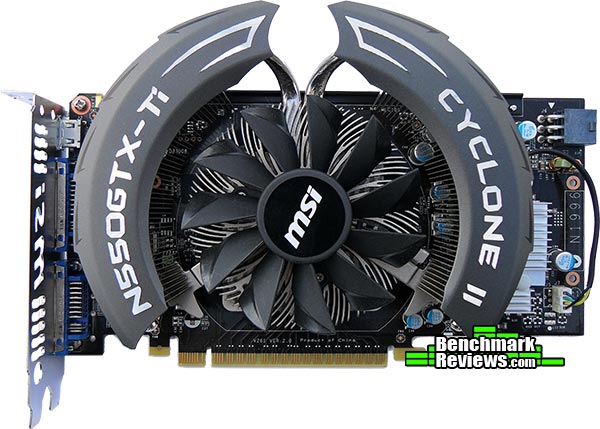
The MSI Cyclone II cooler is very similar to the previous generation MSI Cyclone cooler, it extends on the NVIDIA reference design cooler and does away with the plastic shroud and exhausts hot air inside your case rather than through the rear PCI bracket. The main upgrade on this cooler unit is the fan itself rather than the heatsink, MSI claim that this new fan provides 20% more airflow and that this airflow also covers more area.
Looking from another angle we can see that this card only requires one 6-pin PCI-E power connector. It is also good to see the VRM section being actively cooled, this is very useful when it comes to overclocking time. Also we can see here that the fan is a 4-pin PWM controlled fan.
From this angle we see only one SLI finger so 2-way SLI is all you will get from the NVIDIA GeForce GTX550-Ti.
For output we have a mini HDMI connector and two DVI-I connectors, bundled with the card you get a mini HDMI to HDMI adapter and a DVI to D-SUB adapter, so as far as connectors go MSI has pretty much covered all the bases here. The top half of the PCI bracket is vented and we have a nice MSI logo cut out, but the design of the cooler exhausts the hot air inside the case rather than out here.
The Cyclone II cooler is 1 inch tall and makes the N550GTX-Ti a dual slot card. I took this shot like this to show you how this card would look when it is installed in your case, MSI have used a feature last seen by myself on the ASUS GTS 450 DirectCU OC video card. If you haven't noticed it already it's the black bar (with MSI logo) running down the spine of the PCB which really adds to the aesthetics of the card when it is installed inside a windowed case. MSI N550GTX-Ti Cyclone II OC DetailsIn this section we shall take an in depth look at the MSI N550GTX-Ti Cyclone II OC video card and see what makes it tick.
With the cooler assembly removed we can get a better look at the board, you can't see it too we here but the MSI card builders used way more thermal interface than I would consider necessary. The layout of the capacitors and chokes looks a little disorganised but when you have all to cram all of those components on to a small PCB you can't be picky with layout designs. All in all the PCB looks good with no real waste of space and the soldering quality is of a very high standard as you will see in the close-up shots further down the page.
The back of the PCB is utilised mainly for resistors and the soldering quality is excellent for such tiny components, man loses the war to the machine when it comes to detailed work like this. There are extra pads for more RAM chips but I think any more memory over the current 1GB would be overkill for the GTX550-Ti.
Looking closer now at the Cyclone II cooler (the fan in particular) we see that the edges of the fan blades have a smooth black gloss finish which are set at a slight angle to the blades themselves. MSI claim this design generates 20% more airflow than traditional design and that the airflow covers more area too. Another bold claim by MSI is that this cooler is 23°C cooler than the reference design, but doesn't state whether this difference is measured at idle or under load.
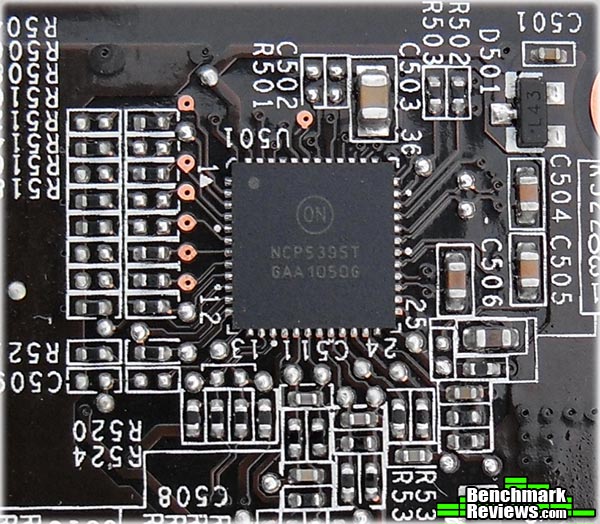
For voltage control MSI have utilized an ON semiconductor NCP5395T: 2/3/4 Phase controller. Below is a snippet from the product description. "The NCP5395T provides up to a four phase buck solution which combines differential voltage sensing, differential phase current sensing, and adaptive voltage positioning to provide accurately regulated power for both Intel and AMD processors. It also receives power saving command from CPU, and operates in a single phase emulation diode mode to obtain a high efficiency at lightload. Dual edge pulse width modulation combined with precise inductor current sensing provides the fastest initial response to dynamic load events both in power saving and normal modes." Source: onsemi.com
The memory chips MSI have utilised on the N550GTX-Ti are Hynix brand GDDR5 gen2 32ns modules. These chips are rated at 2.5GHz DDR (5GHz effective) at 1.5v.
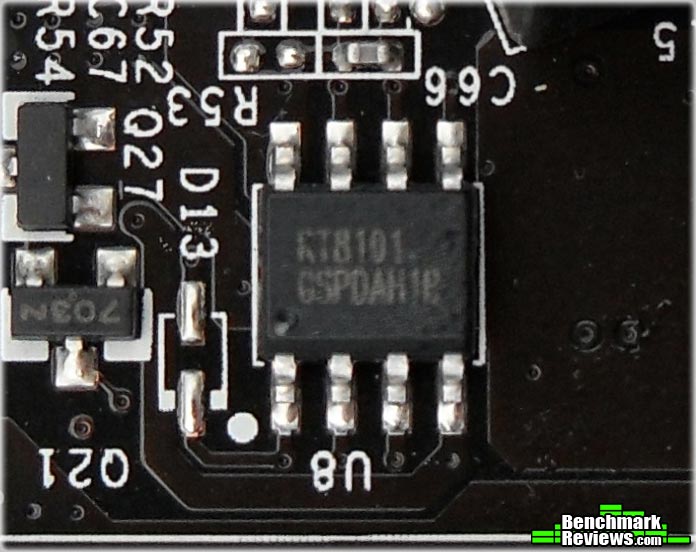
Finally, controlling the RAM voltage we have a Richtek Technologies RT8101 Memory voltage controller. MSI N550GTX-Ti Cyclone II OC Features
MSI N550GTX-Ti Cyclone II OC Specifications
Source: MSI Computer Corp. NVIDIA GTX550-Ti reference card specifications
VGA Testing MethodologyThe Microsoft DirectX-11 graphics API is native to the Microsoft Windows 7 Operating System, and will be the primary O/S for our test platform. DX11 is also available as a Microsoft Update for the Windows Vista O/S, so our test results apply to both versions of the Operating System. The majority of benchmark tests used in this article are comparative to DX11 performance, however some high-demand DX10 tests have also been included. According to the Steam Hardware Survey published for the month ending May 2010, the most popular gaming resolution is 1280x1024 (17-19" standard LCD monitors). However, because this 1.31MP resolution is considered 'low' by most standards, our benchmark performance tests concentrate on higher-demand resolutions: 1.76MP 1680x1050 and 2.07MP 1920x1080 (22-24" widescreen LCD monitors). These resolutions are more likely to be used by high-end graphics solutions, such as those tested in this article. In each benchmark test there is one 'cache run' that is conducted, followed by five recorded test runs. Results are collected at each setting with the highest and lowest results discarded. The remaining three results are averaged, and displayed in the performance charts on the following pages. A combination of synthetic and video game benchmark tests have been used in this article to illustrate relative performance among graphics solutions. Our benchmark frame rate results are not intended to represent real-world graphics performance, as this experience would change based on supporting hardware and the perception of individuals playing the video game.
Intel P55 Test System
DirectX-10 Benchmark Applications
DirectX-11 Benchmark Applications
Video Card Test Products
DX10: 3DMark Vantage3DMark Vantage is a PC benchmark suite designed to test the DirectX10 graphics card performance. FutureMark 3DMark Vantage is the latest addition the 3DMark benchmark series built by FutureMark corporation. Although 3DMark Vantage requires NVIDIA PhysX to be installed for program operation, only the CPU/Physics test relies on this technology. 3DMark Vantage offers benchmark tests focusing on GPU, CPU, and Physics performance. Benchmark Reviews uses the two GPU-specific tests for grading video card performance: Jane Nash and New Calico. These tests isolate graphical performance, and remove processor dependence from the benchmark results.
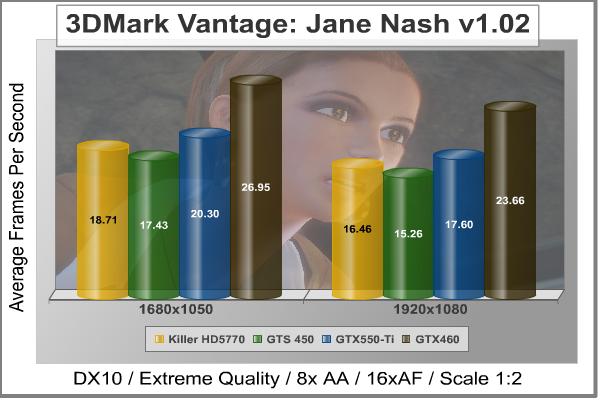
3DMark Vantage GPU Test: Jane NashOf the two GPU tests 3DMark Vantage offers, the Jane Nash performance benchmark is slightly less demanding. In a short video scene the special agent escapes a secret lair by water, nearly losing her shirt in the process. Benchmark Reviews tests this DirectX-10 scene at 1680x1050 and 1920x1080 resolutions, and uses Extreme quality settings with 8x anti-aliasing and 16x anisotropic filtering. The 1:2 scale is utilized, and is the highest this test allows. By maximizing the processing levels of this test, the scene creates the highest level of graphical demand possible and sorts the strong from the weak.
Cost Analysis: Jane Nash (1680x1050)Test Summary: In the Jane nash Vantage test none of the cards tested really score too well but this is a synthetic test after all that is designed to push the GPU to its limits. Significant improvements will only be seen when you lower the quality settings or resolution or double up in SLI mode. The GTX550-Ti shows how much better it is than it's sibling the GTS 450 beating it by 2.8 FPS but at the same time it can't quite match the previous generations 'best bang for buck' card; the GTX460, slipping behind by 6.6 FPS at 1680x1050. The HD5770, which was able to outperform the GTS450 can't match the GTX550-Ti, slipping behind by 1.6 FPS. When we look at price per FPS we see that now the GTX 460 has come down in price even more, (even though it is more expensive than the GTX550-Ti) it still is the best price for performance card with the GTX550-Ti coming in third place. 3DMark Vantage GPU Test: New CalicoNew Calico is the second GPU test in the 3DMark Vantage test suite. Of the two GPU tests, New Calico is the most demanding. In a short video scene featuring a galactic battleground, there is a massive display of busy objects across the screen. Benchmark Reviews tests this DirectX-10 scene at 1680x1050 and 1920x1080 resolutions, and uses Extreme quality settings with 8x anti-aliasing and 16x anisotropic filtering. The 1:2 scale is utilized, and is the highest this test allows. Using the highest graphics processing level available allows our test products to separate themselves and stand out (if possible).
Cost Analysis: New Calico (1680x1050)Test Summary: The tables have turned in the New Calico Vantage test, here the NVIDIA cards win outright the GTS 450 leads the HD5770 by 1.72 FPS and the GTX550-Ti leads that by 2.4 FPS. The gap between the GTX550-Ti and the GTX460 hasn't narrowed any but 336 cores and a 256-bit memory (GTX460) interface can't be beaten by 192 cores and a 192-bit memory interface (GTX550-Ti). The price for performance result is the same as the Jane Nash test with the GTX550-Ti coming in third.
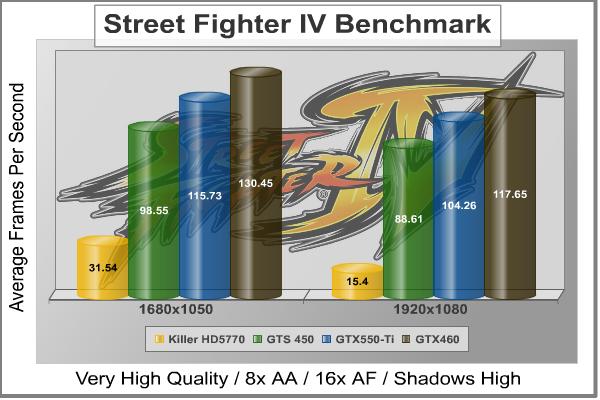
DX10: Street Fighter IVCapcom's Street Fighter IV is part of the now-famous Street Fighter series that began in 1987. The 2D Street Fighter II was one of the most popular fighting games of the 1990s, and now gets a 3D face-lift to become Street Fighter 4. The Street Fighter 4 benchmark utility was released as a novel way to test your system's ability to run the game. It uses a few dressed-up fight scenes where combatants fight against each other using various martial arts disciplines. Feet, fists and magic fill the screen with a flurry of activity. Due to the rapid pace, varied lighting and the use of music this is one of the more enjoyable benchmarks. Street Fighter IV uses a proprietary Capcom SF4 game engine, which is enhanced over previous versions of the game. Using the highest quality DirectX-10 settings with 8x AA and 16x AF, a mid to high end card will ace this test, but it will still weed out the slower cards out there.
Cost Analysis: Street Fighter IV (1680x1050)Test Summary: The Street Fighter IV test comes across a little biased towards the green team, the GTX550-Ti produces some impressive numbers but the results for the Killer HD5770 are not very good at all, Street Fighter IV is a very fast paced game so 30 FPS just won't cut it, even 50 - 60 FPS on this test can come over as relatively slow.
DX11: Aliens vs PredatorAliens vs. Predator is a science fiction first-person shooter video game, developed by Rebellion, and published by Sega for Microsoft Windows, Sony PlayStation 3, and Microsoft Xbox 360. Aliens vs. Predator utilizes Rebellion's proprietary Asura game engine, which had previously found its way into Call of Duty: World at War and Rogue Warrior. The self-contained benchmark tool is used for our DirectX-11 tests, which push the Asura game engine to its limit. In our benchmark tests, Aliens vs. Predator was configured to use the highest quality settings with 4x AA and 16x AF. DirectX-11 features such as Screen Space Ambient Occlusion (SSAO) and tessellation have also been included, along with advanced shadows.
Cost Analysis: Aliens vs Predator (1680x1050)Test Summary: We once again see that the GTS 450 is falling behind the Killer HD5770 by a mere 0.63 FPS, the GTX550-Ti is what the GTS 450 should have been and even though the GTX 460 scores better, in this test the GTX550-Ti is nearly the best cost to performance card. This test is quite strenuous for all of the tested samples, even the GTX460 is struggling to muster a decent FPS result.
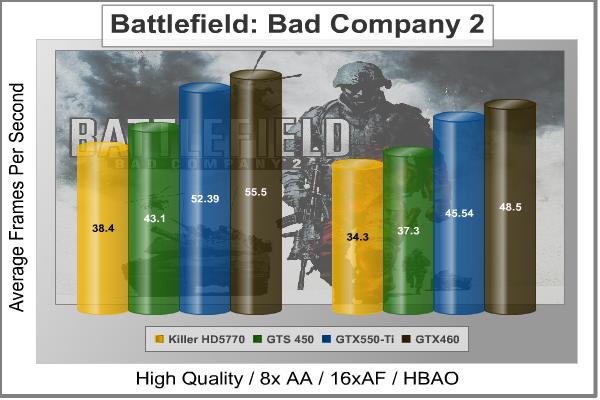
DX11: Battlefield Bad Company 2The Battlefield franchise has been known to demand a lot from PC graphics hardware. DICE (Digital Illusions CE) has incorporated their Frostbite-1.5 game engine with Destruction-2.0 feature set with Battlefield: Bad Company 2. Battlefield: Bad Company 2 features destructible environments using Frostbit Destruction-2.0, and adds gravitational bullet drop effects for projectiles shot from weapons at a long distance. The Frostbite-1.5 game engine used on Battlefield: Bad Company 2 consists of DirectX-10 primary graphics, with improved performance and softened dynamic shadows added for DirectX-11 users. At the time Battlefield: Bad Company 2 was published, DICE was also working on the Frostbite-2.0 game engine. This upcoming engine will include native support for DirectX-10.1 and DirectX-11, as well as parallelized processing support for 2-8 parallel threads. This will improve performance for users with an Intel Core-i7 processor. Unfortunately, the Extreme Edition Intel Core i7-980X six-core CPU with twelve threads will not see full utilization. In our benchmark tests of Battlefield: Bad Company 2, the first three minutes of action in the single-player raft night scene are captured with FRAPS. Relative to the online multiplayer action, these frame rate results are nearly identical to daytime maps with the same video settings. The Frostbite-1.5 game engine in Battlefield: Bad Company 2 appears to equalize our test set of video cards, and despite AMD's sponsorship of the game it still plays well using any brand of graphics card.
Cost Analysis: Battlefield: Bad Company 2 (1680x1050)Test Summary: Now is when we see some better looking numbers. The GTX550-Ti showing that it is the best value performance wise and also delivering GTX460-like performance. Playing at 1920*1080 is acceptable but if you want to raise the graphic quality settings you will want to run at 1680*1050 resolution.
|
|||||||||||||||||||||||||||||||||||||||||||||||||||||||||||||||||||||||||||||||||||||||||||||||||||||||||||||||||||||||||||||||||||||||||||||||||||||||||||||||||||||||||||||||||||||||||||||||||||||||||||||||||||||||||||||||||||||||||||||||||||||||||||||||||||||||||||||||||||||||||||||||||||||||||||||||||||||||||||||||||||||||||||||||||||||||||||||||||||||||||||||||||||||||||||||||||||||||||||||||||||||||||||||||||||||||||||||||||||||||||||||||||||||||||||||||||||||||||||||||||||||||||||||||||||||||||||||||||||||||||||||||||||||||||||||||||||||||||||||||||||||||||||||||||||||||||||||||||||||||||||||


| Graphics Card | GeForce GTX550-Ti | Radeon HD5770 | GeForce GTX460 | GeForce GTS 450 |
| GPU Cores | 192 | 800 | 336 | 192 |
| Core Clock (MHz) | 950 | 850 | 715 | 850 |
| Shader Clock (MHz) | 1900 | N/A | 1430 | 1700 |
| Memory Clock (MHz) | 1075 | 1200 | 900 | 950 |
| Memory Amount | 1024MB GDDR5 | 1024MB GDDR5 | 1024MB GDDR5 | 1024MB GDDR5 |
| Memory Interface | 192-bit | 128-bit | 256-bit | 128-bit |
DX11: Lost Planet 2
Lost Planet 2 is the second instalment in the saga of the planet E.D.N. III, ten years after the story of Lost Planet: Extreme Condition. The snow has melted and the lush jungle life of the planet has emerged with angry and luscious flora and fauna. With the new environment comes the addition of DirectX-11 technology to the game.
Lost Planet 2 takes advantage of DX11 features including tessellation and displacement mapping on water, level bosses, and player characters. In addition, soft body compute shaders are used on 'Boss' characters, and wave simulation is performed using DirectCompute. These cutting edge features make for an excellent benchmark for top-of-the-line consumer GPUs.
The Lost Planet 2 benchmark offers two different tests, which serve different purposes. This article uses tests conducted on benchmark B, which is designed to be a deterministic and effective benchmark tool featuring DirectX 11 elements.
- Lost Planet 2 Benchmark 1.0
- Moderate Settings: (2x AA, Low Shadow Detail, High Texture, High Render, High DirectX 11 Features)

Cost Analysis: Lost Planet 2 (1680x1050)
Test Summary: Lost Planet 2 is a tough cookie to crack, in our tests we had to use relatively low settings just to get some acceptable numbers. This game wants high level hardware to play maxed out. None of the cards tested could play this benchmark at high settings and deliver an acceptable FPS result so visual quality has to be sacrificed. The GTX 460 only just does a good job and once again the Killer HD5770 and the GTS 450 are left behind by the GTX550-Ti.
| Graphics Card | GeForce GTX550-Ti | Radeon HD5770 | GeForce GTX460 | GeForce GTS 450 |
| GPU Cores | 192 | 800 | 336 | 192 |
| Core Clock (MHz) | 950 | 850 | 715 | 850 |
| Shader Clock (MHz) | 1900 | N/A | 1430 | 1700 |
| Memory Clock (MHz) | 1075 | 1200 | 900 | 950 |
| Memory Amount | 1024MB GDDR5 | 1024MB GDDR5 | 1024MB GDDR5 | 1024MB GDDR5 |
| Memory Interface | 192-bit | 128-bit | 256-bit | 128-bit |
DX11: Tom Clancy's HAWX 2
Tom Clancy's H.A.W.X.2 has been optimized for DX11 enabled GPUs and has a number of enhancements to not only improve performance with DX11 enabled GPUs, but also greatly improve the visual experience while taking to the skies. The game uses a hardware terrain tessellation method that allows a high number of detailed triangles to be rendered entirely on the GPU when near the terrain in question. This allows for a very low memory footprint and relies on the GPU power alone to expand the low resolution data to highly realistic detail.
The Tom Clancy's HAWX2 benchmark uses normal game content in the same conditions a player will find in the game, and allows users to evaluate the enhanced visuals that DirectX-11 tessellation adds into the game. The Tom Clancy's HAWX2 benchmark is built from exactly the same source code that's included with the retail version of the game. HAWX2's tessellation scheme uses a metric based on the length in pixels of the triangle edges. This value is currently set to 6 pixels per triangle edge, which provides an average triangle size of 18 pixels.
The end result is perhaps the best tessellation implementation seen in a game yet, providing a dramatic improvement in image quality over the non-tessellated case, and running at playable frame rates across a wide range of graphics hardware.
- Tom Clancy's HAWX 2 Benchmark 1.0.4
- Extreme Settings: (Maximum Quality, 8x AA, 16x AF, DX11 Terrain Tessellation)

Cost Analysis: HAWX 2 (1680x1050)
Test Summary: HAWX 2 is a strange game in that you need to look very close to see the difference in quality settings, the main difference is in the terrain but this is easily overlooked as you are busy fighting with the controls just to fly in a straight line. The GTX550-Ti pummels on the GTS 450 and HD5770 beating them in both FPS performance and price per FPS but is still a way behind the GTX460. The landscapes are beautifully rendered making the game scenery pleasurable, now I just need to master the controls.
| Graphics Card | GeForce GTX550-Ti | Radeon HD5770 | GeForce GTX460 | GeForce GTS 450 |
| GPU Cores | 192 | 800 | 336 | 192 |
| Core Clock (MHz) | 950 | 850 | 715 | 850 |
| Shader Clock (MHz) | 1900 | N/A | 1430 | 1700 |
| Memory Clock (MHz) | 1075 | 1200 | 900 | 950 |
| Memory Amount | 1024MB GDDR5 | 1024MB GDDR5 | 1024MB GDDR5 | 1024MB GDDR5 |
| Memory Interface | 192-bit | 128-bit | 256-bit | 128-bit |
DX11: Metro 2033
Metro 2033 is an action-oriented video game with a combination of survival horror, and first-person shooter elements. The game is based on the novel Metro 2033 by Russian author Dmitry Glukhovsky. It was developed by 4A Games in Ukraine and released in March 2010 for Microsoft Windows. Metro 2033 uses the 4A game engine, developed by 4A Games. The 4A Engine supports DirectX-9, 10, and 11, along with NVIDIA PhysX and GeForce 3D Vision.
The 4A engine is multi-threaded in such that only PhysX had a dedicated thread, and uses a task-model without any pre-conditioning or pre/post-synchronizing, allowing tasks to be done in parallel. The 4A game engine can utilize a deferred shading pipeline, and uses tessellation for greater performance, and also has HDR (complete with blue shift), real-time reflections, color correction, film grain and noise, and the engine also supports multi-core rendering.
Metro 2033 featured superior volumetric fog, double PhysX precision, object blur, sub-surface scattering for skin shaders, parallax mapping on all surfaces and greater geometric detail with a less aggressive LODs. Using PhysX, the engine uses many features such as destructible environments, and cloth and water simulations, and particles that can be fully affected by environmental factors.
NVIDIA has been diligently working to promote Metro 2033, and for good reason: it's one of the most demanding PC video games we've ever tested. When their flagship GeForce GTX 480 struggles to produce 27 FPS with DirectX-11 anti-aliasing turned two to its lowest setting, you know that only the strongest graphics processors will generate playable frame rates. All of our tests enable Advanced Depth of Field and Tessellation effects, but disable advanced PhysX options.
- Metro 2033
- Moderate Settings: (Very-High Quality, AAA, 16x AF, Advanced DoF, Tessellation, 180s Fraps Chase Scene)

Cost Analysis: Metro 2033 (1680x1050)
Test Summary: Metro 2033 is hard on all video cards, and in our tests none of the video cards did very well at all. The motion was choppy and when the beasts came after you it was hard to shoot them for the lag. The only way the GTX550-Ti is going to play this game at these settings is by lowering the resolution or doubling up in SLI mode.
| Graphics Card | GeForce GTX550-Ti | Radeon HD5770 | GeForce GTX460 | GeForce GTS 450 |
| GPU Cores | 192 | 800 | 336 | 192 |
| Core Clock (MHz) | 950 | 850 | 715 | 850 |
| Shader Clock (MHz) | 1900 | N/A | 1430 | 1700 |
| Memory Clock (MHz) | 1075 | 1200 | 900 | 950 |
| Memory Amount | 1024MB GDDR5 | 1024MB GDDR5 | 1024MB GDDR5 | 1024MB GDDR5 |
| Memory Interface | 192-bit | 128-bit | 256-bit | 128-bit |
DX11: Unigine Heaven 2.1
The Unigine Heaven 2.1 benchmark is a free publicly available tool that grants the power to unleash the graphics capabilities in DirectX-11 for Windows 7 or updated Vista Operating Systems. It reveals the enchanting magic of floating islands with a tiny village hidden in the cloudy skies. With the interactive mode, emerging experience of exploring the intricate world is within reach. Through its advanced renderer, Unigine is one of the first to set precedence in showcasing the art assets with tessellation, bringing compelling visual finesse, utilizing the technology to the full extend and exhibiting the possibilities of enriching 3D gaming.
The distinguishing feature in the Unigine Heaven benchmark is a hardware tessellation that is a scalable technology aimed for automatic subdivision of polygons into smaller and finer pieces, so that developers can gain a more detailed look of their games almost free of charge in terms of performance. Thanks to this procedure, the elaboration of the rendered image finally approaches the boundary of veridical visual perception: the virtual reality transcends conjured by your hand.
Although Heaven-2.1 was recently released and used for our DirectX-11 tests, the benchmark results were extremely close to those obtained with Heaven-1.0 testing. Since only DX11-compliant video cards will properly test on the Heaven benchmark, only those products that meet the requirements have been included.
- Unigine Heaven Benchmark 2.1
- Extreme Settings: (High Quality, Normal Tessellation, 16x AF, 4x AA)

Cost Analysis: Unigine Heaven (1680x1050)
Test Summary: Unigine heaven is also quite hard on video cards, only the best video cards will be able to run it smooth at the highest settings, certain parts of this benchmark put more work on the GPU than others, more often than not the GTX550-Ti rendered the scenes very well. The GTX550-Ti has stayed in the same position throughout the complete testing suite and just goes to show it is doing the job it was made for (bridging the price and performance gap between the GTS450 and GTX460).
| Graphics Card | GeForce GTX550-Ti | Radeon HD5770 | GeForce GTX460 | GeForce GTS 450 |
| GPU Cores | 192 | 800 | 336 | 192 |
| Core Clock (MHz) | 950 | 850 | 715 | 850 |
| Shader Clock (MHz) | 1900 | N/A | 1430 | 1700 |
| Memory Clock (MHz) | 1075 | 1200 | 900 | 950 |
| Memory Amount | 1024MB GDDR5 | 1024MB GDDR5 | 1024MB GDDR5 | 1024MB GDDR5 |
| Memory Interface | 192-bit | 128-bit | 256-bit | 128-bit |
MSI N550GTX-Ti Cyclone II OC Temperatures
Benchmark tests are always nice, so long as you care about comparing one product to another. But when you're an overclocker, gamer, or merely a PC hardware enthusiast who likes to tweak things on occasion, there's no substitute for good information. Benchmark Reviews has a very popular guide written on Overclocking Video Cards, which gives detailed instruction on how to tweak a graphics cards for better performance. Of course, not every video card has overclocking head room. Some products run so hot that they can't suffer any higher temperatures than they already do. This is why we measure the operating temperature of the video card products we test.
To begin my testing, I use GPU-Z to measure the temperature at idle as reported by the GPU. Next I use FurMark's "Torture Test" to generate maximum thermal load and record GPU temperatures at high-power 3D mode. The ambient room temperature remained at a stable 22.5°C throughout testing. FurMark does two things extremely well: drive the thermal output of any graphics processor higher than applications of video games realistically could, and it does so with consistency every time. Furmark works great for testing the stability of a GPU as the temperature rises to the highest possible output. The temperatures discussed below are absolute maximum values, and not representative of real-world performance.

As previously stated my ambient temperature remained at a stable 22.5°C throughout the testing procedure, the cooler is so efficient that a heavy load from FurMark raises the temperature from 25°C (40% fan speed) idle to only 56°C load with an automatic fan speed of 61%. Putting the fan on manual and cranking it up to 100% saw the temperature drop to 53°C and the noise level at max speed is honestly still quite bearable, but not for only a 3°C improvement in temperature.

In the next section we will look at power consumption figures, let's go.
VGA Power Consumption
Life is not as affordable as it used to be, and items such as gasoline, natural gas, and electricity all top the list of resources which have exploded in price over the past few years. Add to this the limit of non-renewable resources compared to current demands, and you can see that the prices are only going to get worse. Planet Earth is needs our help, and needs it badly. With forests becoming barren of vegetation and snow capped poles quickly turning brown, the technology industry has a new attitude towards turning "green". I'll spare you the powerful marketing hype that gets sent from various manufacturers every day, and get right to the point: your computer hasn't been doing much to help save energy... at least up until now.
For power consumption tests, Benchmark Reviews utilizes an 80-Plus Gold rated Corsair HX750w (model: CMPSU-750HX) This power supply unit has been tested to provide over 90% typical efficiency by Ecos Plug Load Solutions. To measure isolated video card power consumption, I used the energenie ENER007 power meter made by Sandal Plc (UK).
A baseline test is taken without a video card installed inside our test computer system, which is allowed to boot into Windows-7 and rest idle at the login screen before power consumption is recorded. Once the baseline reading has been taken, the graphics card is installed and the system is again booted into Windows and left idle at the login screen. Our final loaded power consumption reading is taken with the video card running a stress test using FurMark. Below is a chart with the isolated video card power consumption (not system total) displayed in Watts for each specified test product:
VGA Product Description(sorted by combined total power) |
Idle Power |
Loaded Power |
|---|---|---|
NVIDIA GeForce GTX 480 SLI Set |
82 W |
655 W |
NVIDIA GeForce GTX 590 Reference Design |
53 W |
396 W |
ATI Radeon HD 4870 X2 Reference Design |
100 W |
320 W |
AMD Radeon HD 6990 Reference Design |
46 W |
350 W |
NVIDIA GeForce GTX 295 Reference Design |
74 W |
302 W |
ASUS GeForce GTX 480 Reference Design |
39 W |
315 W |
ATI Radeon HD 5970 Reference Design |
48 W |
299 W |
NVIDIA GeForce GTX 690 Reference Design |
25 W |
321 W |
ATI Radeon HD 4850 CrossFireX Set |
123 W |
210 W |
ATI Radeon HD 4890 Reference Design |
65 W |
268 W |
AMD Radeon HD 7970 Reference Design |
21 W |
311 W |
NVIDIA GeForce GTX 470 Reference Design |
42 W |
278 W |
NVIDIA GeForce GTX 580 Reference Design |
31 W |
246 W |
NVIDIA GeForce GTX 570 Reference Design |
31 W |
241 W |
ATI Radeon HD 5870 Reference Design |
25 W |
240 W |
ATI Radeon HD 6970 Reference Design |
24 W |
233 W |
NVIDIA GeForce GTX 465 Reference Design |
36 W |
219 W |
NVIDIA GeForce GTX 680 Reference Design |
14 W |
243 W |
Sapphire Radeon HD 4850 X2 11139-00-40R |
73 W |
180 W |
NVIDIA GeForce 9800 GX2 Reference Design |
85 W |
186 W |
NVIDIA GeForce GTX 780 Reference Design |
10 W |
275 W |
NVIDIA GeForce GTX 770 Reference Design |
9 W |
256 W |
NVIDIA GeForce GTX 280 Reference Design |
35 W |
225 W |
NVIDIA GeForce GTX 260 (216) Reference Design |
42 W |
203 W |
ATI Radeon HD 4870 Reference Design |
58 W |
166 W |
NVIDIA GeForce GTX 560 Ti Reference Design |
17 W |
199 W |
NVIDIA GeForce GTX 460 Reference Design |
18 W |
167 W |
AMD Radeon HD 6870 Reference Design |
20 W |
162 W |
NVIDIA GeForce GTX 670 Reference Design |
14 W |
167 W |
ATI Radeon HD 5850 Reference Design |
24 W |
157 W |
NVIDIA GeForce GTX 650 Ti BOOST Reference Design |
8 W |
164 W |
AMD Radeon HD 6850 Reference Design |
20 W |
139 W |
NVIDIA GeForce 8800 GT Reference Design |
31 W |
133 W |
ATI Radeon HD 4770 RV740 GDDR5 Reference Design |
37 W |
120 W |
ATI Radeon HD 5770 Reference Design |
16 W |
122 W |
NVIDIA GeForce GTS 450 Reference Design |
22 W |
115 W |
NVIDIA GeForce GTX 650 Ti Reference Design |
12 W |
112 W |
ATI Radeon HD 4670 Reference Design |
9 W |
70 W |
At Idle the MSI GTX550-Ti Cyclone II OC consumes 18 (137-119) watts at idle and 136 (255-119) watts when running full load using the test method outlined above. NVIDIA state that the GTX550-Ti was designed to offer more performance per watt than the previous generation GTS450, the MSI N550GTX-Ti OC uses slightly less power at idle but slightly more at load than the reference GTS450 and as you have seen in test results the GTX550-Ti is far more superior than the similarly clocked GTS450. As we can see in the GPU-Z screenshot below the MSI GTX550-Ti Cyclone II OC uses 0.95v when idle, when under load it uses 1.087v.

In the next section we will be discussing our overclocking adventure with the MSI N550GTX-Ti Cyclone II OC, there is a hell of a treat in store too...
MSI N550GTX-Ti Overclocking
Before I start overclocking I like to get a little bit of information, firstly I like to establish operating temperatures and since we know these are nice and low we can quickly move on. Next I like to know what the voltage and clock limits are, so I fired up the bundled MSI Afterburner utility. I established that vCore was adjustable between 0.825v and 1.15v and clock speeds were limited to 1425MHz max on the GPU (linked Shaders 2850MHz) and 1397.5MHz (5.59GHz effective) maximum frequency for the memory. This is more than enough range to move forward with and I know I can squeeze every last drop of performance out of the GTX550-Ti. My preferred weapons are MSI Afterburner (v2.10) for fine tuning while using FurMark (v1.8.2) to push the GPU.
 *-
*-
So there we have it, raising the vCore to 1.15v gave us a rock solid 1.08GHz GPU (linked Shaders 2160MHz) and 1210MHz (4.84GHz effective) overclock (validation here). I was absolutely blown away by the capabilities of the already overclocked MSI GTX550-Ti video card, when we compare to the NVIDIA reference GTX550-Ti we are looking at overclocks of +180MHz for the GPU and +185MHz for the memory. Of course I am also really proud to have surpassed the 1GHz GPU speed milestone. Let's see what difference this overclock makes to our test results.
| Test Item | Standard GPU/RAM | Overclocked GPU/RAM | Improvement | |||
| GeForce GTX550-Ti OC | 950/1075 MHz | 1080/1210 MHz | 130/135 MHz | |||
| DX10: Street Fighter IV | 104.26 | 117.68 | 13.41 FPS (12.86%) | |||
| DX10: 3dMark Jane Nash | 17.60 | 20 |
2.39 FPS (13.61%) |
|||
| DX10: 3dMark Calico | 15.42 | 17.50 | 2.07 FPS (13.46%) | |||
| DX11: HAWX 2 | 69 | 76 | 7.00 FPS (10.14%) | |||
| DX11: Aliens vs Predator | 21.30 | 24.10 |
2.80 FPS (13.14%) |
|||
| DX11: Battlefield BC2 | 45.54 | 51.71 | 6.16 FPS (13.53%) | |||
| DX11: Metro 2033 | 14.66 | 16.90 | 2.23 FPS (15.23%) | |||
| DX11: Heaven 2.1 | 21.23 | 23.80 | 2.56 FPS (12.08%) | |||
| DX11: Battle Forge | 25.10 | 27.70 |
2.60 FPS (10.35%) |
Armed with a 130MHz GPU overclock (180MHz over reference design) and a 135MHz memory overclock (185MHz over reference design) we went back to the bench and ran through the entire test suite. Overall there is an average 13% increase in scores (at 1920x1080 resolution). We also re ran temperature tests at the overclocked speeds at the same ambient temperature of 22.5°C. The Cyclone II cooler on the MSI N550GTX-Ti OC once again did not fail to please, at idle the GPU sat at 28°C (40% fan speed). Pushing the temperature up with FurMark saw the GPU load temperature rise to 65°C (73% fan speed) and cranking the fan on manual to 100% saw the temperature drop to 63°C.

That's all of the testing over, in the next section I will deliver my final thoughts and conclusion.
Cyclone II OC Final Thoughts
All I can think to say right now is WOW, the MSI N550GTX-Ti Cyclone II OC really blew me away with its excellent cooling and overclocking capabilities. With these clocks it starts to test its bigger brother the GTX 460, not only do we have a video card here that looks good but we have a video card that will run cool and quiet no matter what you throw at it.
Significant improvements would be achieved if the screen resolution were lowered from 1920x1080 to 1280x1024 (standard for 17" to 19" monitor), I would also expect to see higher FPS results if the GTX550-Ti were run in SLI mode. Two of these bad boys in close proximity might warm your case up a bit but nowhere near the temperatures of higher end video cards.
MSI N550GTX-Ti Conclusion
Important: In this section I am going to write a brief five point summary on the following categories; Performance, Appearance, Construction, Functionality and Value. These views are my own and help me to give the MSI N550GTX-Ti Cyclone II OC Video Card a rating out of 10. A high or low score does not necessarily mean that it is better or worse than a similar video card that has been reviewed by another writer here at Benchmark Reviews, which may have got a higher or lower score. It is however a good indicator of whether the MSI N550GTX-Ti Cyclone II OC is good or not. I would strongly urge you to read the entire review, if you have not already, so that you can make an educated decision for yourself.

The graphics performance of the MSI N550GTX-Ti Cyclone II OC is not high end but this card isn't aimed at the high end price bracket. It does however deliver great price to performance out of the box, and then some more when you overclock the hell out of it. The GTX550-Ti sits directly between the GTS450 and GTX460 and just leaves the HD5770 sitting.
The appearance of the MSI N550GTX-Ti Cyclone II OC is, as I'm sure you will agree, very nice indeed. The side view is given extra attention thanks to a really simple metal piece but it makes all the difference once you install the card into your system. There are some that will surely disagree but thanks to the graphic nature of this review you can easily make your mind up for yourself.
Construction is excellent as you would expect from a company with a good reputation like MSI, there was a slight missed spot during the cleaning process but it is nothing major as it only hurts the aesthetics and not the performance. Taking the card to pieces and reconstructing it was a breeze and everything lined up perfectly, the Cyclone II cooler is solid and really adds some girth to the card turning what could be a single slot card into a 2-slot monster.
Functionality is very good, I can't help but keep singing praise for the Cyclone II cooler, it really is so good. The MSI Afterburner and Kombustor utilities are very handy when it comes to overclocking and stress testing your video card.
As of February 2012 the MSI N550GTX-Ti Cyclone II OC video card is retails for $129.99 (Newegg), at this price point it sits directly between the much loved NVIDIA GTX460 and the GTS450. Throughout our tests the three NVIDIA cards tested (GTX550-Ti, GTX460 and GTS450) shared the crown for best price per FPS with no definitive winner. The GTX460 has come down in price recently and still offers the best overall cost/performance. The potential speeds that this card can hit means you get an absolute smoker of a deal.
I have no problems recommending this card to anyone who is in the market for a great budget mid range card. you certainly could do much worse.
Pros:
+ Cyclone II cooler is excellent
+ Fan at 100% is not too loud
+ Very nice looks
+ Excellent build quality
+ Great value for money
+ SLI Support
+ Good overclocking headroom
+ Good power consumption
+ Variety of outputs: D-SUB, DVI-I and HDMI
Cons:
- Hot air from GPU exhausted into case
- Extra height of card may cause problems in a small form factor build
Ratings:
- Performance: 9.00
- Appearance: 9.50
- Construction: 9.50
- Functionality: 9.00
- Value: 9.00
Final Score: 9.20 out of 10.
Excellence Achievement: Benchmark Reviews Golden Tachometer Award.
Questions? Comments? Benchmark Reviews really wants your feedback. We invite you to leave your remarks in our Discussion Forum.
Related Articles:
- ASUS ENGTX580 GeForce GTX 580 Video Card
- Synology Cube Station CS407 4-Bay SATA Gigabit NAS
- MSI GTX 660-Ti Power Edition Video Card
- QNAP TS-419P Turbo NAS 4-Bay Network Storage Server
- HIS Radeon HD6870 IceQ-X Turbo-X Video Card
- ASUS DRW-24B1ST DVD-RW SATA Optical Drive
- Thermaltake Frio OCK CPU Cooler CLP0575
- Thermaltake Spedo Advance Package VI90001W2Z
- AMD Phenom-II X4-975 BE CPU HDZ975FBGMBOX
- G.Skill Ares 16GB 1866Mhz DDR3 Memory Kit

Comments
FYI the HD5770 is closer to the GTS450... sorry to burst your bubble. Check techPowerUp also.
About the:
- Hot Air being exhausted into case.
Wouldnt an Evercool FOX 2 Exhaustor be handy ? ... I use one ... just wondering.
Obviously, the 6850 and 6870 were made to fill in the price gaps between the 5850 and 5870. The architecture is slightly different with fewer steam processors but shorter pipelines, not to mention better tessellation performance. The 6xxx series cards also tend to scale 90%-100% when crossfired vs the 50-80% from the previous generations.
/images/reviews/video_cards/Radeon_HD6870/03_DavidCummings_HD680 0-pg4.jpg
/images/reviews/video_cards/Radeon_HD6870/03_DavidCummings_HD680 0-pg6.jpg
Make sure that when you paste the URL, it doesn't turn "HD6800-pg" into "HD680 0-pg"