| MSI GTX 660-Ti Power Edition Video Card |
| Reviews - Featured Reviews: Video Cards | |||||||||||||||||||||||||||||||||||||||||||||||||||||||||||||||||||||||||||||||||||||||||||||||||||||||||||||||||||||||||||||||||||||||||||||||||||||||||||||||||||||||||||||||||||||||||||||||||||||||||||||||||||||||||||||||||||||||||||||||||||||||||||||||||||||||||||||||||||||||||||||||||||||||||||||||||||||||||||||||||||||||||||||||||||||||||||||||||||||||||||||||||||||||||||||||||||||||||||||||||||||||||||||||||||||||||||||||||||||||||||||||||||||||||||||||||||||||||||||||||||||||||||||||||||||||||||||||||||||||||||||||||||||||||||||||||||||||||||||||||||||||
| Written by David Ramsey | |||||||||||||||||||||||||||||||||||||||||||||||||||||||||||||||||||||||||||||||||||||||||||||||||||||||||||||||||||||||||||||||||||||||||||||||||||||||||||||||||||||||||||||||||||||||||||||||||||||||||||||||||||||||||||||||||||||||||||||||||||||||||||||||||||||||||||||||||||||||||||||||||||||||||||||||||||||||||||||||||||||||||||||||||||||||||||||||||||||||||||||||||||||||||||||||||||||||||||||||||||||||||||||||||||||||||||||||||||||||||||||||||||||||||||||||||||||||||||||||||||||||||||||||||||||||||||||||||||||||||||||||||||||||||||||||||||||||||||||||||||||||
| Thursday, 16 August 2012 | |||||||||||||||||||||||||||||||||||||||||||||||||||||||||||||||||||||||||||||||||||||||||||||||||||||||||||||||||||||||||||||||||||||||||||||||||||||||||||||||||||||||||||||||||||||||||||||||||||||||||||||||||||||||||||||||||||||||||||||||||||||||||||||||||||||||||||||||||||||||||||||||||||||||||||||||||||||||||||||||||||||||||||||||||||||||||||||||||||||||||||||||||||||||||||||||||||||||||||||||||||||||||||||||||||||||||||||||||||||||||||||||||||||||||||||||||||||||||||||||||||||||||||||||||||||||||||||||||||||||||||||||||||||||||||||||||||||||||||||||||||||||
MSI N660Ti Power Edition Video Card
Manufacturer: Micro-Star International (MSI) Full Disclosure: MSI provided the product sample used in this article. When NVIDIA introduced the GTX 680 and GTX 670 a few months ago, reviewers were stunned by the performance and power efficiency afforded by these new Kepler-based GPU designs. Based on a new 28mm fabrication process and a complete re-design of the previous generation Fermi GPUs, these new cards were in high demand among gamers and enthusiasts. But performance comes with a price: roughly $400 in the case of GTX 670 cards, and $500 for GTX 680 cards. That's more than many people spend on their entire computer these days, and represents a significant expense for most people. Besides, the performance of these cards is so high that they're wasted on many single-monitor setups. And so the market waited for the rumored mid-range Kepler card, and now it's here in the form of the GTX 660. At an MSRP of $309.99, MSI's N660Ti Power Edition card comes in a mere $10 above the $299.99 MSRP of a reference-design GTX 660. But MSI's variant isn't a reference design, and packs in more for that extra $10 that you would think possible. 
The N660Ti might be a mid-range card, but it's not a budget special: it's built on the same GK104 GPU as the GTX670 and GTX680, and has all of the features of its big brothers, including adaptive V-Sync and TXAA anti-aliasing. Add MSI's mil-spec components, advanced cooler, and enhanced power circuitry, and we might just be looking a the sweet spot of the Kepler lineup. Closer Look: MSI N660Ti Power EditionThe brightly colored box of the N660Ti Power Edition calls out most of its features, although "OC Edition" probably doesn't mean much to most people. The "triple voltage" and "enhanced PWM design" give you some clue as to the special nature of the card. The top of the box is actually a Velcro-attached flap that opens to show a window into the box, highlighting the card, and also reveals lots of extra surface area for marketing talk. 
Accesories comprise a user's guide, a manual, a DVI to VGA converter, a driver and utilities disk, and two Molex to 6-pin PCI-E power adapters. Missing in this early production board's accessories was an SLI bridge, but one will be included with retail boards.
MSI's venerable Twin Frozr cooler makes another appearance here. This version has four heat pipes and two 80mm fans. As with the N680GTX Lightning, the fans initially spin backwards at power-on to help dislodge any dust buildup. The very tall fan shroud partially blocks access to one of the SLI connectors on top of the card; previous cards using this design included an extra-long SLI bridge to work around this.
The top of the card is home to the standard two SLI connectors (with blue plastic protective covers in this image) and two 6-pin PCI-E power connectors. Unlike the N680GTX Lightning, there is no switchable BIOS, and thus no BIOS switch.
The back of the card lacks the stabilizing and protective metal backplate its big brother sports. Oddly, two of the card's eight Hynix GDDR5 memory chips are mounted on the back, visible in this photo near the PCI-E connector at the bottom of the card.
Let's take a closer look at this card in the next section. N660Ti PE Detailed FeaturesVideo outputs include two dual-link DVI connectors, a DisplayPort connector, and an HDMI connector. You can use all four of these connectors to run four monitors simultaneously, although only three can be grouped together as an extended desktop with "NVIDIA Surround"; the fourth monitor is an "accessory display" that isn't part of the gaming screens. One detail: only the bottom DVI connector is a "DVI-I" connector that also carries analog video signals. This is the connector you plug the supplied VGA adapter into if you're still using a VGA monitor.
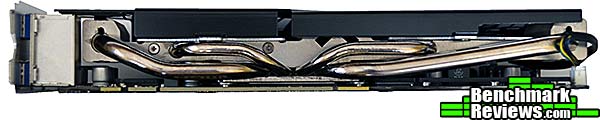
At the bottom of the card you can see the four heat pipes, two 8mm and two 6mm. This particular iteration of the Twin Frozr cooler is very effective, as we'll see during testing.
Each fan is equipped with blue LEDs that come on after the initial dust-clearing operation. They provide a nice ambience. 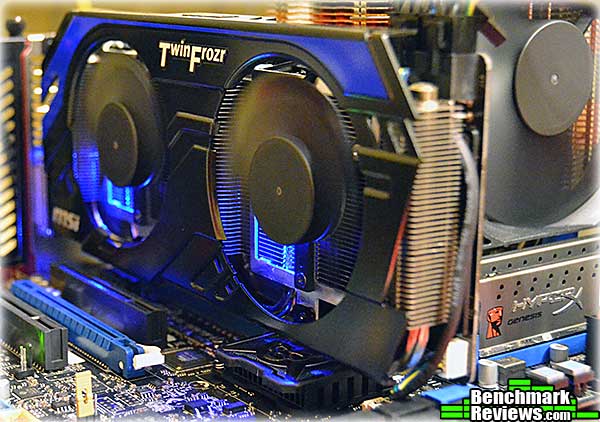
Removing the cooler and the separate plate that cools some of the memory and the power circuitry, we can see that for once a completely excessive amount of thermal past was not used. Finally! Six of the card's eight Hynix memory chips are mounted on the component side: four to the right of the GPU and two below. Although there's a space for two more memory chips above the GPU, the remainng two chips are mounted on the back of the card instead.
Here's the card, the cooler plate, and the Twin Frozr cooler. The separate cooler plate helps dissipate heat from the four memory chips to the right of the GPU and some power circuitry. The two memory chips below the GPU are not covered by this plate, presumablty because there's not enough clearance due to the heat pipes that come down into that area. 
We'll cover the features and specifications of this card in the next section. MSI N660Ti Power Edition Features

MSI N660Ti Power Edition Specifications
Interestingly, the raw specifications-- the number of CUDA cores, the base and boost clocks, and the amount of speed of the memory-- are all identical to the GTX 670. The only difference I see is the reduction in memory bus width from the 670's 256 bits to 192 bits. How much of a difference will this actually make? Let's find out... VGA Testing MethodologyThe Microsoft DirectX-11 graphics API is native to the Microsoft Windows 7 Operating System, and will be the primary OS for our test platform. DX11 is also available as a Microsoft Update for the Windows Vista OS, so our test results apply to both versions of the operating system. All of the tests in this review were run with DX11 graphics. According to the Steam hardware survey, as of December 2011 the most popular desktop resolution (for Steam users) is 1680x1050 pixels, with a 17.59% share, with 1920x1080 pixels coming in second with only 7.7%. I ran most tests at both 1680x1050 and 1920x1080 or 1920x1200 (I continue to prefer the 16:10 ratio of 1920x1200 to the mysteriously more popular 1920x1080 resolution). I used a combination of synthetic and video game benchmark tests in this article to illustrate relative performance among graphics solutions. Our benchmark frame rate results are not intended to represent real-world graphics performance, as this experience would change based on supporting hardware and the perception of individuals playing the video game. Overclocking: For each benchmark I've also included performance results from the card with the maximum overclock I was able to achieve. Details on overclocking follow the benchmarks. DX11 Cost to Performance RatioFor this article Benchmark Reviews has included cost per FPS for graphics performance results. Only the least expensive product price is calculated, and does not consider tax, freight, promotional offers, or rebates into the cost. All prices reflect product series components, and do not represent any specific manufacturer, model, or brand (except for the XFX cards). These retail prices for each product were obtained from NewEgg.com on 10-August-2012; since the MSI N660Ti Power Edition is not available at retail as of the time of this writing, I used MSI's suggested retail price of $309.99.
Intel Z77-Express Test System
DirectX-11 Benchmark Applications
Video Card Test Products
DX11: 3DMark113DMark11 is Futuremark's latest iteration of the video card software benchmark suite, building on the features of 3DMark Vantage and 3DMark 06 as well as earlier version. It's optimized and intended for testing DirectX-11 capable hardware running under Windows Vista or Windows 7.
3DMark Vantage offers benchmark tests focusing on GPU, CPU, and Physics performance. For this review I concentrated on the four GPU-specific tests. The first two tests take you through an undersea scene with small submarines exploring the sea floor and sunken ships. In the GT1 test, there's no tessellation, but there are extensive lighting and shadow effects. In the GT2 test, the same scene is repeated but with moderate tessellation and fewer lighting effects. 
Here's the first surprise in this test: at stock clock speeds, the MSI N660Ti Power Edition beats every other card except the GTX680, and when overclocked, it even beats that! This from a card that costs $80 less than the next-cheapest card. Cost Analysis: GT1+GT2The second pair of graphics tests explore an abandoned temple deep in a tropical jungle. The GT3 test has medium tessellation and one shadow-casting light, while the GT4 test ups the ante with heavy tessellation and many shadow-casting lights. The GT4 test is by far the most demanding of this test suite. 
Cost Analysis: GT3+GT4Test Summary: The MSI N660Ti Power Edition again leads the field.
DX11: F1 2010Codemasters' F1 2010 is officially licensed by Formula One World Championship Limited, the folks who run the actual Formula One franchise. As a racer, you must sign with a team and work to build your career, which consists of more than simply driving...although, to be honest, driving's most of it! F1 2010 is really more of a simulator than anything else. You have to contend with everything from engine overheating to aerodynamics to dirt and rubber on the track affecting your traction in real time. Codemasters game designers and programmers spent time with Formula One race engineers, mechanics, and drivers to build the most realistic game possible.
Cost Analysis: F1 2010 (1920x1200)Test Summary: It's always fun to see benchmark results, because they're never what you expect. After dominating the field in 3DMark 11, and N660Ti falls to the back of the pack in F1 2010. However, notice that the frame rates are still solidly playable, and look at that cost per frame per second!
DX11: Batman: Arkham CityIf there was ever a game that showcased the growing gap between game consoles and high-end gaming PCs, Batman: Arkham City is it. In this dystopian near-future, part of Gotham City has been walled off as an enclave for criminals (rather like Escape from New York). It's a 3rd-person action game that adheres to story line previously set forth in Batman: Arkham Asylum, and is based on an updated Unreal Engine 3 game engine. Batman: Arkham City is a DirectX 11 title that uses multi-threaded rendering to produce life-like tessellation effects. One annoyance with the game is that all game settings must be made through a hidden application called "BMLauncher". Once you've made your settings, though, an in-game benchmark provides the feedback you'll need to tune your system's performance.
The AMD Radeon graphics cards are at a disadvantage here, since, like Arkham Asylum, Arkham City is a showcase of PhysX effects, which can be directly accelerated by NVIDIA cards but not by AMD cards. I left PhysX turned off for this test but if your Radeon-equipped rig is running an Intel 2500K or higher processor, consider turning it on: the PhysX will run on the CPU but modern multi-core CPUs have enough power to do a credible job, and you'll miss out on some really cool effects otherwise. With PhysX turned off, however, the Radeons run roughshod over the NVIDIA cards. Again, the N660Ti is the slowest card here: even overclocked, it can't match the performance of the other cards. Also again, it still turns in more than playable frame rates at a cost per frame per second lower than any of the other cards. Cost Analysis: Arkham City (1920x1080)Test Summary: The XFX Radeon 7970 waltzes to a win here. The luster on AMD's Southern Islands GPUs dimmed somewhat when NVIDIA's Kepler-based cards were introduced, but enthusiasts should remember that these are very fast cards, and now have a $-per-FPS advantage in many cases...except for the N660Ti.
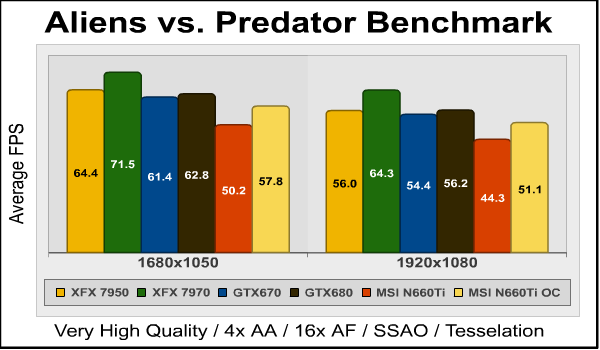
DX11: Aliens vs PredatorAliens vs. Predator is a science fiction first-person shooter video game, developed by Rebellion, and published by Sega for Microsoft Windows, Sony PlayStation 3, and Microsoft Xbox 360. Aliens vs. Predator utilizes Rebellion's proprietary Asura game engine, which had previously found its way into Call of Duty: World at War and Rogue Warrior. The self-contained benchmark tool is used for our DirectX-11 tests, which push the Asura game engine to its limit. I configured Aliens vs. Predator to use the highest quality settings with 4x AA and 16x AF, as well as turning on DirectX-11 features such as Screen Space Ambient Occlusion (SSAO) and tessellation, along with advanced shadows.
Cost Analysis: Aliens vs Predator (1920x1080)Test Summary: This game is a sweep for AMD: even the 7950 manages to beat every NVIDIA card here.
DX11: Lost Planet 2Capcom provides a stand-alone benchmark tool for Lost Planet 2. Reviewers love stand alone benchmarks, and users should, too, since they allow the evaluation of a system without the trouble and expense of purchasing and configuring the actual game. Lost Planet 2 takes place on E.D.N. III, the same planet in the original Lost Planet game, but ten years later. The snow has melted and somehow giant tropical jungles have grown to fill the landscape. Lost Planet 2 takes advantage of DX11 features including tessellation and displacement mapping on water, level bosses, and player characters. In addition, soft body compute shaders are used on 'Boss' characters, and wave simulation is performed using DirectCompute. These cutting edge features make for an excellent benchmark for top-of-the-line consumer GPUs. There are two parts to the benchmark: Test A, which is a semi-random script that's a good example of normal game play, and Test B, which is a deterministic script that places a significantly heavier load on the card being tested.
Cost Analysis: Lost Planet 2 (1920x1200, Test B)Test Summary: The N660Ti Power Edition leaps back to the front of the pack here, even beating the GTX670 (but recall the GTX670 is a reference card, while the N660Ti is a factory-overclocked card). Overclocked even more it's the fastest card here, if by only a whisker.
DX11: Metro 2033Metro 2033 is an action-oriented video game with a combination of survival horror, and first-person shooter elements. The game is based on the novel Metro 2033 by Russian author Dmitry Glukhovsky. It was developed by 4A Games in Ukraine and released in March 2010 for Microsoft Windows. Metro 2033 uses the 4A game engine, developed by 4A Games. The 4A Engine supports DirectX-9, 10, and 11, along with NVIDIA PhysX and GeForce 3D Vision. The 4A engine is multi-threaded in such that only PhysX had a dedicated thread (although PhysX is disabled for this test), and uses a task-model without any pre-conditioning or pre/post-synchronizing, allowing tasks to be done in parallel. The 4A game engine can utilize a deferred shading pipeline, and uses tessellation for greater performance, and also has HDR (complete with blue shift), real-time reflections, color correction, film grain and noise, and the engine also supports multi-core rendering. Metro 2033 features superior volumetric fog, double PhysX precision, object blur, sub-surface scattering for skin shaders, parallax mapping on all surfaces and greater geometric detail with a less aggressive LODs. Using PhysX, the engine uses many features such as destructible environments, and cloth and water simulations, and particles that can be fully affected by environmental factors.
NVIDIA has been diligently working to promote Metro 2033, and for good reason: it is the most demanding PC video game we've ever tested. When their flagship GeForce GTX 580 struggles to produce 26 FPS at 1920x1200 with DirectX-11 anti-aliasing turned two to its lowest setting, you know that only the strongest graphics processors will generate playable frame rates. All our tests disable advanced PhysX options. Cost Analysis: Metro 2033 (1920x1080)Test Summary: There's no doubt that this is a very demanding game. What Crysis was to top-end video cards a few years ago, Metro 2033 is now, with even the strongest single-GPU cards struggling to break 30 frames per second at 1920x1080. And note that this is with PhysX features turned off! The Radeon cards dominate here, which must be embarrassing to NVIDIA since they showcased the game for their cards when it was introduced. And at last one card-- the XFX Radeon 7950 Black Edition Double Dissipation-- beats the N660Ti Power Edition in the dollar per frame per second race.
DX11: Unigine Heaven 3.0The Unigine Heaven 3.0 benchmark is a free publicly available tool that grants the power to unleash the graphics capabilities in DirectX-11 for Windows 7 or updated Vista Operating Systems. It reveals the enchanting magic of floating islands with a tiny village hidden in the cloudy skies. With the interactive mode, emerging experience of exploring the intricate world is within reach. Through its advanced renderer, Unigine is one of the first to set precedence in showcasing the art assets with tessellation, bringing compelling visual finesse, utilizing the technology to the full extend and exhibiting the possibilities of enriching 3D gaming. The distinguishing feature in the Unigine Heaven benchmark is a hardware tessellation that is a scalable technology aimed for automatic subdivision of polygons into smaller and finer pieces, so that developers can gain a more detailed look of their games almost free of charge in terms of performance. Thanks to this procedure, the elaboration of the rendered image finally approaches the boundary of veridical visual perception: the virtual reality transcends conjured by your hand. The Heaven benchmark excels at providing the following key features:
Cost Analysis: Unigine Heaven (1920x1080)Test Summary: This is one test in which the MSI N660Ti's performance falls where you'd expect it to: behind the GTX670.
DX11: Battlefield 3In Battlefield 3, players step into the role of the Elite U.S. Marines. As the first boots on the ground, players will experience heart-pounding missions across diverse locations including Paris, Tehran and New York. As a U.S. Marine in the field, periods of tension and anticipation are punctuated by moments of complete chaos. As bullets whiz by, walls crumble, and explosions force players to the grounds, the battlefield feels more alive and interactive than ever before. The graphics engine behind Battlefield 3 is called Frostbite 2, which delivers realistic global illumination lighting along with dynamic destructible environments. The game uses a hardware terrain tessellation method that allows a high number of detailed triangles to be rendered entirely on the GPU when near the terrain. This allows for a very low memory footprint and relies on the GPU alone to expand the low res data to highly realistic detail. Using Fraps to record frame rates, our Battlefield 3 benchmark test uses a three-minute capture on the 'Secure Parking Lot' stage of Operation Swordbreaker. Relative to the online multiplayer action, these frame rate results are nearly identical to daytime maps with the same video settings.
Cost Analysis: Battlefield 3 (1920x1200)Test Summary: The surprise here is the high score returned by the reference design GTX670 at 1920x1200. As multiple reviews have shown, the 670 frequently performs almost as well as a 680, but this score even beats the Lightning, so I'm inclined to dismiss it as an error...although the frame rates I recorded over multiple runs were consistent. The 660Ti acquits itself well here, though, beating both Radeon cards.
MSI N660Ti PE TemperaturesWe're at the start of a transition: for years the PC industry has produced faster and more powerful CPUs and GPUs, which always came with ever-higher power draws. But as the industry moves to smaller and smaller fabrication processes, we're seeing power draws drop, and clever designs save even more power. Users benefit from GPUs that disable large portions of their circuitry when idle, leading to dramatically lower power draws and very cool idle temperatures. At the other end of the scale, reduced power at the higher end means smaller coolers, quieter fans, and less heat to worry about dissipating. At the start of this test, I measure the idle temperature of the card with the card sitting at the Windows desktop, using the GPU-Z utility. Next, I start FurMark's stress test and let it run until the temperature curve flattens and the temperature has not varied more than 1 degree in the last five minutes. FurMark does two things extremely well: drive the thermal output of any graphics processor higher than applications of video games realistically could, and it does so with consistency every time. FurMark works great for testing the stability of a GPU as the temperature rises to the highest possible output. The temperatures discussed below are absolute maximum values, and not representative of real-world performance. MSI's Twin Frozr cooler may have a silly name, but it's very effective on the N660Ti Power Edition: 
At 11 degrees Celsius over ambient temperature, the card runs pretty cool at idle. At 70 degrees under Furmark load, the load temperature is the same as we recorded for the MSI N680GTX Lightning and the reference design NVIDIA GTX670; this implies a ceiling that NVIDIA wants to keep a Kepler GPU under. Amazingly, even under this load, the card's fans did not ramp up noticeably and overall the card was almost inaudible. VGA Power ConsumptionThe new generation of video cards-- AMD's Southern Islands and NVIDIA's Kepler-- are certainly fast, but their new power saving features are almost as impressive. The move to a smaller process has helped, but both products benefit from a variety of power-saving techniques, including aggressively underclocking and undervolting themselves in low demand scenarios, as well as turning off unused portions of the card. Both companies also use other, proprietary methods to keep power usage low. To measure isolated video card power consumption, Benchmark Reviews uses the Kill-A-Watt EZ (model P4460) power meter made by P3 International. A baseline test is taken without a video card installed inside our test computer system, which is allowed to boot into Windows 7 and rest idle at the login screen before power consumption is recorded. Once the baseline reading has been taken, the graphics card is installed and the system is again booted into Windows and left idle at the login screen. Another power reading is taken when the display sleeps, and then I measure the power under a heavy gaming load. Our final loaded power consumption reading is taken with the video card running a stress test using FurMark. Below is a chart with the isolated video card power consumption (not system total) displayed in watts for each specified test product:
* Results are accurate to within +/- 5W.
Kepler's not the power miser AMD's Southern Islands is; in particular, there's no provision for turning off the additional, non-primary video cards in a multi-card system. Still, nine watts when sitting at the Windows desktop is less than a third as much power as a Fermi-based GTX580 would use, and the loaded power draw is less than half. NVIDIA's said that "performance per watt" was one of their goals with the Kepler architecture, and it's obvious that they've succeeded. MSI N660Ti PE OverclockingOverclocking Kepler-based cards isn't the way it was in "the old days". With previous generations of GPUs, you overclocked simply by increasing the clock frequency (and perhaps power and voltage) until the card failed. Although some cards could "protect themselves" by throttling power draw and frequency at the high end, there was no unified strategy for managing top-tier performance. All that changes with Kepler. Kepler GPUs will vary their clock speeds from "somnolent" to "insane" depending on a number of factors, and your overclocking settings are treated as requests rather than commands. NVIDIA uses both hardware and software constraints to achieve the maximum performance possible under a given set of parameters, taking into account power draw and temperature as well as (according to NVIDIA) "many other" factors-- and no, they don't want to talk about what those other factors are. This means that when you see NVIDIA or other vendors talking about "boost clock", don't assume that this clock speed is what a Kepler-based card will run at under load. According to NVIDIA, the "boost clock" is the average frequency the GPU runs at under NVIDIA's test suite. MSI says the boost clock for the N660Ti Power Edition is "1097MHz", which means that they guarantee the card will average this speed under load. In some cases it may be faster. In some cases it may be slower. NVIDIA's performance strategy means that identical Kepler-based cards from the same manufacturer are not guaranteed to have identical performance-- in fact they almost certainly won't. While they'll boost to at least the quoted boost clock under load, how much further they will go will vary from card to card. With this in mind, I used MSI's own Afterburner 2.2.3 to increase the voltage and power draw to that maximum allowed for this card (+100mv and 114%, respectively), and then set out to achieve the highest GPU clock and memory clock offsets I could. This turned out to be 160Mhz and 470MHz, respectively. 
In the benchmarks, this resulted in a maximum observed boost clock of 1,280MHz. Again, remember that this represents the maximum I saw, and is not necessarily the average clock speed across all of the benchmarks. Yes, it would be nice were there a utility that actually would record average GPU clock speeds on the fly. 
This overclock propelled the N660Ti Power Edition into rarefied territory, enabling it to beat a reference design GTX680 in some tests. Below I summarize the performance increase overclocking yielded in each benchmark (in those that were run at multiple resolutions, I include results only from the highest resolution):
NVIDIA claims that although cards based on 660 series GPUs are priced to compete with 7800 series AMD Radeons, the performance can "often" compete with a Radeon 7950. The XFX Radeon 7950 I had for comparison is a factory overclocked card, but let's check out that claim anyway. For this chart I'm comparing both cards with their as-delivered factory overclocks:
So across this particular set of benchmarks the MSI N660Ti Power Edition is 3.92% faster than the XFX Radeon 7950 Black Edition Double Dissipation. While this number doesn't really mean anything in absolute terms-- note how the differences tend to be rather large (>20%) up or down depending on the benchmark-- it's still amazing that this card can credibly be said to be in roughly the same performance arena as the much more expensive 7950. Interesting note: when using Afterburner 2.2.3 to overclock MSI's N680GTX Lightning, I found that I had to constantly watch the voltage offset, since the card would tend to move it down. I never saw that happen with the N660Ti. I'll present my final thoughts on this card in the next section. GeForce GTX 660 Ti Final ThoughtsIt is, seriously, a great time to be a PC gamer. While the console market struggles with six and seven year old hardware whose graphics performance would seem more suited to a modern tablet, the new crop of PC video cards brings staggering performance and thrifty power usage at increasingly low prices to the PC gamer. The price and performance war between AMD's Radeon cards and NVIDIA's GeForce cards has resulted in a $300 GPU that can run almost all modern games at 1080P resolution with all the in-game settings at maximum. And although MSI's enhanced cards are typically expensive, you can have the N660Ti Power Edition, with its fancy cooler and adjustable voltages for GPU, memory, and PLL circuitry, for a mere $10 premium over the $299.99 price NVIDIA thinks most 660-based cards will sell for. Two things impressed me about this card: one, it's very, very quiet, even under maximum load. While the fans were clearly audible when set at a fixed 60% or higher for the overclocking runs, at stock speeds with the fans control on "Auto" I couldn't get them to spin up audibly at all. Admittedly, this was on an open test bed, and it's probably going to be warmer inside your case...but your case will also muffle some of the noise that's produced. Let's just say I would be surprised were this card's fans ever audible. Second, the performance is simply amazing. The GK104 GPU of this card is identical to the one used in the GTX670, with the only difference being a 192-bit wide path to memory instead of a 256-bit wide path. 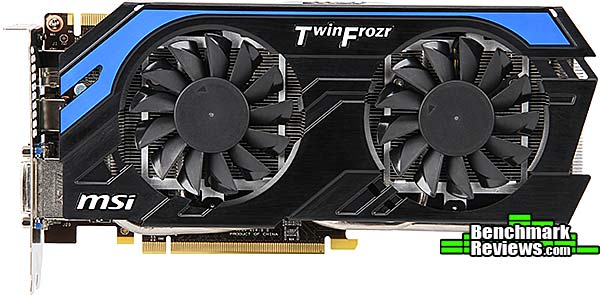
What this means is the lowest cost per FPS in virtually every one of these tests (the 7950 has a slight edge at stock clock speeds in two of the tests). Overclocked, it's no contest. And of course pure FPS isn't the only thing to keep in mind: as a Kepler-based card, the N660Ti benefits from NVIDIA's adaptive vSync and TXAA motion anti-aliasing features, both of which result in a smoother, visually superior gaming experience. Unless you're running multiple screens or 3D systems, it's hard to see why anyone would need more video card than this. MSI N660Ti PE ConclusionIMPORTANT: Although the rating and final score mentioned in this conclusion are made to be as objective as possible, please be advised that every author perceives these factors differently at various points in time. While we each do our best to ensure that all aspects of the product are considered, there are often times unforeseen market conditions and manufacturer changes which occur after publication that could render our rating obsolete. Please do not base any purchase solely on our conclusion, as it represents our product rating specifically for the product tested, which may differ from future versions. Benchmark Reviews begins our conclusion with a short summary for each of the areas that we rate. This card's standout performance was amazing. In some tests it's faster than cards that cost $100 to $200 more, and on a dollar-per-FPS basis there's really no comparison. NVIDIA's biggest problem with this card is that it will make even those who can easily afford a GTX670 wonder whether it's worth it to spend the extra money. I find the blue and black color scheme of this card easier on the eyes than the yellow and black shroud of MSI's N680GTX Lightning. If you have an MSI motherboard, all the better, since you'll be color co-ordinated. The construction quality of the card is very good, and it seems that vendors are finally learning how to apply thermal paste. My one complaint here is that the cooler plate only cools four of the eight GDDR5 memory chips.
Feature-wise, the N660Ti Power Edition has the same video goodness that's baked into any Kepler card: adaptive vSync, TXAA anti-aliasing, PhysX support, and more. MSI's dust-removing cooler and voltage control sweeten the deal. The accessories bundle is basic but functional. My review card was missing the SLI bridge that will be included with retail cards, but everything else was there. I'm used to high-performance video cards falling down at the value proposition. To get that last few FPS often requires that you pay a substantial premium. But the N660Ti provides exceptional performance, very close to that of the reference GTX670, for $90 less, and that's a huge win in anyone's book. Overclocking unlocked some extra performance, but let's face it: you're probably not going to need it. Of all the games I tested, the card fell below 30FPS at the highest resolution only in Metro 2033 at stock settings. Two of these babies in SLI might provide performance superior to that of MSI's own $600 N680GTX Lightning for only $20 more, and that's something to think about. Pros:
|
|||||||||||||||||||||||||||||||||||||||||||||||||||||||||||||||||||||||||||||||||||||||||||||||||||||||||||||||||||||||||||||||||||||||||||||||||||||||||||||||||||||||||||||||||||||||||||||||||||||||||||||||||||||||||||||||||||||||||||||||||||||||||||||||||||||||||||||||||||||||||||||||||||||||||||||||||||||||||||||||||||||||||||||||||||||||||||||||||||||||||||||||||||||||||||||||||||||||||||||||||||||||||||||||||||||||||||||||||||||||||||||||||||||||||||||||||||||||||||||||||||||||||||||||||||||||||||||||||||||||||||||||||||||||||||||||||||||||||||||||||||||||


Comments
Good read, and now it's official, I want one (or two) of them.