| HIS HD7950 IceQ Turbo 3GB Video Card |
| Reviews - Featured Reviews: Video Cards | ||||||||||||||||||||||||||||||||||||||||||||||||||||||||||||||||||||||||||||||||||||||||||||||||||||||||||||||||||||||||||||||||||||||||||||||||||||||||||||||||||||||||||||||||||||||||||||||||||||||||||||||||||||||||||||||||||||||||||||||||||||||||||||||||||||||||||||||||||||||||||||||||||||||||||||||||||||||||||||||||||||||||||||||||||||||||||||||||||||||||||||||||||||||||||||||||||||||||||||||||||||||||||||||||||||||||||||||||||||||||||||||||||||||||||||||||||||||||||||||||||||||||||||||||||||||||||||||||||||||||||||||||||||||||||||||||||||||||||||||||||||||||||||||||||||||||||||||||||||||||||||||||||||||||||||||||||||||||||||||||||||||||||||||||||||||||||||||||||||||||||||||||||||||||||||||||||||||||||||||||||||||||||||||||||||||||||||||||||||||||
| Written by Steven Iglesias-Hearst | ||||||||||||||||||||||||||||||||||||||||||||||||||||||||||||||||||||||||||||||||||||||||||||||||||||||||||||||||||||||||||||||||||||||||||||||||||||||||||||||||||||||||||||||||||||||||||||||||||||||||||||||||||||||||||||||||||||||||||||||||||||||||||||||||||||||||||||||||||||||||||||||||||||||||||||||||||||||||||||||||||||||||||||||||||||||||||||||||||||||||||||||||||||||||||||||||||||||||||||||||||||||||||||||||||||||||||||||||||||||||||||||||||||||||||||||||||||||||||||||||||||||||||||||||||||||||||||||||||||||||||||||||||||||||||||||||||||||||||||||||||||||||||||||||||||||||||||||||||||||||||||||||||||||||||||||||||||||||||||||||||||||||||||||||||||||||||||||||||||||||||||||||||||||||||||||||||||||||||||||||||||||||||||||||||||||||||||||||||||||||
| Wednesday, 25 April 2012 | ||||||||||||||||||||||||||||||||||||||||||||||||||||||||||||||||||||||||||||||||||||||||||||||||||||||||||||||||||||||||||||||||||||||||||||||||||||||||||||||||||||||||||||||||||||||||||||||||||||||||||||||||||||||||||||||||||||||||||||||||||||||||||||||||||||||||||||||||||||||||||||||||||||||||||||||||||||||||||||||||||||||||||||||||||||||||||||||||||||||||||||||||||||||||||||||||||||||||||||||||||||||||||||||||||||||||||||||||||||||||||||||||||||||||||||||||||||||||||||||||||||||||||||||||||||||||||||||||||||||||||||||||||||||||||||||||||||||||||||||||||||||||||||||||||||||||||||||||||||||||||||||||||||||||||||||||||||||||||||||||||||||||||||||||||||||||||||||||||||||||||||||||||||||||||||||||||||||||||||||||||||||||||||||||||||||||||||||||||||||||
HIS Radeon HD7950 IceQ Turbo 3GB Video Card
Manufacturer: Hightech Information System Limited Full Disclosure: The product sample used in this article has been provided by HIS. We have now seen round three of the AMD HD7000 series video card launch cycle and still NVIDIA have yet to fully show their hand, and until they do these new video cards are going to cost an arm and a leg. In this article we take a look at the more moderately priced (compared with the HD 7970) HIS Radeon HD7950 IceQ Turbo 3GB video card armed with AMD's Tahiti 28nm GPU Core. Sure enough it will run your favorite games with high settings at 1080p but for $399.99 at Newegg you might want to check your finances before you click that buy button. Benchmark Reviews aims to provide you with an unbiased review of the HIS Radeon HD7950 IceQ Turbo 3GB video card (model H795QT3G2M) and report back our findings, keeping you informed on the latest technologies available on the market today.
For this review we have a comparative range of video cards in our usual mixture of DX10 / DX11 synthetic benchmarks and current games to get a good idea where it fits in performance and price wise. We also intend to overclock the HIS HD7950 IceQ Turbo to its limits and see if the 'IceQ Cooler' really has what it takes to cool the GPU and other components effectively, so without further delay let's move on and get stuck in. Closer Look: HIS Radeon HD7950The HIS HD7950 IceQ Turbo is packed in a relatively large package, accessories wise there is only a DVI to VGA adapter included and a single crossfire bridge. No power adapter cables are included but I never use them any way. There was a new accessory bundled with the HIS HD 7870 IceQ Turbo 2GB video card that I had expected to see return, I am referring to the "Weight Lifter" video card support system, but unfortunately it was not bundled with this model.
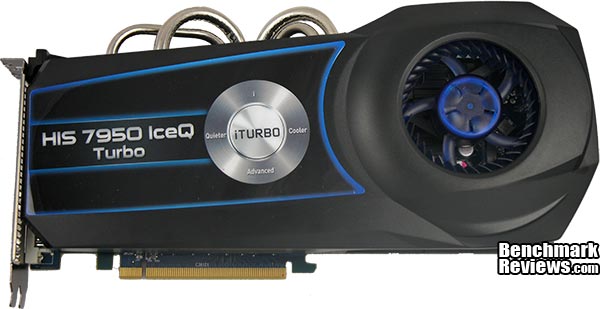
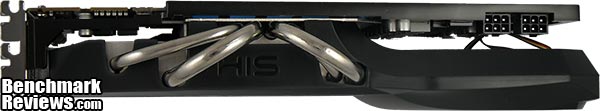
The HIS Radeon HD7950 IceQ Turbo video card has two CrossFire connections which means 2/3-way CrossFire and also QuadFire (four GPU) configurations are supported. On the right we spy two 6-pin power connectors, HIS recommend using at least a 500W power supply. The HD7950 IceQ Turbo uses two 8mm and two 6mm copper heatpipes to transfer the heat from the GPU to the main heatsink fin array. We have become accustomed to having these heatpipes either nickel plated or well polished, and this finish does not disappoint.
The HIS HD7950 IceQ Turbo video card cooling design calls upon what HIS call a "Black Hole Impeller". What this means to us end users is that regardless of whether this video card is in single or dual configuration, it will not be starved of airflow because it can take in air from both sides of the fan. The shroud doesn't completely cover the heatsink so that means some warm air will exhaust inside your case, but most of it will exhaust out the rear. When we look at the HIS HD7950 IceQ Turbo video card it's easy to see why it might need a bit of support, measuring just a little less than 12" long and it is also a double slot design.
The IceQ HSF assembly features an 57mm single blower fan that cools the 28nm Tahiti HD7950 GPU really well while remaining virtually silent (on auto).
For output we have two mini display port connectors, a full size HDMI port and one dual-link DVI-I connector. Bundled with the card you get a DVI to D-SUB adapter, so as far as connectors go HIS have really covered all the bases here. HIS HD7950 IceQ Turbo Detailed FeaturesIn this section we shall take an in-depth look at the HIS HD7950 IceQ Turbo 3GB video card and see what makes it tick.
With the cooling assembly removed we can get a better look at the aluminum/copper heatsink. The high grade power delivery setup (VRM) also demands some cooling and is fitted with its own aluminum heatsink. The IceQ cooler is good but later in this article you will see that the Tahiti 28nm GPU gives it a good run for its money, I suspect that the IceQ X cooler from HIS might do a better job.
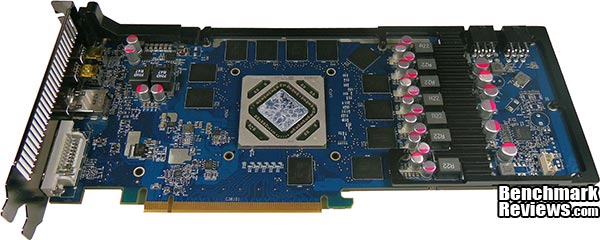
With the cooler assembly fully removed we also get a better look at the board. The overall layout of all the components is very tidy as we are used to on high end video cards. Advances in nano-scale manufacturing technologies mean that video increasing density memory can be squeezed into a much smaller package, here we have 12 memory modules serving 3GB, just two years ago 1GB video cards would have needed eight modules! All in all the PCB looks good with no real waste of space and the soldering quality is of a very high standard.
The back of the PCB is utilised mainly for resistors and the soldering quality is excellent for such tiny components. Man loses the war to the machine when it comes to detailed work like this. These days you won't generally see RAM on the reverse side of a video card thanks to the smaller manufacturing process that allows more density in a much smaller package.
The HIS HD7950 IceQ Turbo features a support brace that surrounds nearly 3/4 of the PCB and also incorporates the VRM heatsink. This design is better than nothing but still doesn't stop the PCB from flexing due to the overall weight of the assembled card pulling south. I much would much prefer to see the inclusion of the weight lifter support accessory that came bundled with the HIS HD 7870 IceQ Turbo model as in the long run I expect that warping will occur.
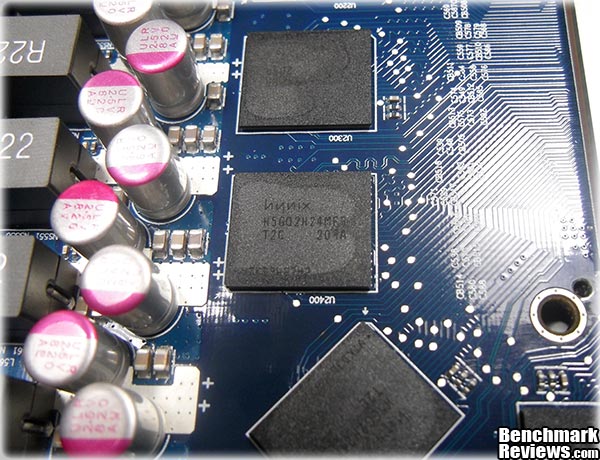
The HIS HD7950 IceQ Turbo uses 3GB of hynix H5GQ2H24MFR-TC2 memory divided between twelve modules, rated at 2.5GHz (5GHz effective) at 1.5V.
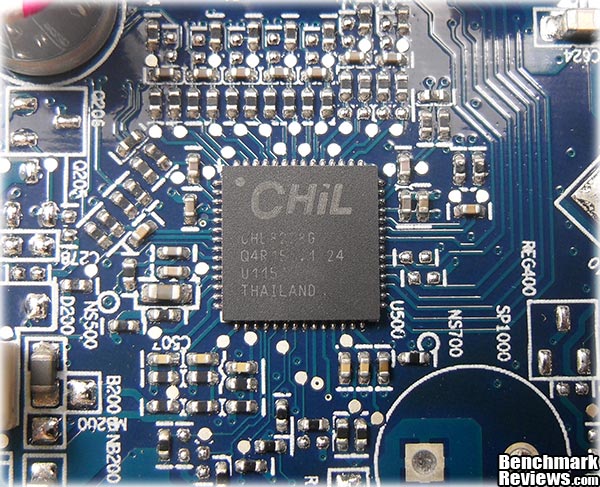
For voltage control HIS have utilised the CHiL CHL 8228G, a popular and feature rich voltage control chip in the Radeon HD 79XX series of video cards. HIS Radeon HD7950 IceQ Turbo FeaturesIceQ - Cooler, Quieter.
iTurbo
Source: hisdigital.com. HIS H795QT3G2M Specifications
Source: HIS Reviewers Guide. VGA Testing MethodologyThe Microsoft DirectX-11 graphics API is native to the Microsoft Windows 7 Operating System, and will be the primary O/S for our test platform. DX11 is also available as a Microsoft Update for the Windows Vista O/S, so our test results apply to both versions of the Operating System. The majority of benchmark tests used in this article are comparative to DX11 performance, however some high-demand DX10 tests have also been included. According to the Steam Hardware Survey published for the month ending January 2012, the most popular gaming resolution is 1920x1080 with 1680x1050 hot on its heels, our benchmark performance tests concentrate on these higher-demand resolutions: 1.76MP 1680x1050 and 2.07MP 1920x1080 (22-24" widescreen LCD monitors), as they are more likely to be used by high-end graphics solutions, such as those tested in this article. In each benchmark test there is one 'cache run' that is conducted, followed by five recorded test runs. Results are collected at each setting with the highest and lowest results discarded. The remaining three results are averaged, and displayed in the performance charts on the following pages. A combination of synthetic and video game benchmark tests have been used in this article to illustrate relative performance among graphics solutions. Our benchmark frame rate results are not intended to represent real-world graphics performance, as this experience would change based on supporting hardware and the perception of individuals playing the video game.
Intel Z68 Test System
DirectX-10 Benchmark Applications
DirectX-11 Benchmark Applications
Video Card Test Products
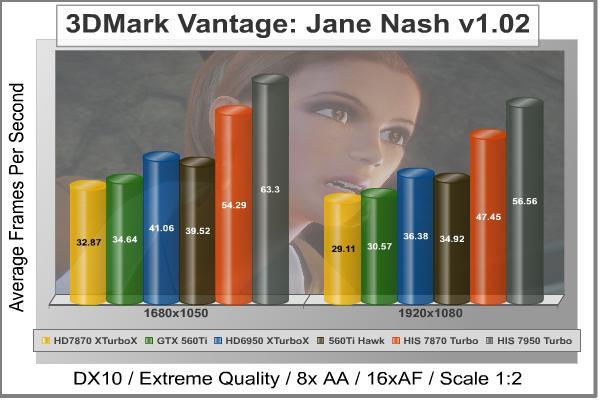
DX10: 3DMark Vantage3DMark Vantage is a PC benchmark suite designed to test the DirectX10 graphics card performance. FutureMark 3DMark Vantage is the latest addition the 3DMark benchmark series built by FutureMark corporation. Although 3DMark Vantage requires NVIDIA PhysX to be installed for program operation, only the CPU/Physics test relies on this technology. 3DMark Vantage offers benchmark tests focusing on GPU, CPU, and Physics performance. Benchmark Reviews uses the two GPU-specific tests for grading video card performance: Jane Nash and New Calico. These tests isolate graphical performance, and remove processor dependence from the benchmark results. 3DMark Vantage GPU Test: Jane NashOf the two GPU tests 3DMark Vantage offers, the Jane Nash performance benchmark is slightly less demanding. In a short video scene the special agent escapes a secret lair by water, nearly losing her shirt in the process. Benchmark Reviews tests this DirectX-10 scene at 1680x1050 and 1920x1080 resolutions, and uses Extreme quality settings with 8x anti-aliasing and 16x anisotropic filtering. The 1:2 scale is utilized, and is the highest this test allows. By maximizing the processing levels of this test, the scene creates the highest level of graphical demand possible and sorts the strong from the weak.
Cost Analysis: Jane Nash (1680x1050)3DMark Vantage GPU Test: New CalicoNew Calico is the second GPU test in the 3DMark Vantage test suite. Of the two GPU tests, New Calico is the most demanding. In a short video scene featuring a galactic battleground, there is a massive display of busy objects across the screen. Benchmark Reviews tests this DirectX-10 scene at 1680x1050 and 1920x1080 resolutions, and uses Extreme quality settings with 8x anti-aliasing and 16x anisotropic filtering. The 1:2 scale is utilized, and is the highest this test allows. Using the highest graphics processing level available allows our test products to separate themselves and stand out (if possible).
Cost Analysis: New Calico (1680x1050)Video Card Test Products
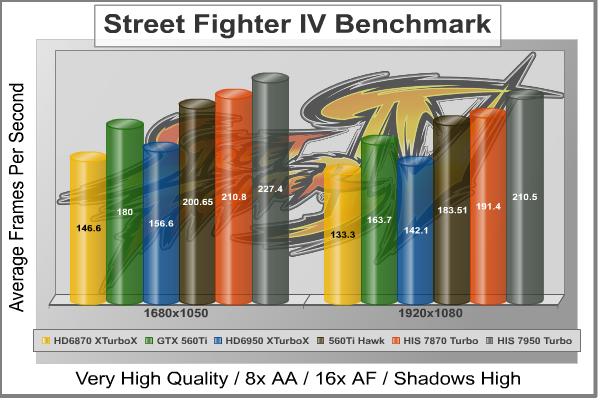
DX10: Street Fighter IVCapcom's Street Fighter IV is part of the now-famous Street Fighter series that began in 1987. The 2D Street Fighter II was one of the most popular fighting games of the 1990s, and now gets a 3D face-lift to become Street Fighter 4. The Street Fighter 4 benchmark utility was released as a novel way to test your system's ability to run the game. It uses a few dressed-up fight scenes where combatants fight against each other using various martial arts disciplines. Feet, fists and magic fill the screen with a flurry of activity. Due to the rapid pace, varied lighting and the use of music this is one of the more enjoyable benchmarks. Street Fighter IV uses a proprietary Capcom SF4 game engine, which is enhanced over previous versions of the game. Using the highest quality DirectX-10 settings with 8x AA and 16x AF, a mid to high end card will ace this test, but it will still weed out the slower cards out there.
Cost Analysis: Street Fighter IV (1680x1050)Video Card Test Products
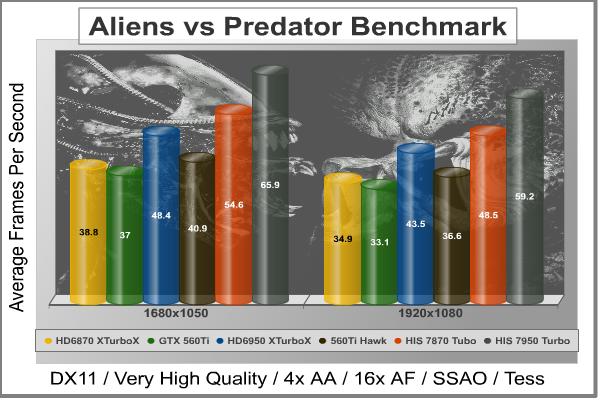
DX11: Aliens vs PredatorAliens vs. Predator is a science fiction first-person shooter video game, developed by Rebellion, and published by Sega for Microsoft Windows, Sony PlayStation 3, and Microsoft Xbox 360. Aliens vs. Predator utilizes Rebellion's proprietary Asura game engine, which had previously found its way into Call of Duty: World at War and Rogue Warrior. The self-contained benchmark tool is used for our DirectX-11 tests, which push the Asura game engine to its limit. In our benchmark tests, Aliens vs. Predator was configured to use the highest quality settings with 4x AA and 16x AF. DirectX-11 features such as Screen Space Ambient Occlusion (SSAO) and tessellation have also been included, along with advanced shadows.
Cost Analysis: Aliens vs Predator (1680x1050)Video Card Test Products
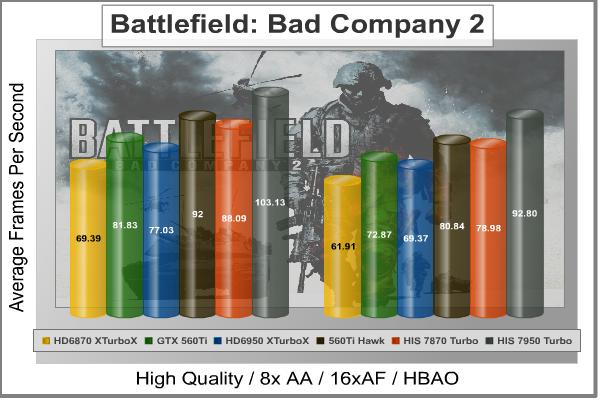
DX11: Battlefield Bad Company 2The Battlefield franchise has been known to demand a lot from PC graphics hardware. DICE (Digital Illusions CE) has incorporated their Frostbite-1.5 game engine with Destruction-2.0 feature set with Battlefield: Bad Company 2. Battlefield: Bad Company 2 features destructible environments using Frostbit Destruction-2.0, and adds gravitational bullet drop effects for projectiles shot from weapons at a long distance. The Frostbite-1.5 game engine used on Battlefield: Bad Company 2 consists of DirectX-10 primary graphics, with improved performance and softened dynamic shadows added for DirectX-11 users. At the time Battlefield: Bad Company 2 was published, DICE was also working on the Frostbite-2.0 game engine. This upcoming engine will include native support for DirectX-10.1 and DirectX-11, as well as parallelized processing support for 2-8 parallel threads. This will improve performance for users with an Intel Core-i7 processor. Unfortunately, the Extreme Edition Intel Core i7-980X six-core CPU with twelve threads will not see full utilization. In our benchmark tests of Battlefield: Bad Company 2, the first three minutes of action in the single-player raft night scene are captured with FRAPS. Relative to the online multiplayer action, these frame rate results are nearly identical to daytime maps with the same video settings. The Frostbite-1.5 game engine in Battlefield: Bad Company 2 appears to equalize our test set of video cards, and despite AMD's sponsorship of the game it still plays well using any brand of graphics card.
Cost Analysis: Battlefield: Bad Company 2 (1680x1050)Video Card Test Products
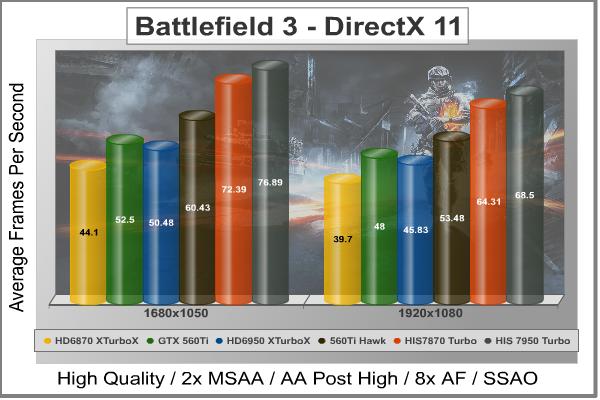
DX11: BattleField 3Battlefield 3 is leaps ahead of its time with the power of Frostbite 2, DICE's new cutting-edge game engine. This state-of-the-art technology is the foundation on which Battlefield 3 is built - delivering enhanced visual quality, a grand sense of scale, massive destruction, dynamic audio and character animation utilizing ANT technology as seen in the latest EA SPORTS games. Battlefield 3 also delivers all-out vehicle warfare with an incredible Array of vehicles to control, including Jets, tanks, jeeps and helicopters. In our benchmark tests of Battlefield 3, the first two minutes of action in the single-player mission 'Operation swordbreaker' (after skipping the interview scene) are captured with FRAPS. Relative to the online multiplayer action, these frame rate results are nearly identical to daytime maps with the same video settings. The Frostbite 2 game engine in Battlefield 3 can strain even the most powerful video cards when all the settings are on max, so for these mid range video cards more moderate settings are used.
Cost Analysis: Battlefield 3 (1680x1050)Video Card Test Products
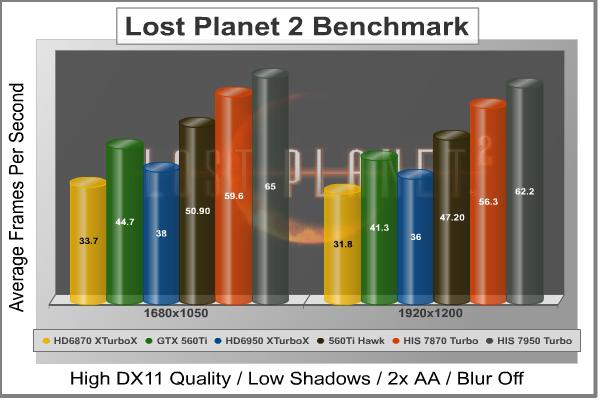
DX11: Lost Planet 2Lost Planet 2 is the second instalment in the saga of the planet E.D.N. III, ten years after the story of Lost Planet: Extreme Condition. The snow has melted and the lush jungle life of the planet has emerged with angry and luscious flora and fauna. With the new environment comes the addition of DirectX-11 technology to the game. Lost Planet 2 takes advantage of DX11 features including tessellation and displacement mapping on water, level bosses, and player characters. In addition, soft body compute shaders are used on 'Boss' characters, and wave simulation is performed using DirectCompute. These cutting edge features make for an excellent benchmark for top-of-the-line consumer GPUs. The Lost Planet 2 benchmark offers two different tests, which serve different purposes. This article uses tests conducted on benchmark B, which is designed to be a deterministic and effective benchmark tool featuring DirectX 11 elements.
Cost Analysis: Lost Planet 2 (1680x1050)Video Card Test Products
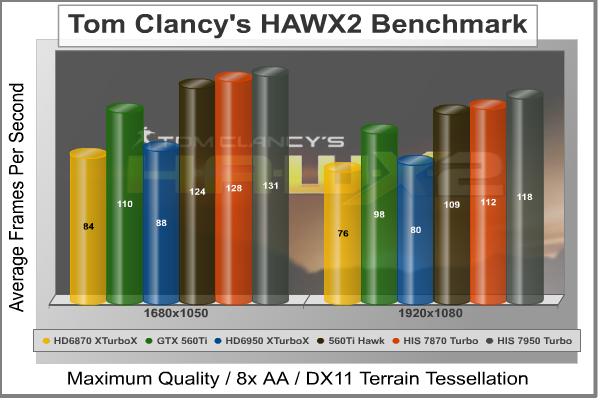
DX11: Tom Clancy's HAWX 2Tom Clancy's H.A.W.X.2 has been optimized for DX11 enabled GPUs and has a number of enhancements to not only improve performance with DX11 enabled GPUs, but also greatly improve the visual experience while taking to the skies. The game uses a hardware terrain tessellation method that allows a high number of detailed triangles to be rendered entirely on the GPU when near the terrain in question. This allows for a very low memory footprint and relies on the GPU power alone to expand the low resolution data to highly realistic detail. The Tom Clancy's HAWX2 benchmark uses normal game content in the same conditions a player will find in the game, and allows users to evaluate the enhanced visuals that DirectX-11 tessellation adds into the game. The Tom Clancy's HAWX2 benchmark is built from exactly the same source code that's included with the retail version of the game. HAWX2's tessellation scheme uses a metric based on the length in pixels of the triangle edges. This value is currently set to 6 pixels per triangle edge, which provides an average triangle size of 18 pixels. The end result is perhaps the best tessellation implementation seen in a game yet, providing a dramatic improvement in image quality over the non-tessellated case, and running at playable frame rates across a wide range of graphics hardware.
Cost Analysis: HAWX 2 (1680x1050)Video Card Test Products
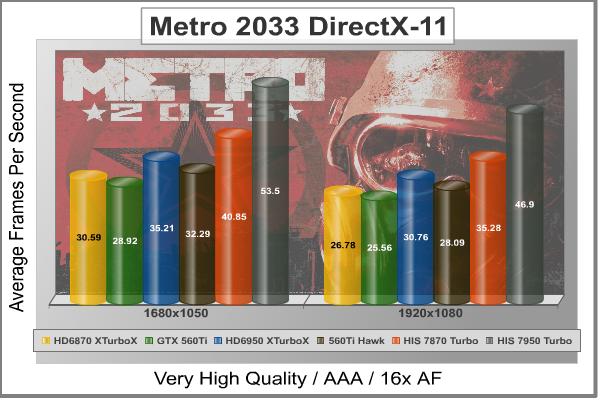
DX11: Metro 2033Metro 2033 is an action-oriented video game with a combination of survival horror, and first-person shooter elements. The game is based on the novel Metro 2033 by Russian author Dmitry Glukhovsky. It was developed by 4A Games in Ukraine and released in March 2010 for Microsoft Windows. Metro 2033 uses the 4A game engine, developed by 4A Games. The 4A Engine supports DirectX-9, 10, and 11, along with NVIDIA PhysX and GeForce 3D Vision. The 4A engine is multi-threaded in such that only PhysX had a dedicated thread, and uses a task-model without any pre-conditioning or pre/post-synchronizing, allowing tasks to be done in parallel. The 4A game engine can utilize a deferred shading pipeline, and uses tessellation for greater performance, and also has HDR (complete with blue shift), real-time reflections, color correction, film grain and noise, and the engine also supports multi-core rendering. Metro 2033 featured superior volumetric fog, double PhysX precision, object blur, sub-surface scattering for skin shaders, parallax mapping on all surfaces and greater geometric detail with a less aggressive LODs. Using PhysX, the engine uses many features such as destructible environments, and cloth and water simulations, and particles that can be fully affected by environmental factors. NVIDIA has been diligently working to promote Metro 2033, and for good reason: it's one of the most demanding PC video games we've ever tested. When their flagship GeForce GTX 480 struggles to produce 27 FPS with DirectX-11 anti-aliasing turned to to its lowest setting, you know that only the strongest graphics processors will generate playable frame rates. All of our tests enable Advanced Depth of Field and Tessellation effects, but disable advanced PhysX options.
Cost Analysis: Metro 2033 (1680x1050)Video Card Test Products
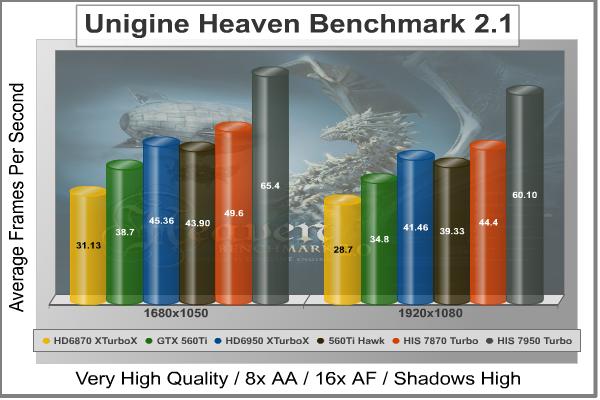
DX11: Unigine Heaven 2.1The Unigine Heaven 2.1 benchmark is a free publicly available tool that grants the power to unleash the graphics capabilities in DirectX-11 for Windows 7 or updated Vista Operating Systems. It reveals the enchanting magic of floating islands with a tiny village hidden in the cloudy skies. With the interactive mode, emerging experience of exploring the intricate world is within reach. Through its advanced renderer, Unigine is one of the first to set precedence in showcasing the art assets with tessellation, bringing compelling visual finesse, utilizing the technology to the full extend and exhibiting the possibilities of enriching 3D gaming. The distinguishing feature in the Unigine Heaven benchmark is a hardware tessellation that is a scalable technology aimed for automatic subdivision of polygons into smaller and finer pieces, so that developers can gain a more detailed look of their games almost free of charge in terms of performance. Thanks to this procedure, the elaboration of the rendered image finally approaches the boundary of veridical visual perception: the virtual reality transcends conjured by your hand. Although Heaven-2.1 was recently released and used for our DirectX-11 tests, the benchmark results were extremely close to those obtained with Heaven-1.0 testing. Since only DX11-compliant video cards will properly test on the Heaven benchmark, only those products that meet the requirements have been included.
Cost Analysis: Unigine Heaven (1680x1050)Video Card Test Products
HIS HD7950 IceQ Turbo TemperaturesBenchmark tests are always nice, so long as you care about comparing one product to another. But when you're an overclocker, gamer, or merely a PC hardware enthusiast who likes to tweak things on occasion, there's no substitute for good information. Benchmark Reviews has a very popular guide written on Overclocking Video Cards, which gives detailed instruction on how to tweak a graphics cards for better performance. Of course, not every video card has overclocking head room. Some products run so hot that they can't suffer any higher temperatures than they already do. This is why we measure the operating temperature of the video card products we test. To begin my testing, I use GPU-Z to measure the temperature at idle as reported by the GPU. Next I use FurMark's "Torture Test" to generate maximum thermal load and record GPU temperatures at high-power 3D mode. The ambient room temperature remained at a stable 23°C throughout testing. FurMark does two things extremely well: drive the thermal output of any graphics processor higher than applications of video games realistically could, and it does so with consistency every time. Furmark works great for testing the stability of a GPU as the temperature rises to the highest possible output. The temperatures discussed below are absolute maximum values, and not representative of real-world performance.
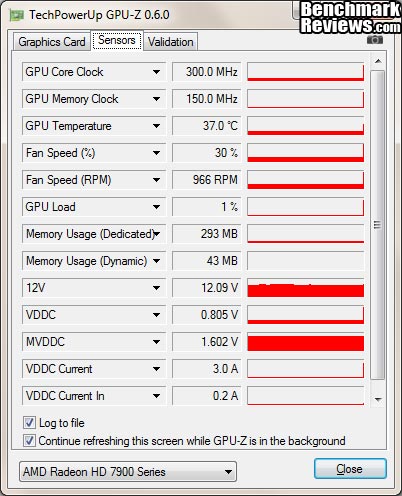
As previously stated my ambient temperature remained at a stable 23°C throughout the testing procedure, the cooler is efficient and a heavy load from FurMark raises the temperature from 37°C (30% fan speed) idle, to 70°C load with an automatic fan speed of 60%. Putting the fan on manual and cranking it up to 100% saw the temperature drop to 70°C but the fan predictably makes extra noise. The noise level is tolerable (loud but not too loud), your mileage will vary; everyone has their own tolerance levels. The default profile is very well balanced, but cranking the fan to 100% gives us a 5°C reduction in load temperature. The 28nm Tahiti GPU on the Radeon HD 7950 may well be the limit of what the IceQ cooler can comfortably manage and is possibly the reason why this particular model does not come overclocked to 1GHz as we see with a lot of the HD 7XXX series video cards released thus far. In the next section we will look at power consumption figures, let's go. VGA Power ConsumptionLife is not as affordable as it used to be, and items such as gasoline, natural gas, and electricity all top the list of resources which have exploded in price over the past few years. Add to this the limit of non-renewable resources compared to current demands, and you can see that the prices are only going to get worse. Planet Earth is needs our help, and needs it badly. With forests becoming barren of vegetation and snow capped poles quickly turning brown, the technology industry has a new attitude towards turning "green". I'll spare you the powerful marketing hype that gets sent from various manufacturers every day, and get right to the point: your computer hasn't been doing much to help save energy... at least up until now. For power consumption tests, Benchmark Reviews utilizes an 80-Plus Gold rated Corsair HX750w (model: CMPSU-750HX). This power supply unit has been tested to provide over 90% typical efficiency by Ecos Plug Load Solutions. To measure isolated video card power consumption, I used the energenie ENER007 power meter made by Sandal Plc (UK). A baseline test is taken without a video card installed inside our test computer system, which is allowed to boot into Windows-7 and rest idle at the login screen before power consumption is recorded. Once the baseline reading has been taken, the graphics card is installed and the system is again booted into Windows and left idle at the login screen. Our final loaded power consumption reading is taken with the video card running a stress test using FurMark. Below is a chart with the isolated video card power consumption (not system total) displayed in Watts for each specified test product:
* Results are accurate to within +/- 5W.
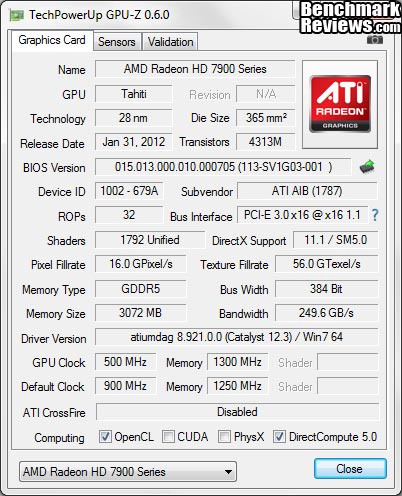
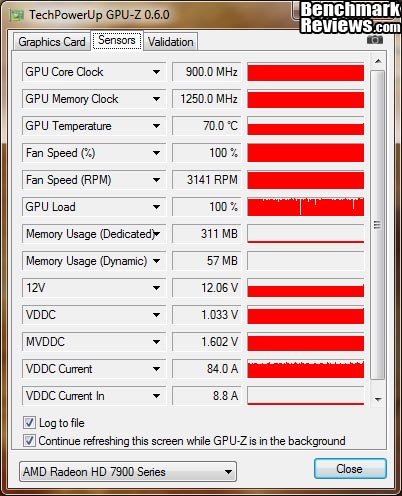
The HIS HD7950 IceQ Turbo consumes 24 (90-66) watts at idle and 205 (271-66) watts when running full load using the test method outlined above. As we can see in the GPU-Z screenshot below the HIS HD7950 IceQ Turbo uses 0.805v when idle, when under load it uses 1.033v.
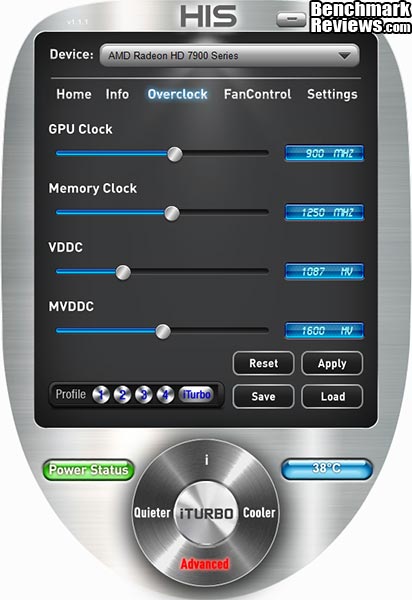
In the next section we will be discussing our overclocking with the HIS HD7950 IceQ Turbo 3GB video card. HIS HD7950 IceQ Turbo OverclockingBefore I start overclocking I like to get a little bit of information, firstly I like to establish operating temperatures and since we know these are within a comfortable threshold and the IceQ cooler is capable we can quickly move on. Next I like to know what the voltage and clock limits are, so I fired up HIS' iTurbo overclocking utility. Now, I don't know if it is a bug or whether it is a feature of this version release (V 1.1.1) but there seemed to be an infinite range of adjustment with the GPU and Memory clock sliders in the iTurbo Overclock tab (image below). I could set both of the sliders as far right as they would go and hit the apply button and then the slider limit would extend again and allow for higher clocks to be selected. With this capability I know I can squeeze every last drop of performance out of the HIS HD7950 IceQ Turbo 3GB. With a lot of time to tweak this companion tool might well set some speed records.
Raising the vCore (VDDC) to 1.135V and the memory voltage (MVDDC) to 1.680V, I was able to push the GPU to 1065MHz (+165MHz) and the memory to 1500MHz (+250MHz - 6GHz effective) which required very little effort at all. I am impressed by the capabilities of the HIS HD7950 IceQ Turbo 1GB video card. Running FurMark while the GPU was running at these speeds produced a lot of heat so I decided to call it a day, with better cooling (Water/DICE/LN2) I imagine this card will overclock like a beast, there were no signs of artifacts and I really wanted to keep going but feared that I would damage the GPU.
Armed with a 165MHz GPU core overclock and a 250MHz memory overclock, we went back to the bench and ran through the entire test suite. Overall we saw an average 13.20% increase in scores (at 1920x1080 resolution), with performance mostly on par with (and sometimes besting) 1680x1050 scores. This is very good considering the card is factory overclocked already. We also re ran temperature tests at the overclocked speeds at the same ambient temperature of 23°C. The IceQ Cooler on the HIS HD7950 did not fail but was definitely at its limits, pushing the temperature up with FurMark saw the GPU load temperature rise to 86°C (auto fan). Next I tested at 100% fan speed and the temperature dropped to 82°C, chopping a mere 4°C off the top. That's all of the testing over, in the next section I will deliver my final thoughts and conclusion. Radeon HD 7950 Final ThoughtsThe HIS HD7950 IceQ Turbo is a really overwhelming video card; for starters you may be overwhelmed by the price, next you will be overwhelmed by its physical size and weight. When you install it into your system you will be overwhelmed by its performance and power usage. The HIS HD7950 IceQ Turbo consumes 24 watts at idle and 205 watts when running full load! Temperatures are 37°C idle and 75°C load, putting the fan on manual and cranking it up to 100% saw the temperature drop to 70°C. I believe we may have found the limits of the HIS iCooler GPU cooler. This video card overclocked reasonably well considering it was already factory overclocked on both the GPU core and memory out of the box, and gained an average 13.20% increase in scores across the range of benchmark tests. With a more capable cooler and more time to tweak I'm sure we could have maybe squeezed more out of both clocks, thanks to the iTurbo software from HIS there is endless range to play with. HIS HD 7950 IceQ Turbo ConclusionImportant: In this section I am going to write a brief five point summary on the following categories; Performance, Appearance, Construction, Functionality and Value. These views are my own and help me to give the HIS HD7950 IceQ Turbo 3GB Video Card a rating out of 10. A high or low score does not necessarily mean that it is better or worse than a similar video card that has been reviewed by another writer here at Benchmark Reviews, which may have got a higher or lower score. It is however a good indicator of whether the HIS HD7950 IceQ Turbo 3GB video card is good or not. I would strongly urge you to read the entire review, if you have not already, so that you can make an educated decision for yourself.
The graphics performance of the HIS HD7950 IceQ Turbo is good enough for playing most games at 1920x1080 with the highest settings. There are obviously some games that will test it if you put everything on maximum. Its performance out of the box was exceptional which I expected, for me the HD7000 series represents what the HD6000 series could and should have been - a proper upgrade. The HIS HD7950 IceQ Turbo sits at the top of the pile in every test but does so at a much higher cost. The appearance rating of the HIS HD7950 IceQ Turbo is up for debate. There is not a lot I can say about a discrete graphics card that will get installed and then be out of sight. When we consider looking up close at the PCB cleanliness and the soldering quality then it does deserve a high rating. There are some that will surely disagree but thanks to the graphic nature of this review you can easily make your mind up for yourself. If anything lets it down it would be the untreated heatpipes Construction is excellent as you would expect from a company with a good reputation like HIS, despite the use of plastic for the fan shroud the whole package feels really solid. Taking the card to pieces and reconstructing it was a breeze and everything lined up perfectly, the IceQ HSF assembly is solid and is well made which reassures you that it is no fragile piece of hardware. It is really heavy and there is a PCB support fitted to minimise warping of the PCB, but the combined weight of the card and cooler is still quite a lot and extra support will be needed. His Included a weight lifter support accessory with the HD 7870 IceQ turbo that uses the same cooler but neglected to include one with this model. Functionality is very good, I only wish that the IceQ cooler could have performed that bit better and give me better overclocking headroom as I am convinced there is still more performance to be had. To bring a load temperature down by 5C is relatively easy, but to do it while remaining virtually silent is something that all AIB partners need to aspire to. Thanks to the HIS iTurbo companion software tool V1.1.1 Clock speed limits are a non issue and there was also enough voltage adjustment to attain higher overclocks. The HIS Radeon HD7950 IceQ Turbo 3GB video card model H795QT3G2M will cost you $399.99 at Newegg, but with the lack of fresh new competing video cards from the green team AMD and its AIB's are practically free to name their own prices. On average the HIS Radeon HD7950 IceQ Turbo costs $7/FPS in our benchmark tests (1920x1080) based on the current MSRP above, for a video card like this you will really have to want it regardless of the high price, either that or choose it based on which games you prefer the most. Pros:
|
||||||||||||||||||||||||||||||||||||||||||||||||||||||||||||||||||||||||||||||||||||||||||||||||||||||||||||||||||||||||||||||||||||||||||||||||||||||||||||||||||||||||||||||||||||||||||||||||||||||||||||||||||||||||||||||||||||||||||||||||||||||||||||||||||||||||||||||||||||||||||||||||||||||||||||||||||||||||||||||||||||||||||||||||||||||||||||||||||||||||||||||||||||||||||||||||||||||||||||||||||||||||||||||||||||||||||||||||||||||||||||||||||||||||||||||||||||||||||||||||||||||||||||||||||||||||||||||||||||||||||||||||||||||||||||||||||||||||||||||||||||||||||||||||||||||||||||||||||||||||||||||||||||||||||||||||||||||||||||||||||||||||||||||||||||||||||||||||||||||||||||||||||||||||||||||||||||||||||||||||||||||||||||||||||||||||||||||||||||||||


Comments
Looks like you will need an update.
Enjoyed the review, especially the detail involved.