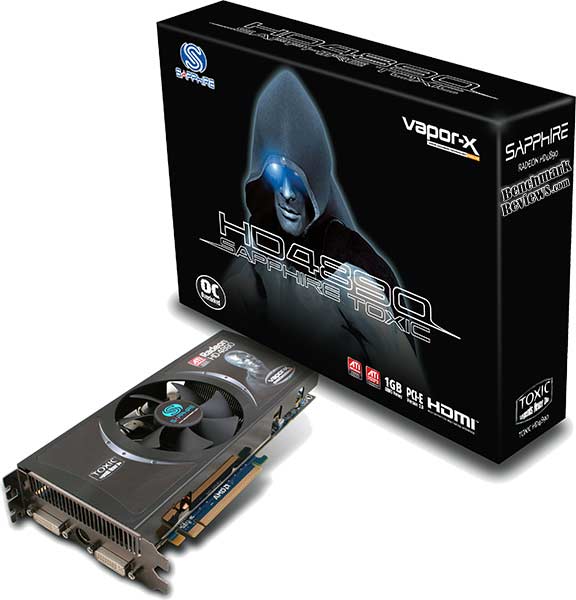
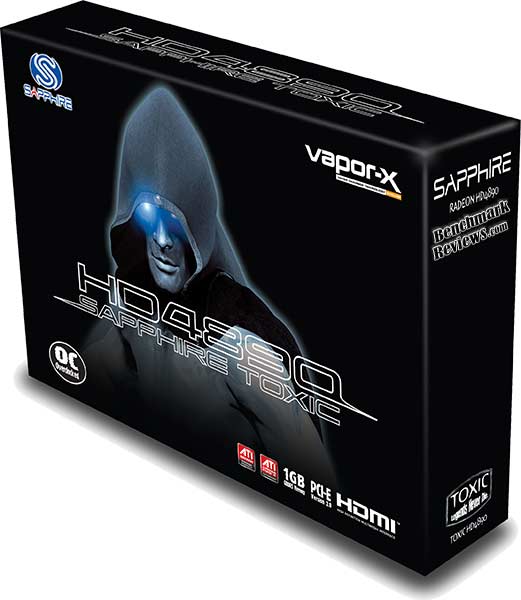
| Sapphire HD4890 Toxic Vapor-X 11150-01-40R |
| Reviews - Featured Reviews: Video Cards | ||||||||||||||||||||||||||||||||||||||||||||||||||||||||||||||||||||||||||||||||||||||||||||||||||||||||||||||||||||||||||||||||||||||||||||||||||||||||||||||||||||||||||||||||||||||||||||||||||||||||||||||||||||||||||||||||||||||||||||||||||||||||||||||||||||||||||||||||||||||||||||||||||||||||||||||||||||||||||||||||||||||||||||||||||||||||||||||||||||||||||||||||||||||||||||||||||||||||||||||||||||||||||||||||||||||||||||||||||||||||||||||||||||||||||||||||||||||||||||||||||||||||||||||||||||||||||||||||||||||||||||||||||||||||||||||||||||||||||||||||||||
| Written by Olin Coles | ||||||||||||||||||||||||||||||||||||||||||||||||||||||||||||||||||||||||||||||||||||||||||||||||||||||||||||||||||||||||||||||||||||||||||||||||||||||||||||||||||||||||||||||||||||||||||||||||||||||||||||||||||||||||||||||||||||||||||||||||||||||||||||||||||||||||||||||||||||||||||||||||||||||||||||||||||||||||||||||||||||||||||||||||||||||||||||||||||||||||||||||||||||||||||||||||||||||||||||||||||||||||||||||||||||||||||||||||||||||||||||||||||||||||||||||||||||||||||||||||||||||||||||||||||||||||||||||||||||||||||||||||||||||||||||||||||||||||||||||||||||
| Tuesday, 09 June 2009 | ||||||||||||||||||||||||||||||||||||||||||||||||||||||||||||||||||||||||||||||||||||||||||||||||||||||||||||||||||||||||||||||||||||||||||||||||||||||||||||||||||||||||||||||||||||||||||||||||||||||||||||||||||||||||||||||||||||||||||||||||||||||||||||||||||||||||||||||||||||||||||||||||||||||||||||||||||||||||||||||||||||||||||||||||||||||||||||||||||||||||||||||||||||||||||||||||||||||||||||||||||||||||||||||||||||||||||||||||||||||||||||||||||||||||||||||||||||||||||||||||||||||||||||||||||||||||||||||||||||||||||||||||||||||||||||||||||||||||||||||||||||
Sapphire HD4890 ToxicSapphire has four ranges for most top-end products they offer: standard, Vapor-X, Toxic, and Atomic. While each is different in its own right, for most gamers it is the Toxic design that draws the most attention. Combining the Vapor-X cooling with overclocks seen on the Atomic, the Toxic brand is the most elite air-cooled video card Sapphire offers. In this article, Benchmark Reviews tests the performance on the Sapphire HD4890 Toxic Vapor-X 11150-01-40R video card against many of the other best graphics accelerator solutions in the price segment. FPS tests compare frame rates between low to high-end video cards, including a pair of CrossFireX Radeon HD 4770's. The Radeon HD 4800-series has been a real success for AMD, and combined with Phenom II Processors they create a synergistic effect called the Dragon platform. The new Radeon RV790 GPU is the next well-bred concept from the ATI labs, and in this article Benchmark Reviews tests the performance of the new Sapphire Radeon HD 4890 GDDR5 video card 100269SR against the rest of the high-end segment. Since the Radeon 4890 is the most-powerful single GPU video card produced by AMD, it's going to be a tough fight to beat out NVIDIA. Faced by an economy in recession, it could be smarter to refine the products you have than to design and produce new ones. This is the basis for my introduction, and the concept behind AMD/ATI's business strategy for the discrete graphics market. Which raises the question: should a video card manufacturer improve and perfect their current products, or should they spend money they can't spare on a new design? AMD has decided to hone the RV770 GPU and offer the RV790 as a result, while the competition is pledging itself to expensive and unnecessary ultra high-end products for a shrinking market.
The video card industry is hurting as bad as anyone during this economic recession, and nobody is walking around happy about PC graphics these days. They can't, really, not when many of the latest video game titles for the personal computer are released only after console versions have been made available first. Even once you get past that burn, you're greeted by yet another. In 2008 there were dozens of great video games released on the PC platform, but very few of them demanded any more graphical processing power than most games demanded back in 2006. Of the recent PC video games released, Far Cry 2 is one of the very few titles which demand modern graphics to enjoy a decent frame rate performance; something that older games such as Crysis and Battlefield 2 are also still guilty of. Yet, somehow the need for better PC graphics hasn't become a prerequisite for most other new games, because when Battlefield 2042 and Crysis 2 came out they both required less graphical processing power than the former versions. Because of the various factors working against desktop graphics, I'd say that now is the time for manufacturers to stop building a bigger mousetrap, and instead build it better. About Sapphire Technology
|
||||||||||||||||||||||||||||||||||||||||||||||||||||||||||||||||||||||||||||||||||||||||||||||||||||||||||||||||||||||||||||||||||||||||||||||||||||||||||||||||||||||||||||||||||||||||||||||||||||||||||||||||||||||||||||||||||||||||||||||||||||||||||||||||||||||||||||||||||||||||||||||||||||||||||||||||||||||||||||||||||||||||||||||||||||||||||||||||||||||||||||||||||||||||||||||||||||||||||||||||||||||||||||||||||||||||||||||||||||||||||||||||||||||||||||||||||||||||||||||||||||||||||||||||||||||||||||||||||||||||||||||||||||||||||||||||||||||||||||||||||||
|
Product |
Radeon HD 4850 |
Radeon HD 4870 |
Radeon HD 4890 |
|
VPU Clock (MHz) |
625 |
750 |
850 |
| Die Process |
55nm |
55nm |
55nm |
|
GPU Transistors |
956M |
956M |
959M |
|
Compute Power |
1.0 TFLOPs |
1.2 TFLOPs |
1.36 TFLOPs |
| Texture Units |
40 |
40 |
40 |
| Texture Fillrate |
25.0 GTexels/s |
30.0 GTexels/s |
34.0 GTexels/s |
|
Memory Size |
512 MB |
512/1024 MB |
1024 MB |
|
Memory Data Width |
256-bit |
256-bit |
256-bit |
|
Memory Type |
GDDR3 |
GDDR5 |
GDDR5 |
|
Memory Speed (MHz) |
993 (2.0 GBps) |
900 (3.6 Gbps) |
975 (3.9 Gbps) |
| ROPs |
16 |
16 |
16 |
| Pixel Fillrate |
10.0 GPixels/s |
12.0 GPixels/s |
13.6 GPixels/s |
|
Thermal Solution |
Single Slot Fan |
Dual Slot Fan |
Dual Slot Fan |
|
BUS Type |
PCI-E x 16, 2.0 |
PCI-E x 16, 2.0 |
PCI-E x 16, 2.0 |
|
DirectX 10 / Shader Model 4.1 |
Yes |
Yes |
Yes |
|
VGA Output |
Yes, by dongle |
Yes, by dongle |
Yes, by dongle |
|
DL-DVI-I |
x 2 |
x 2 |
x 2 |
|
HDMI |
Yes, by dongle |
Yes, by dongle |
Yes, by dongle |
|
H.264 / VC-1 Acceleration |
Yes |
Yes |
Yes |
|
7.1 Audio Support |
Yes |
Yes |
Yes |
|
HDCP Support |
Yes |
Yes |
Yes |
|
HDTV Out |
Yes |
Yes |
Yes |
|
Form Factor |
ATX |
ATX |
ATX |
HD4890 Toxic Closer Look
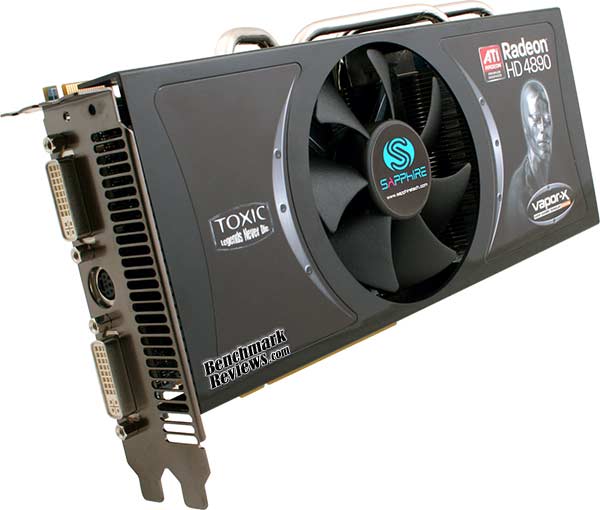
Of the many different product lines Sapphire offers, it's the Toxic design that draws the most attention. Combining best-in-class Vapor-X cooling with factory overclocked settings matched only by the Atomic water-cooled series, the Toxic brand is the most elite air-cooled video card Sapphire offers.
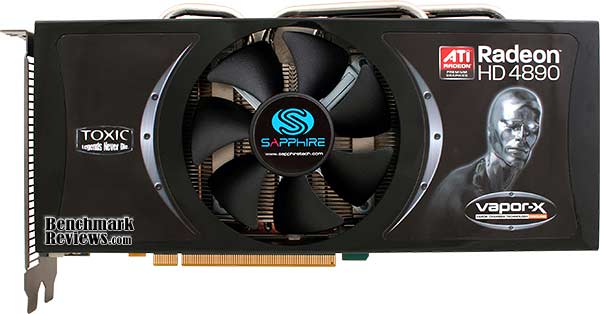
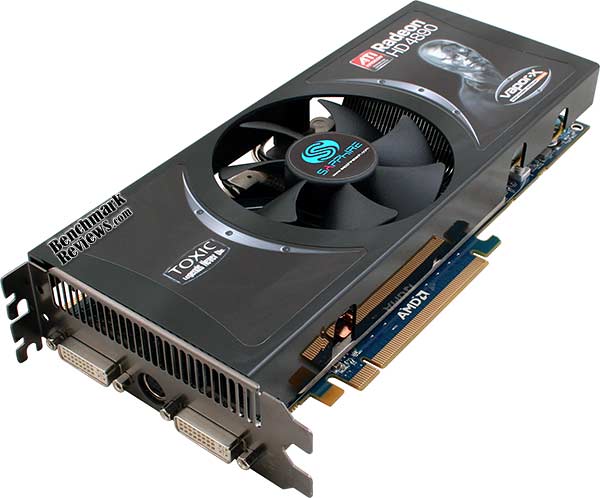
In many regards, the reference HD4890 looks extremely familiar. Sapphire helps differentiate their product by adding a unique cooling solution to an otherwise unchanged video card. The reinvented RV770 GPU found in the Radeon HD 4850/4870 video cards is now calling itself the RV790 and lives in the Radeon HD 4890. If you weren't given more details about the new Radeon 4890, the video card could be mistaken for a polished-up 4870. The Sapphire HD4890 Toxic Vapor-X looks different than the others, but is there really difference?
The Sapphire HD4890 Toxic Vapor-X cannot be denied its roots, because when you compare it against the Radeon HD 4870 the outward differences are negligible. ATI originally designed the Radeon HD 4870 with a balanced blend of value and performance, and the HD4890 rebuffs the performance while keeping an eye on value. The third generation 55nm RV790 chip uses the industry's most energy efficient manufacturing process and adds an additional three-million transistors, which allows ATI's latest and greatest single-chip graphics card to achieve top-level gaming performance while being more energy efficient at idle. Featuring the industries only major implementation of GDDR5 video frame buffer memory, the RV790 graphics processor is allowed to operate under stress without the worry of burning-up video RAM.
All Sapphire graphics cards in the HD 4000 series incorporate the latest ATI Avivo HD Technology for enhanced video display and feature a second generation built in UVD (Unified Video decoder) for the hardware accelerated decoding of Blu-ray and HD DVD content for both VC-1 and H.264 CODEC's, as well as *.mpeg files, considerably reducing CPU loading. The dedicated HDMI adaptor connects through the S-Video port and has 7.1 surround sound support and delivers audio and video output on a single cable for direct connection to an HDMI ready display. Unfortunately, there is no support for the up-and-coming DisplayPort interface on the Radeon HD 48xx series.
The ATI Radeon HD 4800 Series GPUs can all upscale video up to 2560x1600 resolution on capable dual-link monitors, which is almost twice the display resolution of 1080p HDTV displays. This bodes well for all Radeon HD 48xx owners wanting more from Blue-ray movies, but this isn't a centerpiece feature of the Radeon HD 4890 model 11150-01-40R we're reviewing for this article.
While I am a huge fan of externally-exhausting VGA coolers (such as the one used on reference-design Radeon HD 4890 video cards), I wasn't at all pleased with the exposed electronics that were inherent of the stock cooling package. On the other hand, I am also less enthusiastic about internally exhausting coolers which heat internal hardware, even if they do protect the components. This is the case with the Sapphire Toxic. While the components are free from danger, very little heated air exhausts outside the computer case. Without proper cooling fans or case ventilation, this could potentially affect overclocked hardware stability for the Toxic HD4890 and other components during warmer conditions.
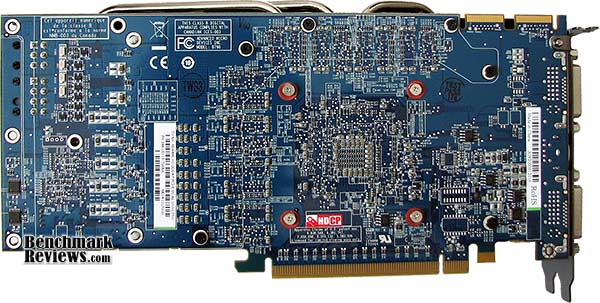
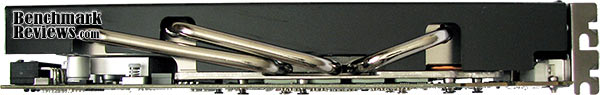
The enhanced cooling unit on the Sapphire Toxic Radeon HD 4890 video card is held tight to the RV790 55nm GPU with the use of a four-corner reinforcing bracket and nine screws. With a die size of 282 mm2, the RV790 GPU offers a greater contact footprint with the cooling unit, compared to the 256 mm2 footprint on the RV770 GPU. The double-height cooler does a very good job of cooling the 4890, but there is still a tremendous amount of heat that builds up on backside of the PCB. If you're an overclocker, there isn't much that can be done to help cool the unit from the reverse side of the circuit board, especially since there are no surface-mounted GDDR5 modules on this side of the video card.
The RV790 operates at 850 MHz by default, and ATI offers top-bin GPUs for factory-overclocked models. Sapphire was fortunate enough to procure 960MHz GPUs for their Toxic series of video cards, making this among the fastest video cards produced today. Ironically, the increase in heat output (which is directly relative) is cured by the Vapor-X cooling solution used on the Toxic. At idle, the Sapphire Radeon HD 4890 Toxic video card recorded a lukewarm 50°C, and under load that number raised to 80°C with an ambient room temperature of 20°C. These are the same temperatures we experienced with overclocked Radeon HD 4870's a few months back, so hopefully our HD4890 benchmark tests will reveal how much has really changed.
In our next section, Benchmark Reviews details our methodology for testing video cards. Following this we offer a cadre of benchmarks to show where the Sapphire Radeon HD 4890 Toxic stands against the top-end market of GeForce and Radeon graphics products... so please read on!
VGA Testing Methodology
At the start of all tests, the previous display adapter driver is uninstalled and trace components are removed using Driver Cleaner Pro. We then restart the computer system to establish our display settings and define the monitor. Once the hardware is prepared, we begin our testing. The synthetic benchmark tests in 3DMark06 will utilize shader models 2.0 and 3.0, while the video games will use their own proprietary game engine. For lower-end VGA products we test at 1024x768 (15-17" standard LCD), 1280x1024 (17-19" standard LCD), and 1680x1050 (22-24" widescreen LCD). In our higher-end VGA product tests we conduct add the 1920x1200 (24-28" widescreen LCD) resolution. In some tests we utilized widescreen monitor resolutions, since more users are beginning to feature these products for their own computing.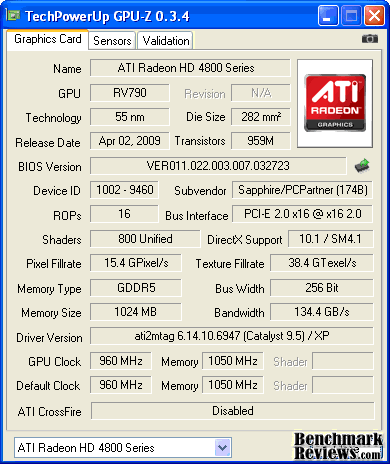
Each benchmark test program begins after a system restart, and the very first result for every test will be ignored since it often only caches the test. This process proved extremely important in the World in Conflict and Supreme Commander benchmarks, as the first run served to cache maps allowing subsequent tests to perform much better than the first. Each test is completed five times, with the average results displayed in our article.
Our site polls and statistics indicate that the vast majority of visitors use their PC for playing video games, and practically every one of you are using a screen resolutions mentioned above. Since all of the benchmarks we use for testing represent different game engine technology and graphic rendering processes, I feel that this battery of tests will provide a diverse range of results for you to gauge performance on your own computer system. Since most gamers and enthusiasts are still using Windows XP, it was decided that DirectX 9 would be used for all tests until Microsoft offers Windows 7 to replace the Vista.
Test System
-
Motherboard: Gigabyte GA-EX58-EXTREME (Intel X58/ICH10R Chipset) with F7c BIOS
-
Processor: Intel Core i7-920 Nehalem 2.66 GHz (BX80601920)
-
System Memory: OCZ 6GB 1600MHz CL7 DDR3 OCZ3P1600LV6GK
-
System Drive: OCZ Vertex 120GB SATA SSD OCZSSD2-1VTX120G
-
Monitor: SOYO 26-Inch Widescreen LCD Monitor DYLM26E6 (1920x1200)
-
Operating System: Windows XP Professional SP-3 (optimized to 16 processes at idle)
Benchmark Applications
-
3DMark06 v1.1.0 (8x Anti Aliasing & 16x Anisotropic Filtering)
-
Call of Duty 4: Modern Warfare v1.7.568 (4x AA/16x Trilinear AF using FRAPS)
-
Crysis v1.21 Benchmark (High Settings, 0x and 4x Anti-Aliasing)
-
Devil May Cry 4 Benchmark Demo (Ultra Quality, 8x MSAA)
-
Far Cry 2 v1.02 (Very High Performance, Ultra-High Quality, 8x AA)
-
World in Conflict v1.0.0.9 Performance Test (Very High Setting: 4x AA/4x AF)
Video Card Test Products
| Product Series | NVIDIA GeForce 8800 GT Reference Design | NVIDIA GeForce GTX 260216 Reference Design | Sapphire HD4890 Toxic 11150-01-40R | ASUS GeForce GTX 285 ENGTX285 TOP | Sapphire Radeon HD 4870 102-B50701-10-AT CrossFireX Set | NVIDIA GeForce GTX 295 Reference Design |
| Stream Processors | 112 | 216 | 800 | 240 | 640 x2 | 480 |
| Core Clock (MHz) | 600 | 576 | 960 | 670 | 750 x2 | 576 |
| Shader Clock (MHz) | 1457 | 1242 | N/A | 1550 | N/A | 1242 |
| Memory Clock (MHz) | 950 | 999 | 1050 | 1300 | 850 x2 | 999 |
| Memory Amount | 512 MB GDDR3 | 896 MB GDDR3 | 1024 MB GDDR5 | 1024 MB GDDR3 | 512MB (x2) GDDR5 | 1024MB (x2) GDDR3 |
| Memory Interface | 256-bit | 448-bit | 256-bit | 512-bit | 256-bit | 512-bit |
-
NVIDIA GeForce 8800 GT Reference Design (600 MHz GPU/1457 Shader/950 RAM - Forceware 182.08)
-
NVIDIA GeForce GTX 260216 Reference Design (576 MHz GPU/1242 MHz Shader/999 MHz RAM - Forceware 182.08)
-
Sapphire Radeon HD 4890 Toxic 11150-01-40R (960 MHz GPU/1050 MHz RAM - ATI Catalyst 9.5 v6.14.10.6947)
-
ASUS GeForce GTX 285 ENGTX285 TOP (670 MHz GPU/1550 MHz Shader/1330 MHz RAM - Forceware 182.08)
-
2x Sapphire Radeon HD 4870 102-B50701-10-AT in CrossFireX (750 MHz GPU/900 MHz RAM - ATI Catalyst 9.5 v6.14.10.6947)
-
NVIDIA GeForce GTX 295 Reference Design (576 MHz GPU x2/1242 Shader/999 MHz RAM - Forceware 182.08)
Now we're ready to begin testing video game performance these video cards, so please continue to the next page as we start with the 3DMark06 results.
3DMark06 Test Results
3DMark is a computer benchmark by Futuremark (formerly named Mad Onion) to determine the DirectX 9 performance of 3D game performance with graphics cards. 3DMark06 uses advanced real-time 3D game workloads to measure PC performance using a suite of DirectX 9 3D graphics tests, CPU tests, and 3D feature tests.
3DMark06 tests include all new HDR/SM3.0 graphics tests, SM2.0 graphics tests, AI and physics driven single and multiple cores or processor CPU tests and a collection of comprehensive feature tests to reliably measure next generation gaming performance today. Some enthusiasts may note that Benchmark Reviews does not include CPU-bound tests in our benchmark battery, and that only graphic-bound tests are included.
Here at Benchmark Reviews, we believe that synthetic benchmark tools are just as valuable as video games, but only so long as you're comparing apples to apples. Since the same test is applied in the same controlled method with each test run, I believe 3DMark is a very reliable tool for comparing graphic cards against one-another.
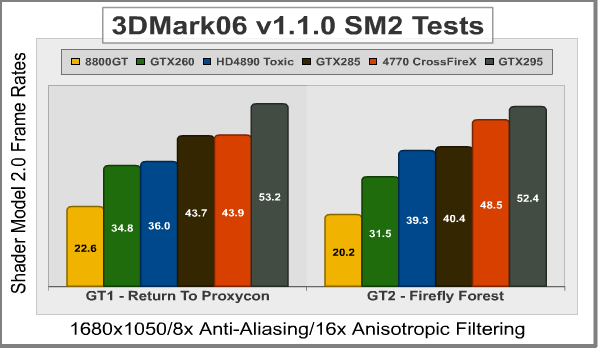
Shader Model 2.0
Our first series of synthetic tests are performed at 1680x1050, and demands only 1.764 megapixels from the graphics card. Beginning with Shader Model 2.0 tests, Return to Proxycon and Firefly Forest are two fast-paced fast-moving scenes that put strain on the GPU's efficiency by calling for large amounts of low-demand graphics in need of high-speed output. Shader Model 2.0 tests have historically performed at slower frame rates when compared to Shader Model 3.0; at least this is the case on newer, more complex, video cards with larger overhead.
Shader Model 3.0 / HDR
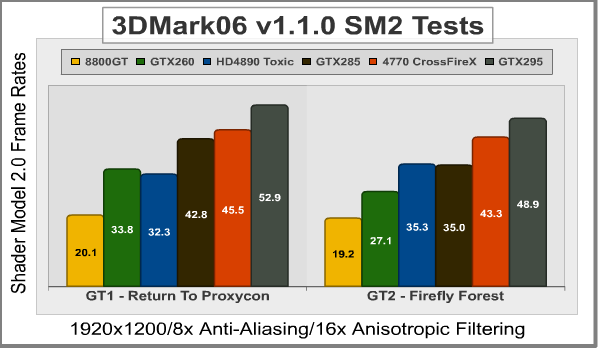
The Shader Model 3.0 and HDR (High Dynamic Range) test series in 3dMark06 includes the Canyon Flight and Deep Freeze. Both of these test scenes demand intense graphical computations from the GPU, and when paired with newer (AMD Phenom or Intel Nehalem) processors can actually produce better frame rates than Shader Model 2.0 scenes with the same hardware (and overhead). At 1920x1200 the graphics card is called-on to produce 2.3 megapixels, which is enough to separate the weak from the strong.
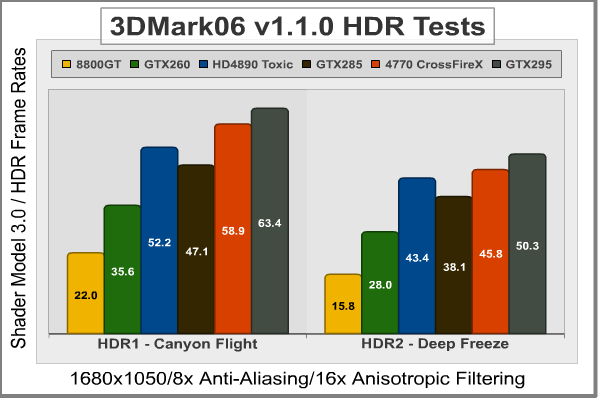
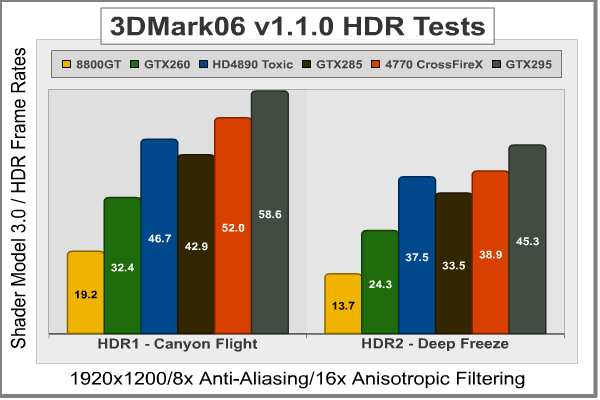
Usually our frame rate performance test results do well enough to speak for themselves, but allow me to add a bit of commentary if you will. The GeForce 8800 GT was included to add low-end perspective, and while it's an excellent video card for low-resolution 1024x768 gaming and still fine at 1280x1024, really falls beneath the 30 FPS range at 1650x1200 and drops down into the low teens at 1920x1200. The Radeon HD 4850 is the most affordable video card to handle 3DMark06 graphics within acceptable range, with the reference GeForce GTX 260 performing a few frames better at each scene. The overclocked ASUS GeForce GTX 285 managed only 33.5 FPS at 1920x1200 resolution, which was easily outdone by Radeon counterparts. Sapphire's Toxic HD4890 scored an impressive 37.5 FPS, while the CrossFireX pair of reference 4770's pushed 38.9 FPS. The GeForce GTX 295 offered 45.3 FPS to illustrate the high-end comparison.
| Product Series | NVIDIA GeForce 8800 GT Reference Design | NVIDIA GeForce GTX 260216 Reference Design | Sapphire HD4890 Toxic 11150-01-40R | ASUS GeForce GTX 285 ENGTX285 TOP | Sapphire Radeon HD 4870 102-B50701-10-AT CrossFireX Set | NVIDIA GeForce GTX 295 Reference Design |
| Stream Processors | 112 | 216 | 800 | 240 | 640 x2 | 480 |
| Core Clock (MHz) | 600 | 576 | 960 | 670 | 750 x2 | 576 |
| Shader Clock (MHz) | 1457 | 1242 | N/A | 1550 | N/A | 1242 |
| Memory Clock (MHz) | 950 | 999 | 1050 | 1300 | 850 x2 | 999 |
| Memory Amount | 512 MB GDDR3 | 896 MB GDDR3 | 1024 MB GDDR5 | 1024 MB GDDR3 | 512MB (x2) GDDR5 | 1024MB (x2) GDDR3 |
| Memory Interface | 256-bit | 448-bit | 256-bit | 512-bit | 256-bit | 512-bit |
Take the 3DMark06 tests at face value (as you should any synthetic benchmark), because in our next section we begin real-world testing on a cadre of popular video games known for taxing the graphics processor, and the performance curve is expected change. Our first up is Call of Duty 4, so please continue on...
Call of Duty 4 Benchmarks
Call of Duty 4: Modern Warfare runs on a proprietary game engine that Infinity Ward based off of the tried-and-true Q3 structure. This engine offers features such as true world-dynamic lighting, HDR lighting effects, dynamic shadows and depth of field. "Bullet Penetration" is calculated by the Infinity Ward COD4 game engine, taking into account things such as surface type and entity thickness. Certain objects, such as cars, and some buildings are destructible. This makes distinguishing cover from concealment important, as the meager protection provided by things such as wooden fences and thin walls does not fully shield players from harm as it does in many other games released during the same time period. Bullet speed and stopping power are decreased after penetrating an object, and this decrease is calculated realistically depending on the thickness and surface of the object penetrated.
This version of the game also makes use of a dynamic physics engine, a feature which was not implemented in previous Call of Duty titles for Windows PC's. The new in-game death animations are a combination of pre-set static animations combined with ragdoll physics. Infinity Ward's use of the well-debugged Quake 3 engine along with new dynamic physics implementation allows Call of Duty 4 to be playable by a wide range of computer hardware systems. The performance may be scaled for low-end graphic cards up to 4x Anti-Aliasing and 16x Tri-linear anisotropic texture filtering.
Before I discuss the results, I would like to take a moment to mention my general opinion on Fraps software when it comes to game performance benchmarking. If you're not familiar with the software, Fraps (derived from Frames per second) is a benchmarking, screen capture, and real-time video capture utility for DirectX and OpenGL applications. Some reviewers use this software to measure video game performance on their Windows system, as well as record gaming footage. My opinion is that it offers a valid third-party non-bias alternative to in-game benchmarking tools; but there is one caveat: it's not perfect. Because the user must manually begin the test, the starting point may vary from position to position and therefore skew the results.
In my testing with Fraps v2.9.8 build 7777, I used the cut-scene intro to the coup d'etat scene when Al Asad takes over control. First I allowed the level to load and let the scene begin for a few moments, then I would use the escape key to bring up the menu and choose the restart level option, I would immediately press F11 to begin recording the benchmark data. This scene is nearly four minutes long, but I configured Fraps to record the first 180 seconds of it to remain consistent. Once the scene would end, I would repeat the restart process for a total of five tests. So within a 2 millisecond starting point margin, all benchmark results are comparable which is probably as accurate as it can possibly get with this tool.
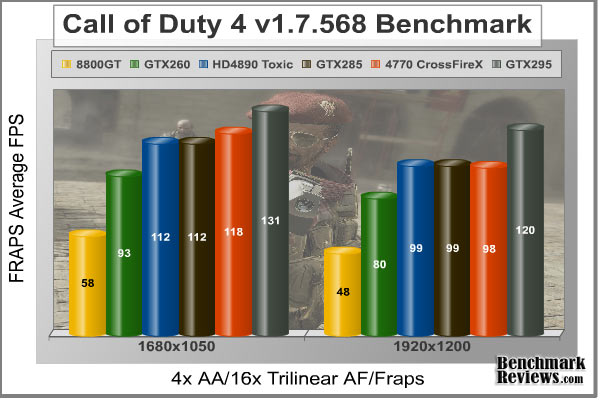
In our frame rate results, all five of the collected test scores were within 0.5 FPS of one-another and then averaged for the chart you see above. Because the products we are testing compete for the high-end segment of discrete graphics, the frame rates in Call of Duty 4 all share similar results with only small degrees of difference between 1680x1050 and 1920x1200 resolutions.
The low-end GeForce 8800 GT plays Call of Duty 4 with moderately acceptable frame rates, scoring 48 FPS at 1920x1200 and making up the bottom end of our charted results. The Radeon HD 4850 (not illustrated) rendered 68 FPS, followed by the reference GTX 260216 with 80 FPS. Moving up to the Radeon HD 4870 (not illustrated) yields 85 frames per second at 1920x1200, and is out-performed by the Sapphire Radeon HD 4890 Toxic with 99 FPS. Even the GeForce GTX 285, with all of its new muscle, can only outpace the others by a small margin with 99 FPS rendered. For a relatively low price tag, two HD4770's paired into a CrossFireX set pushed nearly the same frame rate, and the expensive ultra-high end GeForce GTX 295 scored 120 FPS.
Essentially, almost all of the graphics products tested produced frame rates between 80-99 FPS at 1920x1200. The Atomic 4870 X2 (not illustrated) on the other hand, burned through 130 FPS without breaking a sweat (it's water-cooled, after all). Because of the shear muscle the Sapphire Atomic packs, the video cards we've tested on CoD4 fall into one of two categories: those that aren't the Radeon 4870 X2 Atomic, and those that are. The Radeon HD 4890 Toxic and GTX 285 did extremely well for being the best single-GPU products available, but the difference between a single RV790 GPU and dual RV740's from the CrossFireX set is barely noticeable.
| Product Series | NVIDIA GeForce 8800 GT Reference Design | NVIDIA GeForce GTX 260216 Reference Design | Sapphire HD4890 Toxic 11150-01-40R | ASUS GeForce GTX 285 ENGTX285 TOP | Sapphire Radeon HD 4870 102-B50701-10-AT CrossFireX Set | NVIDIA GeForce GTX 295 Reference Design |
| Stream Processors | 112 | 216 | 800 | 240 | 640 x2 | 480 |
| Core Clock (MHz) | 600 | 576 | 960 | 670 | 750 x2 | 576 |
| Shader Clock (MHz) | 1457 | 1242 | N/A | 1550 | N/A | 1242 |
| Memory Clock (MHz) | 950 | 999 | 1050 | 1300 | 850 x2 | 999 |
| Memory Amount | 512 MB GDDR3 | 896 MB GDDR3 | 1024 MB GDDR5 | 1024 MB GDDR3 | 512MB (x2) GDDR5 | 1024MB (x2) GDDR3 |
| Memory Interface | 256-bit | 448-bit | 256-bit | 512-bit | 256-bit | 512-bit |
In our next section, we shall see if the performance-demanding video game Crysis will help strengthen this position among our collection of video cards.
Crysis Benchmark Results
Crysis uses a new graphics engine: the CryENGINE2, which is the successor to Far Cry's CryENGINE. CryENGINE2 is among the first engines to use the Direct3D 10 (DirectX10) framework of Windows Vista, but can also run using DirectX9, both on Vista and Windows XP.
Roy Taylor, Vice President of Content Relations at NVIDIA, has spoken on the subject of the engine's complexity, stating that Crysis has over a million lines of code, 1GB of texture data, and 85,000 shaders. To get the most out of modern multicore processor architectures, CPU intensive subsystems of CryENGINE 2 such as physics, networking and sound, have been re-written to support multi-threading.
Crysis offers an in-game benchmark tool, which is similar to World in Conflict. This short test does place some high amounts of stress on a graphics card, since there are so many landscape features rendered. For benchmarking purposes, Crysis can mean trouble as it places a high demand on both GPU and CPU resources. Benchmark Reviews uses the Crysis Benchmark Tool by Mad Boris to test frame rates in batches, which allows the results of many tests to be averaged.
The very first thing we discovered during our 1680x1050 resolution tests was how well NVIDIA products performed compared to the Radeon product line. Test results like these begin to raise the question of how unbiased games like Crysis are when they proudly proclaim "NVIDIA: The way it was meant to be played". I don't consider this to be coincidence, but at the same time it's probably also not coincidence that Crysis demands more GPU power than any other product, which was perfect for a time when AMD/ATI couldn't build a decent VGA product to save their lives (literally).
Analyzing the chart below illustrates a few distinct trends. The first is that the GeForce GTX 260 and Radeon HD 4870 (not illustrated) are virtually identical in terms of Crysis gaming performance. The second trend shows the Sapphire Radeon HD 4890 Toxic going head-to-head with the overclocked GeForce GTX 285. What was most surprising is how the CrossFireX set of HD4770's didn't perform as well as we've seen in other tests, indicating that when a game demands processing power the GPU either has it or it doesn't. That point is driven home with the dual-GPU GeForce GTX 295.
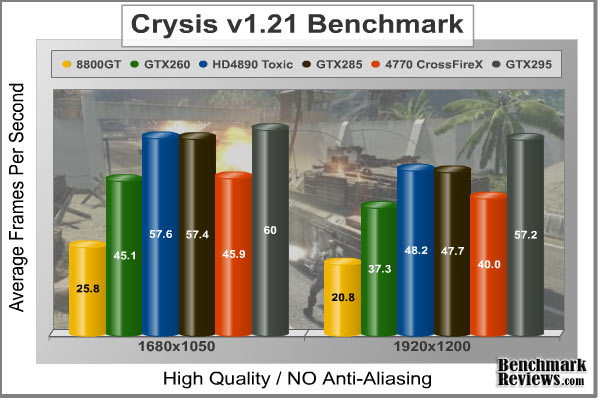
With only a small dose of anti-aliasing added to Crysis, there are very few products that would make for playable frame rates. Our Island time-demo mixes a some beach and water views, so it's going to be on the high side of frame rates when compared to actual game play. The results shown in the chart below illustrate (more distinctly) how well NVIDIA products scale with anti-aliasing enabled.
It would be easy to accuse NVIDIA of some level of driver code favoring, but there is one glaring piece of evidence in their defense: AMD/ATI graphic cards clearly stop post processing support at 8x AA, while modern GeForce products reach 16x Q AA before calling it quits. So with this being an undisputed fact among our test products, it makes sense to see that the GTX 285 now outperform the Sapphire Radeon HD 4890 Toxic by a few frame (which is opposite of the non-AA tests). The CrossFireX set of HD4770's offered less frame rate performance than a single 8800 GT, which is bit suspicious, while the NVIDIA GeForce GTX 295 roars ahead of the others to define the high-end.
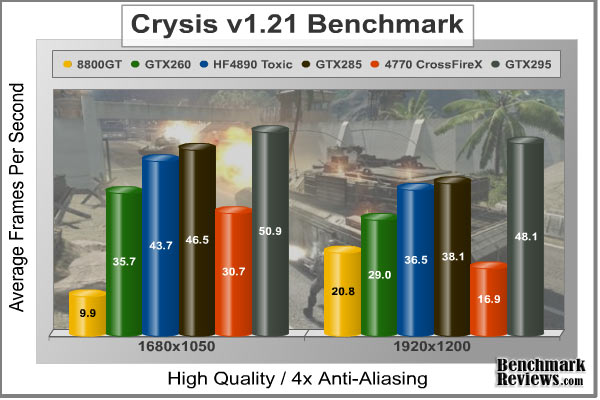
At the end of our Crysis testing, it was apparent that heavy post-processing effects are still an obstacle that Radeon HD video cards have yet to clear. NVIDIA probably isn't surprised to see the GTX 285 and GeForce GTX 295 make the top of our charts for performance with 4x AA enabled. It's worth noting that most products used in this review have been used in past articles and tested at-length on our X48 benchmark system, with the results being comparable all throughout to these X58 results.
| Product Series | NVIDIA GeForce 8800 GT Reference Design | NVIDIA GeForce GTX 260216 Reference Design | Sapphire HD4890 Toxic 11150-01-40R | ASUS GeForce GTX 285 ENGTX285 TOP | Sapphire Radeon HD 4870 102-B50701-10-AT CrossFireX Set | NVIDIA GeForce GTX 295 Reference Design |
| Stream Processors | 112 | 216 | 800 | 240 | 640 x2 | 480 |
| Core Clock (MHz) | 600 | 576 | 960 | 670 | 750 x2 | 576 |
| Shader Clock (MHz) | 1457 | 1242 | N/A | 1550 | N/A | 1242 |
| Memory Clock (MHz) | 950 | 999 | 1050 | 1300 | 850 x2 | 999 |
| Memory Amount | 512 MB GDDR3 | 896 MB GDDR3 | 1024 MB GDDR5 | 1024 MB GDDR3 | 512MB (x2) GDDR5 | 1024MB (x2) GDDR3 |
| Memory Interface | 256-bit | 448-bit | 256-bit | 512-bit | 256-bit | 512-bit |
In our next section, Benchmark Reviews tests with Devil May Cry 4 Benchmark. Read on to see how a blended high-demand GPU test with low video frame buffer demand will impact our test products.
Devil May Cry 4 Benchmark
Devil May Cry 4 was released on PC in early 2007 as the fourth installment to the Devil May Cry video game series. DMC4 is a direct port from the PC platform to console versions, which operate at the native 720P game resolution with no other platform restrictions. Devil May Cry 4 uses the refined MT Framework game engine, which has been used for many popular Capcom game titles over the past several years.
MT Framework is an exclusive seventh generation game engine built to be used with games developed for the PlayStation 3 and Xbox 360, and PC ports. MT stands for "Multi-Thread", "Meta Tools" and "Multi-Target". Originally meant to be an outside engine, but none matched their specific requirements in performance and flexibility. Games using the MT Framework are originally developed on the PC and then ported to the other two console platforms.
On the PC version a special bonus called Turbo Mode is featured, giving the game a slightly faster speed, and a new difficulty called Legendary Dark Knight Mode is implemented. The PC version also has both DirectX 9 and DirectX 10 mode for Microsoft Windows XP and Vista Operating Systems.
It's always nice to be able to compare the results we receive here at Benchmark Reviews with the results you test for on your own computer system. Usually this isn't possible, since settings and configurations make it nearly difficult to match one system to the next; plus you have to own the game or benchmark tool we used.
Devil May Cry 4 fixes this, and offers a free benchmark tool available for download. Because the DMC4 MT Framework game engine is rather low-demand for today's cutting edge multi-GPU video cards, Benchmark Reviews uses the 1920x1200 resolution to test with 8x AA (highest AA setting available to Radeon HD video cards) and 16x AF. The benchmark runs through four test scenes, but scene #2 and #4 are the ones that usually offer a challenge. Displayed below is our result for the test.
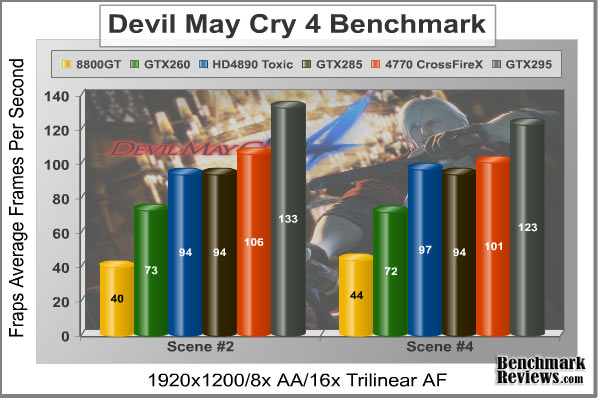
Judging from the results charted above, it appears that the Capcom MT Framework game engine isn't particular about which brand of video card you use for gaming. Although the 8800 GT offered only 40/44 FPS in the 1920X1200 tests, the frame rate was still above the 30 FPS range. Please keep in mind that the reference GeForce 8800 GT and GTX 295 are included to add contrast between the low-end and high-end of graphic cards.
In these two test scenes, there was a close battle for high-end graphics. While the GeForce 8800 GT can still play DMC4, it does so around the 40 FPS range. The Radeon HD 4850 kicks this up to around 60 FPS, while the other take off from there. The reference-design GeForce GTX 260 produced 72 FPS on average, and the Radeon HD 4870 narrowly out-paces it with 83 FPS. The factory-overclocked HD4890 Toxic scored 94/97, while the GeForce GTX 285 offered 94/94, but both fell slightly behind two reference Radeon HD 4770's in CrossFireX scoring 106/101 FPS.
DMC4 was intended to replace our UT3 test, which commonly offered results as high as 180 FPS, but the search for high-demand graphics tests is getting tough as the newest games seem to be happy with old hardware. Feel free to write us with your suggestions.
| Product Series | NVIDIA GeForce 8800 GT Reference Design | NVIDIA GeForce GTX 260216 Reference Design | Sapphire HD4890 Toxic 11150-01-40R | ASUS GeForce GTX 285 ENGTX285 TOP | Sapphire Radeon HD 4870 102-B50701-10-AT CrossFireX Set | NVIDIA GeForce GTX 295 Reference Design |
| Stream Processors | 112 | 216 | 800 | 240 | 640 x2 | 480 |
| Core Clock (MHz) | 600 | 576 | 960 | 670 | 750 x2 | 576 |
| Shader Clock (MHz) | 1457 | 1242 | N/A | 1550 | N/A | 1242 |
| Memory Clock (MHz) | 950 | 999 | 1050 | 1300 | 850 x2 | 999 |
| Memory Amount | 512 MB GDDR3 | 896 MB GDDR3 | 1024 MB GDDR5 | 1024 MB GDDR3 | 512MB (x2) GDDR5 | 1024MB (x2) GDDR3 |
| Memory Interface | 256-bit | 448-bit | 256-bit | 512-bit | 256-bit | 512-bit |
Our next benchmark of the gaming series is coming next, which puts our collection of video cards against some very demanding graphics with Far Cry 2.
Far Cry 2 Benchmark
Ubisoft has developed Far Cry 2 as a sequel to the original, but with a very different approach to game play and story line. Far Cry 2 features a vast world built on Ubisoft's new game engine called Dunia, meaning "world", "earth" or "living" in Farci. The setting in Far Cry 2 takes place on a fictional Central African landscape, set to a modern day timeline.
The Dunia engine was built specifically for Far Cry 2, by Ubisoft Montreal development team. It delivers realistic semi-destructible environments, special effects such as dynamic fire propagation and storms, real-time night-and-day sun light and moon light cycles, dynamic music system, and non-scripted enemy A.I actions.
The Dunia game engine takes advantage of multi-core processors as well as multiple processors and supports DirectX 9 as well as DirectX 10. Only 2 or 3 percent of the original CryEngine code is re-used, according to Michiel Verheijdt, Senior Product Manager for Ubisoft Netherlands. Additionally, the engine is less hardware-demanding than CryEngine 2, the engine used in Crysis.
However, it should be noted that Crysis delivers greater character and object texture detail, as well as more destructible elements within the environment. For example; trees breaking into many smaller pieces and buildings breaking down to their component panels. Far Cry 2 also supports the amBX technology from Philips. With the proper hardware, this adds effects like vibrations, ambient colored lights, and fans that generate wind effects.
There is a benchmark tool in the PC version of Far Cry 2, which offers an excellent array of settings for performance testing. Benchmark Reviews used the maximum settings allowed for our tests, with the resolution set to 1920x1200. The performance settings were all set to 'Very High', DirectX 9 Render Quality was set to 'Ultra High' overall quality, 8x anti-aliasing was applied, and HDR and Bloom were enabled.
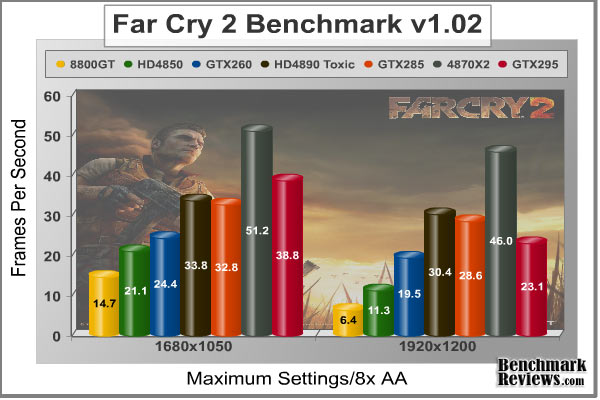
Although the Dunia engine in Far Cry 2 is slightly less demanding than CryEngine 2 engine in Crysis, the strain appears to be extremely close. In Crysis we didn't dare to test AA above 4x, whereas we used 8x AA and 'Ultra High' settings in Far Cry 2. The end effect was a separation between what is capable of maximum settings, and what is not. Using the short 'Ranch Small' time demo (which yields the lowest FPS of the three tests available), we noticed that there are very few products capable of producing playable frame rates with the settings all turned up.
In this test, Benchmark Reviews included the HD4850 and Sapphire Radeon HD 4870 X2 Atomic ST-6026 to further show the versatility of product performance. Even at 1680x1050 resolution, the GeForce 8800 GT, Radeon HD 4850, and GTX 260 all seem incapable of producing the required 30 FPS minimum performance to keep motion fluid and lifelike. At 1680x1050 the Sapphire Radeon HD 4890 Toxic performs at 33.8 FPS while the factory-overclocked GeForce GTX 285 scores 32.8, with the Far Cry 2 benchmark configured for 8x AA. The more-demanding 1920x1200 resolution pegs the HD4890 Toxic a few frame ahead of the GeForce GTX 285. The dual-GPU GeForce GTX 295 did well-enough at 1680x1050, but the Radeon HD 4770X2 was the real performer in this test with 46 FPS at 1920x1280 (and the GTX 295 did miserably for some unexplained reason). When there's a strain on the graphics, like Benchmark Reviews has created with these Far Cry 2 tests, the RV790 and GT200 GPU (in the GTX 285) appear to be the ideal graphics solution.
| Product Series | NVIDIA GeForce 8800 GT Reference Design | Sapphire Radeon HD 4850 102-B50102-00-AT | NVIDIA GeForce GTX 260216 Reference Design | Sapphire HD4890 Toxic 11150-01-40R | ASUS GeForce GTX 285 ENGTX285 TOP | Sapphire Radeon HD 4870 X2 Atomic ST-6026 | NVIDIA GeForce GTX 295 Reference Design |
| Stream Processors | 112 | 800 | 216 | 800 | 240 | 1600 | 480 |
| Core Clock (MHz) | 600 | 625 | 576 | 960 | 670 | 800 | 576 |
| Shader Clock (MHz) | 1457 | N/A | 1242 | N/A | 1550 | N/A | 1242 |
| Memory Clock (MHz) | 950 | 993 | 999 | 1050 | 1300 | 1000 | 999 |
| Memory Amount | 512 MB GDDR3 | 512 MB GDDR3 | 896 MB GDDR3 |
1024 MB GDDR5 |
1024 MB GDDR3 | 1024MB (x2) GDDR5 | 1024MB (x2) GDDR3 |
| Memory Interface | 256-bit | 256-bit | 448-bit | 256-bit | 512-bit | 256-bit | 512-bit |
Our last benchmark of the series is coming next, which puts our collection of video cards against some very demanding graphics with World in Conflict.
World in Conflict Results
The latest version of Massive's proprietary Masstech engine utilizes DX10 technology and features advanced lighting and physics effects, and allows for a full 360 degree range of camera control. Massive's MassTech engine scales down to accommodate a wide range of PC specifications, if you've played a modern PC game within the last two years, you'll be able to play World in Conflict.
World in Conflict's FPS-like control scheme and 360-degree camera make its action-strategy game play accessible to strategy fans and fans of other genres... if you love strategy, you'll love World in Conflict. If you've never played strategy, World in Conflict is the strategy game to try.
World in Conflict offers an in-game benchmark; which records the minimum, average, and maximum frame rates during the test. Very recently another hardware review website made the assertion that these tests are worthless, but we couldn't disagree more. When used to compare video cards which are dependant on the same driver and use the same GPU architecture, the in-game benchmark works very well and comparisons are apples-to-apples.
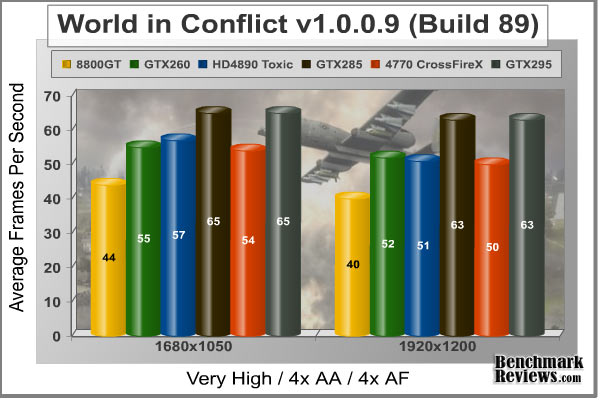
World in Conflict plays well on most modern graphics cards, as evidenced by the close proximity of frame rate performance between everything from the GeForce 8800 GT to the GTX 285 (which matched the GTX 295). With a balanced demand for CPU and GPU power, World in Conflict just begins to place demands on the graphics processor at the 1920x1280 resolution. I was expecting more results along the same line I've seen so far, and that is pretty much exactly what I got, only in much smaller differences. There were a few interesting turn-arounds though.
The GeForce 8800 GT performed better than the Radeon HD 4850 (not illustrated), and produced 40 FPS at 1920x1200 resolution in WiC. Rather odd, I will admit, but WiC isn't particular to GPU; although it does feature NVIDIA's TWIMTBP slogan. The GTX 260 series has gone neck-and-neck with the HD 4850 for most of our tests, but now it seems to be beating out the Sapphire Radeon HD 4890 Toxic by some miracle of a chance. Even stranger is how the Radeon HD 4890 Toxic matched the Atomic 4870 X2 (not illustrated) and CrossFireX HD4770's. The factory-overclocked ASUS ENGTX285 TOP GeForce GTX 285 tops our chart with an average 63 FPS performance at 1920x1200, which matches the dual-GT200 GeForce GTX 295. This is another game that proves that what you plan on playing might determine what you plan on buying, since some games prefer one manufacturer or GPU over another.
| Product Series | NVIDIA GeForce 8800 GT Reference Design | NVIDIA GeForce GTX 260216 Reference Design | Radeon HD 4890 GDDR5 Video Card | ASUS GeForce GTX 285 ENGTX285 TOP | Sapphire Radeon HD 4870 102-B50701-10-AT CrossFireX Set | NVIDIA GeForce GTX 295 Reference Design |
| Stream Processors | 112 | 216 | 800 | 240 | 640 x2 | 480 |
| Core Clock (MHz) | 600 | 576 | 850 | 670 | 750 x2 | 576 |
| Shader Clock (MHz) | 1457 | 1242 | N/A | 1550 | N/A | 1242 |
| Memory Clock (MHz) | 950 | 999 | 975 | 1300 | 850 x2 | 999 |
| Memory Amount | 512 MB GDDR3 | 896 MB GDDR3 | 896 MB GDDR3 | 1024 MB GDDR3 | 512MB (x2) GDDR5 | 1024MB (x2) GDDR3 |
| Memory Interface | 256-bit | 448-bit | 256-bit | 512-bit | 256-bit | 512-bit |
In our next section, we discuss electrical power consumption and learn how well (or poorly) each video card will impact your utility bill...
Radeon HD 4890 Temperatures
This section is probably the most popular for me, not so much as a reviewer but more for my enthusiast side. Benchmark tests are always nice, so long as you care about comparing one product to another. But when you're an overclocker, or merely a hardware enthusiast who likes to tweak things on occasion, there's no substitute for good information.
Benchmark Reviews has a very popular guide written on Overclocking the NVIDIA GeForce Video Card, which gives detailed instruction on how to tweak a GeForce graphics card for better performance. Of course, not every video card has the head room. Some products run so hot that they can't suffer any higher temperatures than they already do. This is why we measure the operating temperature of the video card products we test.
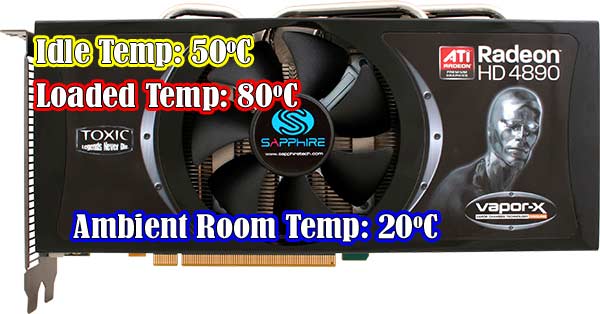
To begin my testing, I use GPU-Z to measure the temperature at idle as reported by the GPU. Next I use FurMark 1.6.0 to generate maximum thermal load and record GPU temperatures at high-power 3D mode. The ambient room temperature remained at a stable 20.0°C throughout testing, while the inner-case temperature hovered around 36°C. The Sapphire HD4890 Toxic Vapor-X video card recorded 50°C in idle 2D mode, and increased to 80°C in full 3D mode. These temperatures were comparably lower than the reference-design HD4890, despite the huge overclocks on the Toxic edition.
FurMark is an OpenGL benchmark that heavily stresses and overheats the graphics card with fur rendering. The benchmark offers several options allowing the user to tweak the rendering: fullscreen / windowed mode, MSAA selection, window size, duration. The benchmark also includes a GPU Burner mode (stability test). FurMark requires an OpenGL 2.0 compliant graphics card with lot of GPU power! As a oZone3D.net partner, Benchmark Reviews offers a free download of FurMark to our visitors.
FurMark does do two things extremely well: drive the thermal output of any graphics processor higher than any other application of video game, and it does so with consistency every time. While I have proved that Furmark is not a true benchmark tool for comparing video cards, it would still work very well to compare one product against itself at different stages. FurMark would be very useful for comparing the same GPU against itself using different drivers or clock speeds, of testing the stability of a GPU as it raises the temperatures higher than any program. But in the end, it's a rather limited tool.
Considering the results, I will admit that 80°C is not the kind of temperature expected from the RV790 GPU. Even with a slightly-larger contact footprint from the new 959-million transistor GPU matched to a double-height cooler, the temperatures at idle and load are very close to the overclocked Sapphire HD 4870 Toxic under full load. For gamers who like to keep it cool, the surprisingly silent fan under load can be dialed up using free tools such as RivaTuner. Benchmark Reviews tested this unit in stock condition, without modifications to the BIOS or driver settings.
The most favored feature of past top-tier GeForce-series designs has been NVIDIA's focused-exhaust design. Heated air recirculating around inside the computer case is could reduce stability for your sensitively overclocked computer system. While 80°C is considerably warm under maximum load, it's almost twenty degrees cooler than a reference-design Radeon HD 4870. This is what sets the RV790 apart from the RV770: three-million more transistors to improve chip stability, efficiency, and yield lower idle temperatures. In the end, this makes the ATI Radeon HD 4890 a more flexible graphics solution for multiple SKUs among card partners.
VGA Power Consumption
Life is not as affordable as it used to be, and items such as gasoline, natural gas, and electricity all top the list of resources which have exploded in price over the past few years. Add to this the limit of non-renewable resources compared to current demands, and you can see that the prices are only going to get worse. Planet Earth is needs our help, and needs it badly. With forests becoming barren of vegetation and snow capped poles quickly turning brown, the technology industry has a new attitude towards suddenly becoming "green". I'll spare you the powerful marketing hype that I get from various manufacturers every day, and get right to the point: your computer hasn't been doing much to help save energy... at least up until now.

To measure isolated video card power consumption, Benchmark Reviews uses the Kill-A-Watt EZ (model P4460) power meter made by P3 International. A baseline test is taken without a video card installed inside our computer system, which is allowed to boot into Windows and rest idle at the login screen before power consumption is recorded. Once the baseline reading has been taken, the graphics card is installed and the system is again booted into Windows and left idle at the login screen. Our final loaded power consumption reading is taken with the video card running a stress test using FurMark. Below is a chart with the isolated video card power consumption (not system total) displayed in Watts for each specified test product:
VGA Product Description(sorted by combined total power) |
Idle Power |
Loaded Power |
|---|---|---|
NVIDIA GeForce GTX 480 SLI Set |
82 W |
655 W |
NVIDIA GeForce GTX 590 Reference Design |
53 W |
396 W |
ATI Radeon HD 4870 X2 Reference Design |
100 W |
320 W |
AMD Radeon HD 6990 Reference Design |
46 W |
350 W |
NVIDIA GeForce GTX 295 Reference Design |
74 W |
302 W |
ASUS GeForce GTX 480 Reference Design |
39 W |
315 W |
ATI Radeon HD 5970 Reference Design |
48 W |
299 W |
NVIDIA GeForce GTX 690 Reference Design |
25 W |
321 W |
ATI Radeon HD 4850 CrossFireX Set |
123 W |
210 W |
ATI Radeon HD 4890 Reference Design |
65 W |
268 W |
AMD Radeon HD 7970 Reference Design |
21 W |
311 W |
NVIDIA GeForce GTX 470 Reference Design |
42 W |
278 W |
NVIDIA GeForce GTX 580 Reference Design |
31 W |
246 W |
NVIDIA GeForce GTX 570 Reference Design |
31 W |
241 W |
ATI Radeon HD 5870 Reference Design |
25 W |
240 W |
ATI Radeon HD 6970 Reference Design |
24 W |
233 W |
NVIDIA GeForce GTX 465 Reference Design |
36 W |
219 W |
NVIDIA GeForce GTX 680 Reference Design |
14 W |
243 W |
Sapphire Radeon HD 4850 X2 11139-00-40R |
73 W |
180 W |
NVIDIA GeForce 9800 GX2 Reference Design |
85 W |
186 W |
NVIDIA GeForce GTX 780 Reference Design |
10 W |
275 W |
NVIDIA GeForce GTX 770 Reference Design |
9 W |
256 W |
NVIDIA GeForce GTX 280 Reference Design |
35 W |
225 W |
NVIDIA GeForce GTX 260 (216) Reference Design |
42 W |
203 W |
ATI Radeon HD 4870 Reference Design |
58 W |
166 W |
NVIDIA GeForce GTX 560 Ti Reference Design |
17 W |
199 W |
NVIDIA GeForce GTX 460 Reference Design |
18 W |
167 W |
AMD Radeon HD 6870 Reference Design |
20 W |
162 W |
NVIDIA GeForce GTX 670 Reference Design |
14 W |
167 W |
ATI Radeon HD 5850 Reference Design |
24 W |
157 W |
NVIDIA GeForce GTX 650 Ti BOOST Reference Design |
8 W |
164 W |
AMD Radeon HD 6850 Reference Design |
20 W |
139 W |
NVIDIA GeForce 8800 GT Reference Design |
31 W |
133 W |
ATI Radeon HD 4770 RV740 GDDR5 Reference Design |
37 W |
120 W |
ATI Radeon HD 5770 Reference Design |
16 W |
122 W |
NVIDIA GeForce GTS 450 Reference Design |
22 W |
115 W |
NVIDIA GeForce GTX 650 Ti Reference Design |
12 W |
112 W |
ATI Radeon HD 4670 Reference Design |
9 W |
70 W |
At 65W of power consumption at idle, our reading on the Sapphire Toxic 4890 is above ATI's stated 60W idle power, which is presumably because of the high overclock. Still, energy demand is on par with the dual-GPU NVIDIA GeForce GTX 295 and Sapphire Radeon HD 4850 X2. Full output power consumption doesn't make the Radeon HD 4890 Toxic look very much better. Under full load, the Sapphire Radeon HD 4890 Toxic video card consumed a massive 318W of electricity. This is a whole lot more than the factory-overclocked GeForce GTX 280 and 285, and about the same as a reference NVIDIA GeForce GTX 295. ATI claims a maximum board power of 190W, and our results are well above that figure. Unlike the reference Radeon HD 4890 (pictured above) which requires only two six-pin PCI-Express power connections, the Sapphire Toxic requires one six-pin and one eight-pin power connection.
Radeon 4000 Final Thoughts
ATI has a collection of powerful products packed into the Radeon HD 4000 series. Benchmark Reviews has already confirmed that the Radeon HD 4670 captures the low-end segment for entry-level gamers and HTPC builders looking for a graphics accelerator priced below $80. But the RV730 XT graphics processor can only be stretched so far, and 514-million transistors cannot display the aggressive frame rates most gamers want. For those wanting a little more power for a slightly higher price, the 40nm RV740 is an excellent choice. ATI's Radeon HD 4770 offers 512MB of GDDR5 video frame buffer memory, albeit on a narrow 128-bit bus, and 826-million transistors help improve the frame rate to a more competitive level on demanding video games.
But the Radeon HD 4800 series of products is where the power is. To begin with, 800 cores is nothing to scoff at; even if they aren't nearly as efficient as they sound. CrossFireX scales performance very well, and for the first time actually makes multi-card setups worth the money. The most likable part is pricing: As of April 2009 the Radeon HD 4850 currently sells for $99 after rebate, which forces NVIDIA to drop the price of their GeForce GTS 250 (re-labeled 9800 GTX+) to meet with the competition. When ATI launched the Radeon HD 4870 at $300, NVIDIA had to answer back by dropping the GTX 260 to a more affordable price. The Radeon HD 4870 now sells for as low as $134.99 after rebate, making it difficult for the GTX 285. But that's where everything becomes unclear, and the value of ATI's latest product comes into question.
Here's why clarifying how the value has become so tricky is difficult to define. The initial interest in a product like the Radeon HD 4850 lies in the fact that it competes head-on with the GeForce GTS 250 (9800 GTX). But now that they are both priced roughly the same, value takes on a new dimension. In each and every test I conducted, the Radeon HD 4850 kept up with the GeForce 9800 GTX but never outperformed it (until 4x AA was added to Crysis). This would be the main reason why I see value becoming more of an issue outside of video game performance. The GeForce 9800 GTX+ offers HDMI, and so does the Radeon HD 4850. Both offer essentially the same exact sub-features down the line, except for when it comes to multi-card configurations; which is where the CrossFireX configuration really comes to shine.
I am very much aware that NVIDIA offers SLI just like ATI offers CrossFireX, but what I'm talking about is multi-card compatibility with motherboards. AMD Didn't exactly impress the world with Phenom, and thus the world hasn't jumped onboard to use their processors. Instead, Intel scooped up a large share of the consumer base with their P35/X38/P45/X48 chipsets (all launched within about ten minutes from each other). But here's my point: ATI still wins. All of these Intel motherboards, along with all of the AMD motherboards, offer CrossFire support exclusively. NVIDIA is left holding their own hand, because only select few Intel X58-based motherboards are combining AMD's CrossFire technology with NVIDIA's SLI.
I'm not entirely sold on everything that the chipmakers would like for us to believe. I think it's sometimes worth questioning the wisdom, and in this regard I find that AMD is trying to pull one over on consumers by describing their RV770 to have 800 scalar processors. The reality is that ATI's 800 stream processor cores do not compare 1:1 against the competition, especially since the GeForce 9800 GTX can outperform the Radeon HF 4850 with only 128 shader cores. So despite what ATI would like to market, scalar processors they are not as they function exactly like vector processors would. With 800 processor cores residing in five bank location, each series of 5 processor cores process only one vector unit at a time - even if that vector doesn't need to use all five processor cores. 800 Cores are there, but they are far from the efficiency level seen by the competition.
My final thoughts on the 4800-series is where the Radeon 4850 and 4870 come up short. They're both great products just so that we're clear, but for a 55 nm process there's a lot missing from the RV770's arsenal that really should be there. I consider efficiency at the very start of this list, and even though my first lesson on the relationship between die process size and energy efficiency came from Mr. Jen-Hsun Huang, President of NVIDIA, I later researched this through my own testing and discovered that he was correct: reduced die process does not equal increased energy efficiency. Obviously this phenomenon holds up very well against the power consumption results I've tested for this review.
ATI's memory bus architecture also has me questioning their efforts. NVIDIA can produce a 512-bit memory bus making a 1:1 ratio of memory to interface (512MB @ 512-bit), so it's just a little disappointing that ATI did not do the same for their Radeon HD 4870/4890 (which both use GDDR5). Perhaps if I lower my expectations on improvements towards technology, I could accept a 256-bit Radeon HD 4850, but if you're going to make GDDR5 your marketing headline then perhaps you should also do something to match the technical achievements found in competing products. Notwithstanding, memory bandwidth is far from being saturated by today's gaming software (and hardware interface limits), and so my complaint is really more of a moot point, but it still stands to reason that AMD missed an opportunity here.
HD4890 Toxic Conclusion
Benchmark Reviews offers a summary rating for each product we test. Although our rating and final score are made to be as objective as possible, please be advised that every author perceives these factors differently at different points in time. While we do our best to ensure that all aspects of the product are considered, there are often times unforeseen market conditions and manufacturer changes which occur after publication that would render our rating obsolete. Please do not base your purchases solely on our conclusion, as it represents our product rating at the time of publication.
Beginning with the performance rating, the Sapphire HD4890 Toxic Vapor-X video card thoroughly exceeded any expectations we had for frame rate performance. While the HD4890 could be considered the most powerful single-GPU video card on the planet, that claim will depend on variables like factory-overclocked speeds. Given our benchmark test results, the massively-overclocked HD4890 almost always exceeded frame rate performance of our factory-overclocked ASUS ENGTX285TOP GTX 285. Of course, the Radeon HD4770 CrossFireX set did even better, and for less.
The HD4890 Toxic beat an overclocked GTX 285 in nearly every 3dMark06 test, and matched performance again in CoD4, Crysis, and Devil May Cry 4. At 1680x1050 the HD4890 matched performance of the GTX 285 in Far Cry 2, but exceeded it at 1920x1200 resolution. Considering we used overclocked versions of these graphics cards for testing, it looks perfectly reasonable to presume the HD4890 would beat a stock-speed GTX 285.
Judging the product appearance is a little more difficult than I'm used to. Lately, almost everything has been encased in plastic housings with a contoured finish. This doesn't mean that you can't look sharp without the extra plastic body work, but there's a level of protection all of that stuff provides which goes missing on the Radeon HD 4890. The Vapor-X cooling solution adds nicely chromed heat-pipe rods, but otherwise the features are very similar to other Radeon 4800-series products.
Construction is solid, but not without some reservation. I absolutely appreciate ATI for not placing memory module IC's on the back side of the PCB, and Sapphire did one better by adding Vapor-X cooling to the HD4890. However, heated air exhaust is coming to be a concern for enthusiasts who don't have appropriate ventilation inside their computer case. Because the Sapphire HD4890 Toxic exhausts back into the computer case, it's recommended that exhaust fan(s) be placed nearby to compensate for the increase heat.
The RV790 GPU isn't very much different than the RV770 chip it replaces. Adding decoupling capacitors (DeCaps) to the outer edge bulks the die footprint from 256 mm2 to 282 mm2, but it also reduces signal noise which in-turn allows for higher overall chip timing (and better overclock headroom). The functionality improvements are transparent to the Radeon HD 4890, and performance enthusiasts will benefit from the added tweakability. Sapphire took full advantage of this, and was able to deliver a 960MHz GPU as a result. With some extreme tweaking and possible modification, it might be possible to reach 1GHz, but the 11150-01-40R was already stretched pretty thin.
As of early June 2009 the Sapphire HD4890 Toxic Vapor-X RV790 video card 11150-01-40R was available at NewEgg for $259.99 before shipping. I know that Sapphire probably wouldn't like me to say this, but a pair of their HD4850's put into a CrossFireX set costs $99.99 each and performs better than a single HD4890, or even the overclocked Sapphire HD4890 Toxic. In comparison, the even least-expensive GeForce GTX 285 (which is not overclocked) sells for $314.99 at NewEgg after rebate and shipping promotion; creating an unfavorable $55 excess on the price tag for a product that can't match performance of the HD4890.
In conclusion, the Sapphire HD4890 Toxic Vapor-X RV790 video card 11150-01-40R is exactly what consumers have wanted for more than a year: an ultra-high performance graphics that costs much less than the competition. AMD did it to Intel back when they launched the Athlon processor, seriously beating the Pentium 4 in both performance and price. Now AMD/ATI returns to put NVIDIA back in place and offers the HD4890 to compete against the GTX 285... but at a much lower price. Benchmark Reviews has completed testing on the HD4890 Toxic with Vapor-X cooling, and on paper it looks to perform exactly like a heavily-overclocked GeForce GTX 265 might, but considering the availability of CrossFireX motherboards it will be very easy to find a home for two of these video cards compared to the SLI counterparts. To that end, I will concede that the Radeon HD 4890 is a better product than the NVIDIA GTX 265, but better than these two products is a CrossFireX set of Radeon HD4770's or (more effectively) HD4850's, which delivers the same performance at a better price.
Pros:
+ Exceeds overclocked GTX 285 gaming performance
+ Costs much less than competing alternatives
+ Outstanding performance for high-end games
+ Supports DirectX 10 and Shader Model 4.1
+ 960 MHz RV790 GPU (overclocks to 975 MHz)
+ 1 GB of 1050 MHz GDDR5 vRAM (4.2 GBps)
+ 1080p HDMI Audio and Video supported for HDCP output
+ Very-quiet cooling fan under loaded operation
+ Supports CrossFireX functionality
+ Effective Vapor-X thermal cooling solution
+ Kit includes CrossFireX bridge component
Cons:
- Fan exhausts some heated air back into case
- Maximum post-processing Anti Aliasing is limited to 8x
- 65W power consumption at idle, 316W under load
- Expensive premium-level product
Ratings:
-
Performance: 9.25
-
Appearance: 9.25
-
Construction: 9.50
-
Functionality: 9.75
-
Value: 7.25
Final Score: 9.0 out of 10.
Excellence Achievement: Benchmark Reviews Golden Tachometer Award.
Questions? Comments? Benchmark Reviews really wants your feedback. We invite you to leave your remarks in our Discussion Forum.
Related Articles:
- AMD Phenom II X4 965 BE CPU HDZ965FBGIBOX
- VisionTek Radeon HD 6850 Video Card
- Titan G4TZ Magic Pad Notebook Cooler
- Mythbusters DVD: Treats for Techies
- 33-Way Thermal Interface Material Comparison
- Cooler Master V6GT CPU Cooler
- Kingston KHX13000D3LLK2/2G PC3-13000 DDR3 1625MHz
- ASUS P6T Deluxe OC Palm Edition X58 Motherboard
- CM Storm Strike Force SF-19 Laptop Cooler
- XFX Radeon HD5830 DX11 Video Card
