| Sapphire Radeon HD 4870 Video Card 100243L |
| Reviews - Featured Reviews: Video Cards | |||||||||||||||||||||||||||||||||||||||||||||||||||||||||||||||||||||||||||||||||||||||||||||||||||||||||||||||||||||||||||||||||||||||||||||||||||||||||||||||||||||||||||||||||||||||||||||||||||||||||||||||||||||||||||||||||||||||||||||||||||||||||||||||||||||||||||||||||||||||||||||||||||||||||||||||||||||||||||||||||||||||||||||||||||||||||||||||||||||||||||||||||||||||||||||||||||||||||||||||||||||||||||||||||||||||||||||||||||||||||||||||||||||||||||||||||||||||||||
| Written by Olin Coles | |||||||||||||||||||||||||||||||||||||||||||||||||||||||||||||||||||||||||||||||||||||||||||||||||||||||||||||||||||||||||||||||||||||||||||||||||||||||||||||||||||||||||||||||||||||||||||||||||||||||||||||||||||||||||||||||||||||||||||||||||||||||||||||||||||||||||||||||||||||||||||||||||||||||||||||||||||||||||||||||||||||||||||||||||||||||||||||||||||||||||||||||||||||||||||||||||||||||||||||||||||||||||||||||||||||||||||||||||||||||||||||||||||||||||||||||||||||||||||
| Sunday, 13 July 2008 | |||||||||||||||||||||||||||||||||||||||||||||||||||||||||||||||||||||||||||||||||||||||||||||||||||||||||||||||||||||||||||||||||||||||||||||||||||||||||||||||||||||||||||||||||||||||||||||||||||||||||||||||||||||||||||||||||||||||||||||||||||||||||||||||||||||||||||||||||||||||||||||||||||||||||||||||||||||||||||||||||||||||||||||||||||||||||||||||||||||||||||||||||||||||||||||||||||||||||||||||||||||||||||||||||||||||||||||||||||||||||||||||||||||||||||||||||||||||||||
Sapphire Radeon HD 4870Tao Le Ching had it right: the more you know, the less you understand. This notion surrounds the computer hardware industry as much as anything, because I have discovered that the moment my experiences lead me towards one opinion, the industry changes and goes into a new direction. Case in point: AMD / ATI. Phenom processors built for the Spider platform have had a very difficult time building momentum against Intel, relegating AMD to being second-best. At the other end of the corporate conglomerate is ATI, which has taken such a beating from NVIDIA that most enthusiasts would have to agree that their future looked bleak prior to Q2 2008. But that's exactly when things changed. At some undetermined point in late June of 2008, ATI and AMD each gained ground on the competition in small steps. AMD launched several enthusiast-level processor, lifting them up out of the tailspin. Around the same time ATI launched their Radeon HD 4850 video card, which directly competes with the GeForce 9800 GTX and GTX+. Then, after a few on-again off-again launch dates, NVIDIA and ATI did an excellent job of confusing the community with a barrage of product launches. NVIDIA came out swinging with their GeForce GTX 280 and GTX 260 video cards, and ATI retaliated with the Radeon HD 4870 featuring the industries first implementation of GDDR5 video memory. When it comes to ATI products Sapphire has always offered the most influential graphics cards available, and the new Radeon HD 4870 is no different. For the first time in this industry, we have a fully-functional product equipped with 900 MHz GDDR5 video frame buffer. The Sapphire 100243L model offers 24x custom filter anti-aliasing (CFAA) on its 750 MHz 800-core RV770 GPU. Benchmark Reviews tests the Sapphire Radeon HD 4870 graphics card against the closest competition, and even compare CrossFireX performance in this performance review.
We live in a world where a company that produces the most powerful video card available is usually regarded as the leader in graphics technology. There is a certain amount of truth to this to be fair, but it's not always good to be the king. I imagine NVIDIA has to be getting a little tired of constantly polishing the throne in a lonely palace, especially after their recent launch of the NVIDIA GeForce GTX 280 offered just as much to gamers as it did to multimedia editors. But what happens to everyone else who doesn't have enough gold to buy a piece of the kingdom? The Radeon 4800-series is what happens. Ever since AMD purchased ATI, not only have times been tough for chipmakers, but our national economy has gone down the moat. Adding to the frustration for AMD was a series of flawed product launches and less-than-spectacular performance from those products that actually worked. So when you're living out in the stables with livestock, you learn to make the best of what you have. This is what it appears ATI has done with their latest Radeon HD 4850, and improved upon in the 4870 graphics card. About the company: Sapphire Technology
|
|||||||||||||||||||||||||||||||||||||||||||||||||||||||||||||||||||||||||||||||||||||||||||||||||||||||||||||||||||||||||||||||||||||||||||||||||||||||||||||||||||||||||||||||||||||||||||||||||||||||||||||||||||||||||||||||||||||||||||||||||||||||||||||||||||||||||||||||||||||||||||||||||||||||||||||||||||||||||||||||||||||||||||||||||||||||||||||||||||||||||||||||||||||||||||||||||||||||||||||||||||||||||||||||||||||||||||||||||||||||||||||||||||||||||||||||||||||||||||

|
Product |
HD4850 512M STD |
HD4870 512M STD |
|
VPU Clock(MHz) |
625 |
750 |
|
Memory Size |
512MB |
512MB |
|
Memory Data Width |
256bit |
256bit |
|
Memory Type |
GDDR3 |
GDDR5 |
|
Memory Speed(MHz) |
993 |
900(3.6Gbps) |
|
Maximum Board Power(Watt) |
120 |
163 |
|
Thermal Solution |
Single Slot Fan |
Dual Slot Fan |
|
BUS Type |
PCI-E x 16, 2.0 |
PCI-E x 16, 2.0 |
|
DirectX10/Shader Model 4.1 |
Yes |
Yes |
|
VGA Output |
Yes, by dongle |
Yes, by dongle |
|
DL-DVI-I |
x 2 |
x 2 |
|
SL-DVI-I |
- |
- |
|
HDMI |
Yes, by dongle |
Yes, by dongle |
|
H.264/VC-1 Acceleration |
Yes |
Yes |
|
7.1 Audio Support |
Yes |
Yes |
|
HDCP Support |
Yes |
Yes |
|
HDTV Out |
Yes |
Yes |
|
Form Factor |
ATX |
ATX |
|
Packing |
Bulk/Light/Full |
Bulk/Light/Full |
|
Board Type |
BBA |
BBA |
Closer Look: Sapphire 4870
The Sapphire HD 4870 delivers a new level of performance to the mainstream user with its 512MB of GDDR5 memory, and nominal clock speeds of 750MHz (core) and 900MHz (memory). The 4870 uses the PCI-Express Gen2 interface, and features dual connectors for CrossFireX cables, allowing two or more cards to be used together on a CrossFireX compatible mainboard for even higher graphics performance.
All SAPPHIRE graphics cards in the HD 4800 series incorporate the latest ATI Avivo HD Technology for enhanced Video display and feature a new generation built in hardware UVD (Unified Video decoder) considerably reducing CPU load and delivering smooth decoding of Blu-ray and HD DVD content for both VC-1 and H.264 codecs, as well as Mpeg files. In addition to two, dual-link DVI outputs, and TV-Out, a dedicated HDMI adaptor delivers both audio and video output on a single cable for direct connection to an HDMI ready display.
You can consider me a product design critic, among other things. Unlike many in our community, I have some experience inside the manufacture industry and understand how cost can overcome common-sense. ATI has always proved themselves to be conscious of both, offering the optimal blend of value and performance. This principal is enforced again with the Sapphire Radeon HD 4870 Video Card 100243L, ATI's latest and greatest graphics card. Featuring the industries first implementation of GDDR5 video frame buffer memory, the overclocked RV770 graphics processor is allowed to breathe fire without the worry of burning up video RAM.
The Sapphire Radeon HD 4870 graphics card (part number 102-B50701-10-AT / SKU 100243L) comes in classic ATI red and offers a double-slot sized product for the PCI-Express 2.0 bus. There are a few small details that seem to stand out as either interesting or unique, and I'll make sure to discuss each at length. Let's begin with looks.
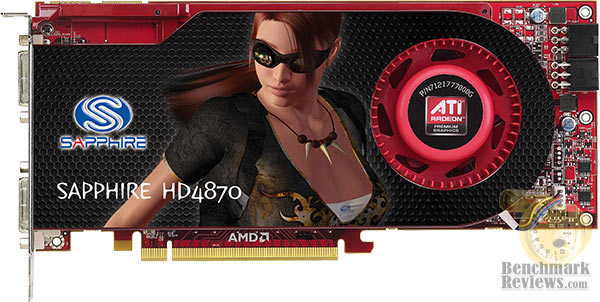
Sapphire has been (and will likely continue to be) an icon for sex-sells marketing within the VGA industry. Palit has their cyborg-frog, XFX has an armor-clad wolf, and ZOTAC has a fire-breathing dragon; but none match the collection of attractive characters adorning Sapphire products. Although they have tried to simmer it down in the past few years, I still associate racy characters with their marketing graphics. I suppose that there's nothing wrong with an animated cute she-warrior looking out at you from the decals and retail packages Sapphire exposes them on, because after all this is a geeks industry. On the Radeon HD 4870, Sapphire offers up a Laura Croft-like character with goofy goggles on.
There's no question that the AMD-ATI merger has trickled down into a serious economy-of-design state of mind. As I finish editing this article, the nearest competition to ATI has just taken a 31% drop in their traded stock value, something that may put the two chipmakers on a more even playing field. Nevertheless, Sapphire continues on with their mission, and produces some of the best video cards money can buy. Value translates into several different things, however, and he design of the Radeon HD 4870 is not without its flaws.
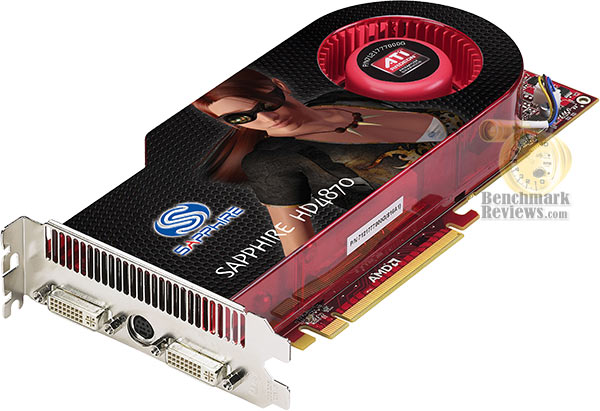
While I am a huge fan of externally-exhausting VGA coolers such as the one used on the Radeon HD 4870, I am not at all pleased with the exposed electronics that come with a shortened cooler. Sapphire has the option of creating their own custom cooling unit (ala HIS), so I understand why they didn't try to reinvent the wheel when it already rolls so well. The cooling unit that attaches to Sapphire 100243L uses less-expensive aluminum materials, which means that the cost of covering the entire PCB to the edges would be barely noticeable. Taken into consideration is the cost of RMA returns and repairs, and the miniscule cost of a slightly larger cooler would begin to seem like a very good investment.
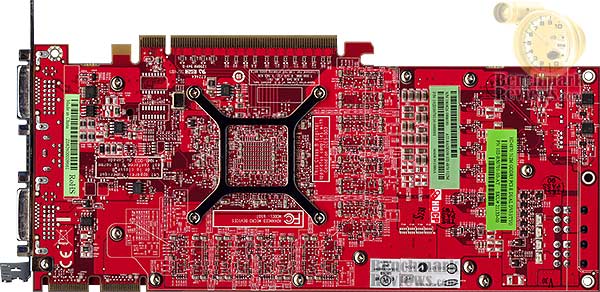
The cooling unit on the Sapphire Radeon HD 4870 video card is held tight to the RV770 GPU with the use of a reinforcing bracket and about a dozen screws. The double-height cooler does an adequate job of cooling the 4870, but there is still a tremendous amount of heat that builds up on the PCB. If you're an overclocker, there isn't very much that can be done to help cool the unit from the reverse side of the circuit board, especially since there are no surface-mounted GDDR5 modules on this side of the Sapphire 100243L Radeon HD 4870.
In truth, the double-size active cooling solution is barely enough to contain this wild fire. The RV770 is "merely" overclocked from the Radeon HD 4850 to the 4870, and the increase in heat output is directly obvious. At idle, the Sapphire 100243L recorded a very warm 78°C, and under load that number raised to 88°C. While I'm happy with the large active cooling solution ATI designed for the 4870, I wasn't so pleased with it's cooling ability when I burned my hand while removing this video card after testing. The heat buildup on the backside retaining bracket was so hot that I ended up with blisters on my hand (which is a lot of fun for a writer), so hopefully you won't repeat my mistake and should avoid playing with fire.
In our next section we detail our methodology for testing video cards. Following this we offer a cadre of benchmarks to show where the Sapphire Radeon HD 4870 stands against the GeForce 9800 GX2, Radeon HD 4850, 9800 GTX. and an AMP!'ed GTX 280's. We even test the HD 4870 against a set of 4850's in CrossFireX... so please read on!
Video Card Testing Methodology
Benchmark Reviews has high hopes that one day we will be so giant and world famous that every combination of the graphic card available will be on-hand for our product testing... and we're getting closer! I envy the review sites that have twenty other video cards tested in stand-alone, SLI, and CrossFireX arrays for each and every review. Eventually we will be that big, and offer all of those configurations. Readers can help us grow to that size by spreading the word, but for now we'll have to make due with what our budget can afford. In this article, Benchmark Reviews is going to test and compare the NVIDIA GeForce GTX 280 1GB graphics card against several other closely-ranked products from within the GeForce family.
At the start of all tests, the previous display adapter driver is uninstalled and trace components are removed using Driver Cleaner Pro. We then restart the computer system to establish our display settings and define the monitor. Once the hardware is prepared, we begin our testing. The synthetic benchmark tests in 3DMark06 will utilize shader models 2.0 and 3.0. In our higher-end VGA products we conduct tests at the following resolutions: 1280x1024 (19" Standard LCD), 1680x1050 (22-24" Widescreen LCD), and 1920x1200 (24-28" Widescreen LCD). In some tests we utilized widescreen monitor resolutions, since more users are beginning to feature these products for their own computing.

Each benchmark test program begins after a system restart, and the very first result for every test will be ignored since it often only caches the test. This process proved extremely important in the World in Conflict and Supreme Commander benchmarks, as the first run served to cache maps allowing subsequent tests to perform much better than the first. Each test is completed five times, with the average results displayed in our article.
Our site polls and statistics indicate that the over 90% of our visitors use their PC for playing video games, and practically every one of you are using a screen resolutions mentioned above. Since all of the benchmarks we use for testing represent different game engine technology and graphic rendering processes, I feel that this battery of tests will provide a diverse range of results for you to gauge performance on your own computer system. Since most gamers and enthusiasts are still using Windows XP, it was decided that DirectX 9 would be used for all tests until demand and software support improve for Windows Vista.
Test System
-
Motherboard: Gigabyte GA-X48T-DQ6 (Intel X48 Chipset) with version F4 BIOS
-
Processor: Intel E8400 Core 2 Duo 3.0 GHz (Overclocked to 3.6 GHz)
-
System Memory: Corsair PC3-14400 DDR3 1800MHz
-
Disk Drive 1: OCZ SATA-II 32GB 2.5-Inch SSD OCZSSD2-1S32G
-
Disk Drive 2: (Paging File) MemoRight GT MR25.2-064S 2.5-Inch 64GB SATA SSD
-
Optical Drive: ASUS BC-1205PT SATA Blu-ray Disc Optical Drive
-
Operating System: Windows XP Professional SP-3 (optimized to 16 processes at idle)
Benchmark Applications
-
3DMark06 v1.1.0 (8x Anti Aliasing & 16x Anisotropic Filtering)
-
Call of Duty 4: Modern Warefare v1.5 (4x AA/16x Trilinear AF)
-
Crysis v1.21 Benchmark (High Settings, 0x and 4x Anti-Aliasing)
-
Lightsmark 2007 v1.3
-
Unreal Tournament 3 v1.2 (High Quality, 16x Anisotropic Filtering)
-
World in Conflict v1.0.0.8 Performance Test (Very High Setting: 4x AA/4x AF)
Video Card Test Products
| Product Series | Sapphire Radeon HD 4850 102-B50102-00-AT | FOXCONN GeForce 9800 GTX 9800GTX-512N | Sapphire Radeon HD 4870 102-B50701-10-AT | ZOTAC GeForce GTX 280 AMP! Edition ZT-X28E3LA-FCP | |
| Stream Processors | 800 | 128 | 800 | 128 (x2) | 240 |
| Core Clock (MHz) | 625 | 685 | 750 | 600 (x2) | 700 |
| Shader Clock (MHz) | N/A | 1713 | N/A | 1500 (x2) | 1400 |
| Memory Clock (MHz) | 993 | 1100 | 900 | 1000 (x2) | 1150 |
| Memory Amount | 512 MB GDDR3 | 512 MB GDDR3 |
512 MB GDDR5 |
512MB (x2) GDDR3 | 1024 MB GDDR3 |
| Memory Interface | 256-bit | 256-bit | 256-bit | 256-bit (x2) | 512-bit |
-
Sapphire Radeon HD 4850 102-B50102-00-AT (625 MHz GPU/993 MHz RAM - Catalyst 8.6 Step 5)
-
FOXCONN GeForce 9800 GTX Standard OC Edition 9800GTX-512N (685 MHz GPU/1713 Shader/1100 RAM - Forceware v175.16)
-
Sapphire Radeon HD 4870 102-B50701-10-AT (750 MHz GPU/900 MHz RAM - Catalyst 8.6 Step 5)
-
Gigabyte GeForce 9800 GX2 GV-NX98X1GHI-B (600 MHz GPU x2/1500 Shader/1000 RAM - Forceware v175.16)
-
ZOTAC GeForce GTX 280 AMP! Edition ZT-X28E3LA-FCP (700 MHz GPU/1400 MHz Shader/1150 MHz RAM - Forceware v177.35)
Now we're ready to begin testing video game performance on the Sapphire Radeon HD 4870, so please continue to the next page as we start with the 3DMark06 results.
3DMark06 Benchmark Results
3DMark is a computer benchmark by Futuremark (formerly named Mad Onion) to determine the DirectX 9 performance of 3D game performance with graphics cards. 3DMark06 uses advanced real-time 3D game workloads to measure PC performance using a suite of DirectX 9 3D graphics tests, CPU tests, and 3D feature tests.
3DMark06 tests include all new HDR/SM3.0 graphics tests, SM2.0 graphics tests, AI and physics driven single and multiple cores or processor CPU tests and a collection of comprehensive feature tests to reliably measure next generation gaming performance today. Some enthusiasts may note that Benchmark Reviews does not include CPU-bound tests in our benchmark battery, and that only graphic-bound tests are included.
Here at Benchmark Reviews, we believe that synthetic benchmark tools are just as valuable as video games, but only so long as you're comparing apples to apples. Since the same test is applied in the same controlled method with each test run, I believe 3DMark is a very reliable tool for comparing graphic cards against one-another.
More visitors to Benchmark Reviews operate at 1280x1024 resolution than any other, as it represents the native resolution of 19" LCD monitors. Using this resolution as a starting point, the maximum settings were applied to 3dMark06 which for these tests include 8x Anti-Aliasing and 16x Anisotropic Filtering. Low-resolution testing allows the graphics processor to plateau maximum output performance, which thereby shifts demand onto the system components to keep up. At the lower resolutions 3DMark will reflect the GPU's top-end speed in the composite score, indicating full-throttle performance with little load. This makes for a less GPU-dependant test environment, and is helpful in measuring the maximum output performance in the test results.

Right away our test results indicate that 3dMark06 benchmarks really like the CrossFireX pair of Sapphire Radeon HD 4850 video cards. But because of the added overhead of combined graphics processors and video frame buffer memory, the light load created by the shader model 2.0 tests have a relatively negative impact on the CrossFireX score. Another way of describing this phenomenon is comparing the combined Radeon HD 4850 video cards to a race car that has only high gears available in the transmission: it will have a faster top-end speed, but it will take longer to get there. The ZOTAC GeForce GTX 280 AMP! Edition video card is appears to also be another high-gear example, as gets nudged-out by the GeForce 9800 GX2 for SM 2.0 tests but outperforms the GX2 in the more complex HDR/SMR 2.0 tests.
In the SM 2.0 tests the Sapphire Radeon HD 4870 keeps just ahead of the Radeon HD 4850 and GeForce 9800 GTX at this resolution, in the same way the Gigabyte GeForce 9800 GX2 keep pace with the overclocked GeForce GTX 280 AMP! Edition video card. However, moving into the more advanced HDR tests the Radeon HD 4870 produces a much more decisive lead over the 9800 GTX and maintains a proportionate lead over the Radeon HD 4850. The interesting news is that the Sapphire Radeon HD 4870 is beginning to approach the 9800 GX2 and GTX 280 performance levels.

At the widescreen resolution of 1680x1050, the scores are practically identical in terms of ratio to all of our previous tests. Once again, the shader model 2.0 tests put the 9800 GTX barely ahead of the HD 4850, at least until they reach the shader model 3.0 tests where everything is reversed. Twin Sapphire Radeon HD 4850 video cards in a CrossFireX set are still running circles around the competition in every 3dMark06 benchmark we run, and makes the argument for inexpensive multi-card performance. The Sapphire Radeon HD 4870 actually creeps past the 9800 GX2 and begins to approach the overclocked ZOTAC GeForce GTX 280 AMP! Edition.

Finishing up the series of synthetic benchmark tests under heavy load, the FOXCONN GeForce 9800 GTX Standard OC Edition video card matches the Sapphire Radeon HD 4850 in the SM 2 tests, yet the Radeon HD 4850 dominates over the 9800 GTX by 32% in the more demanding shader model 3.0 tests. More impressive is the fact that Sapphire's Radeon HD 4870 can match the GeForce 9800 GX2 and come within 8% of performance delivered by the AMP!'ed GTX 280.
One of NVIDIA's goals for the GT200 was to produce a GPU that doubles the performance of the older 8800 GTX, but it looks like ZOTAC's goal was a little different as it nearly doubles the performance of the newer 9800 GTX. Producing 3647 HDR/SM3 points, the ZOTAC GTX 280 AMP! Edition outperforms the twin-G92 9800 GX2 by only 6%, and the Radeon HD 4850 by 41%. However, taking cost into consideration, the CrossFireX set of Sapphire 4850's outperforms the more expensive GTX 280 by over 40% in 3dMark06; and the Sapphire 4870 nearly matches it.
| Product Series | Sapphire Radeon HD 4850 102-B50102-00-AT | FOXCONN GeForce 9800 GTX 9800GTX-512N | Sapphire Radeon HD 4870 102-B50701-10-AT | ZOTAC GeForce GTX 280 AMP! Edition ZT-X28E3LA-FCP | |
| Stream Processors | 800 | 128 | 800 | 128 (x2) | 240 |
| Core Clock (MHz) | 625 | 685 | 750 | 600 (x2) | 700 |
| Shader Clock (MHz) | N/A | 1713 | N/A | 1500 (x2) | 1400 |
| Memory Clock (MHz) | 993 | 1100 | 900 | 1000 (x2) | 1150 |
| Memory Amount | 512 MB GDDR3 | 512 MB GDDR3 |
512 MB GDDR5 |
512MB (x2) GDDR3 | 1024 MB GDDR3 |
| Memory Interface | 256-bit | 256-bit | 256-bit | 256-bit (x2) | 512-bit |
Take the 3DMark06 tests at face value, because in our next section we begin real-world testing on a cadre of popular video games known for taxing the graphics processor, and the performance curve is expected change. Our first up is Call of Duty 4, so please continue on...
Call of Duty 4 Benchmark Results
Call of Duty 4: Modern Warfare runs on a proprietary game engine that Infinity Ward based off of the tried-and-true Q3 structure. This engine offers features such as true world-dynamic lighting, HDR lighting effects, dynamic shadows and depth of field. "Bullet Penetration" is calculated by the Infinity Ward COD4 game engine, taking into account things such as surface type and entity thickness. Certain objects, such as cars, and some buildings are destructible. This makes distinguishing cover from concealment important, as the meager protection provided by things such as wooden fences and thin walls does not fully shield players from harm as it does in many other games released during the same time period. Bullet speed and stopping power are decreased after penetrating an object, and this decrease is calculated realistically depending on the thickness and surface of the object penetrated.
This version of the game also makes use of a dynamic physics engine, a feature which was not implemented in previous Call of Duty titles for Windows PC's. The new in-game death animations are a combination of pre-set static animations combined with ragdoll physics. Infinity Ward's use of the well-debugged Quake 3 engine along with new dynamic physics implementation allows Call of Duty 4 to be playable by a wide range of computer hardware systems. The performance may be scaled for low-end graphic cards up to 4x Anti-Aliasing and 16x Tri-linear anisotropic texture filtering.
Before I discuss the results, I would like to take a moment to mention my general opinion on Fraps software when it comes to game performance benchmarking. If you're not familiar with the software, Fraps (derived from Frames per second) is a benchmarking, screen capture, and real-time video capture utility for DirectX and OpenGL applications. Some reviewers use this software to measure video game performance on their Windows system, as well as record gaming footage. My opinion is that it offers a valid third-party non-bias alternative to in-game benchmarking tools; but there is one caveat: it's not perfect. Because the user must manually begin the test, the starting point may vary from position to position and therefore skew the results.
In my testing with Fraps v2.9.4 build 7039, I used the cut-scene intro to the coup d'etat scene when Al Asad takes over control. First I allowed the level to load and let the scene begin for a few moments, then I would use the escape key to bring up the menu. Once I selected the restart level option, I would immediately press F11 to begin recording the benchmark data. This scene is nearly four minutes long, but I configured Fraps to record the first 180 seconds of it to remain consistent. Once the scene would end, I would repeat the restart process for a total of five tests. So within a 0.2 second starting point margin, all benchmark results are comparable which is probably as good as it can possibly get with this tool.

In our frame rate results, all five of the collected test scores were within 0.5 FPS of one-another and then averaged for the chart you see above. Once the tests had been repeated and the results recorded, It was clear that the RV770 was a superiour graphics processor when compared to the GT92 GPU. At the lower resolutions the Radeon HD 4870 was able to close the gap and get within range of the GeForce 9800 GX2 and GTX 280 AMP! Edition. Throughout our testing the top two video cards were virtually identical in performance, with a barely measurable lead over the 9800 GX2 by the GTX 280. Of course the differences are negligible at best, and the AMP!'ed GTX 280 is heavily overclocked while the 9800 GTX is at the stock reference speed.
Call of Duty 4 put a reasonable amount of strain on the Radeon HD 4850 and 4870 video cards, but they both did very well for themselves during our tests. Since the maximum anti-aliasing available in COD4 is 4x, there won't be any problem with the Radeon 4800-series limit of 8x AA. At 1920x1200 resolution, the Radeon HD 4870 approached within 11% of the GeForce 9800 GX2 while beating out the 9800 GTX by 48%. The Radeon HD 4850 surpassed the GeForce 9800 GTX by 18%, but trailed behind the Sapphire 4870 by 25%.
| Product Series | Sapphire Radeon HD 4850 102-B50102-00-AT | FOXCONN GeForce 9800 GTX 9800GTX-512N | Sapphire Radeon HD 4870 102-B50701-10-AT | ZOTAC GeForce GTX 280 AMP! Edition ZT-X28E3LA-FCP | |
| Stream Processors | 800 | 128 | 800 | 128 (x2) | 240 |
| Core Clock (MHz) | 625 | 685 | 750 | 600 (x2) | 700 |
| Shader Clock (MHz) | N/A | 1713 | N/A | 1500 (x2) | 1400 |
| Memory Clock (MHz) | 993 | 1100 | 900 | 1000 (x2) | 1150 |
| Memory Amount | 512 MB GDDR3 | 512 MB GDDR3 |
512 MB GDDR5 |
512MB (x2) GDDR3 | 1024 MB GDDR3 |
| Memory Interface | 256-bit | 256-bit | 256-bit | 256-bit (x2) | 512-bit |
In our next section, we shall see if the performance-demanding video game Crysis will help strengthen this position.
Crysis Benchmark Results
Crysis uses a new graphics engine: the CryENGINE2, which is the successor to Far Cry's CryENGINE. CryENGINE2 is among the first engines to use the Direct3D 10 (DirectX10) framework of Windows Vista, but can also run using DirectX9, both on Vista and Windows XP.
Roy Taylor, Vice President of Content Relations at NVIDIA, has spoken on the subject of the engine's complexity, stating that Crysis has over a million lines of code, 1GB of texture data, and 85,000 shaders. To get the most out of modern multicore processor architectures, CPU intensive subsystems of CryENGINE 2 such as physics, networking and sound, have been re-written to support multi-threading.
Crysis offers an in-game benchmark tool, which is similar to World in Conflict. This short test does place some high amounts of stress on a graphics card, since there are so many landscape features rendered. For benchmarking purposes, Crysis can mean trouble as it places a high demand on both GPU and CPU resources. Benchmark Reviews uses the Crysis Benchmark Tool by Mad Boris to test frame rates in batches, which allows the results of many tests to be averaged.
The very first thing we discovered in the low-resolution tests was how seemingly poor both of our multi-GPU products performed. The Gigabyte GeForce 9800 GX2 was matched in average frame rate by the Sapphire Radeon HD 4850, and the GeForce 9800 GTX edged out the CrossFireX set of 4850's. To be fair, none of these video cards will probably ever realistically see this low of a resolution, so the performance only illustrates how high-end GPU power can be cut short if the monitor (resolution) doesn't match it.
Low-resolution testing allows the graphics processor to plateau maximum output performance, which thereby shifts demand onto the system components. At the lower resolutions Crysis will reflect the GPU's top-end speed in the composite score, indicating full-throttle performance with little load. This makes for a less GPU-dependant test environment, and is helpful in creating a baseline for measuring maximum output performance in the next few test results. At the 1280x1024 resolution used by 19" monitors, our results show that performance is beginning to really drop despite the small difference is pixels drawn. In terms of general performance, all of these products maintain the same performance ratio as before, except for the 9800 GX2 which seems to hold its ground.

The CrossFireX set of HD 4850's is going to soon reach it's limit, as it is in last gear and the 9800 GX2 is still shifting up the tree. Sapphire's Radeon HD 4870 flexes GDDR5 muscle at 1680x1080, running alongside the overclocked ZOTAC GeForce GTX 280 AMP! Edition ZT-X28E3LA-FCP with only a 5% difference. For widescreen users, our benchmarks below indicate that the the ATI Radeon HD 4870 matches the performance of NVIDIA's GeForce 9800 GX2 video card, although the 4870 stops delivering post-processing effects at 8x AA and the 9800 GX2 can reach 32x AA if the application supports it. The CrossFireX set of HD 4850's appear to be matching performance of a single Radeon HD 4870 video card; at least as far as Crysis is concerned. Testing in high-pressure Crysis also seems to have effected both of the GeForce GTX 280 products we've tested, which are barely ahead of the GeForce 9800 GX2 dual-GPU graphics card.
Reading the results of our 1920x1200 resolution tests using the SOYO DYLM26E6 monitor for testing, Crysis forces 2.3 million pixels to be processed by our graphical test products. At our highest widescreen resolution, the overclocked Foxconn 9800GTX-512N performs nearly the same as Sapphire's Radeon HD 4850, but the Sapphire Radeon HD 4870 come in 23% higher than the 9800 GTX. Despite what 3dMark06 previously reported, the CrossFireX set of Radeon HD 4850's is not king; the GeForce GTX 280 series is. If only by a small difference, the overclocked ZOTAC GTX 280 enjoys a 5% (2 FPS) lead over the GeForce 9800 GX2, which also seem keep its own 8% (3 FPS) lead over the CrossFireX set.
At the end of our Crysis testing, neither the GeForce 9800 GTX or CrossFireX HD 4850 set could touch the single ZOTAC GTX 280 AMP! Edition video card. But before we leave Crysis, I decided to include a look at post-processing performance with 4x AA enabled at the 1680x1050 and 1920x1200 resolutions. The chart below shows the average frame rate performance with 4x Anti-Aliasing enabled.

At 1680x1050, the Radeon HD 4850 is matched perfectly against the GeForce. The Sapphire 100243L Radeon HD 4850 video card is matched evenly against the CrossFireX set of 4850's, but falls 28% short of reaching the Gigabyte GeForce 9800 GX2. As if it was really unexpected, ZOTAC's GTX 280 AMP! Edition comes out (way) on top. But once the Honeywell 22-Inch LCD was swapped out, I began testing at 1920x1200 and the differences were made very clear.
Since NVIDIA has recently reduced the price of GeForce 9800 GTX products to compete with the HD 4850, there will be some intense fighting between these two products. My professional opinion is that if these two products shared the exact same price and I only wanted to buy just one of them, my money would go towards the Radeon HD 4850 over the GeForce 9800 GTX. This is specially favorable if you want excellent bang for the buck from a multi-GPU array such as CrossFireX, primarily because of performance and widespread compatibility. This same argument holds true for consumers choosing between the GeForce 9800 GX2 and Radeon HD 4870. At 1920x1200 the proof is self-evident, as the Sapphire 4870 beats the everything we've put against it except a heavily overclocked GTX 280.
With only a small dose of anti-aliasing added to Crysis, there are very few products that would make for playable frame rates. Our Island timedemo mixes a some beach and water views so it's going to be on the high side of frame rates when compared to actual game play, but as you can see the Radeon products do extremely well when post-processing effects are added. Sapphire's hot-potato HD 4870 matched performance of our 4850 CrossFireX set, but trailed behind the GTX 280 by 52%. It appears that the G92 GPU really stands out like a sore thumb against the newer graphics processors, which I yield far better frame rates in our Crysis testing.
| Product Series | Sapphire Radeon HD 4850 102-B50102-00-AT | FOXCONN GeForce 9800 GTX 9800GTX-512N | Sapphire Radeon HD 4870 102-B50701-10-AT | ZOTAC GeForce GTX 280 AMP! Edition ZT-X28E3LA-FCP | |
| Stream Processors | 800 | 128 | 800 | 128 (x2) | 240 |
| Core Clock (MHz) | 625 | 685 | 750 | 600 (x2) | 700 |
| Shader Clock (MHz) | N/A | 1713 | N/A | 1500 (x2) | 1400 |
| Memory Clock (MHz) | 993 | 1100 | 900 | 1000 (x2) | 1150 |
| Memory Amount | 512 MB GDDR3 | 512 MB GDDR3 |
512 MB GDDR5 |
512MB (x2) GDDR3 | 1024 MB GDDR3 |
| Memory Interface | 256-bit | 256-bit | 256-bit | 256-bit (x2) | 512-bit |
In our next section, Benchmark Reviews switches to video-output only benchmarking with Lightsmark 2007. Read on to see how a blended high-demand GPU test with low video frame buffer demand will impact our test products.
Lightsmark Frame Rates
Stepan Hrbek is the mastermind behind Lightmark 2007, a program that allows you to benchmark real-time global illumination. Natural lighting makes artificial graphics life-like and real. Computers get faster, but rendering more polygons doesn't add value if lighting still looks faked, so insiders know that the next big thing is proper lighting; aka Realtime Global Illumination.
Typical workloads in real-time rendering will shift, and Lightsmark simulates it. Global Illumination renders often take hours, so is your computer fast enough for real-time? Lighting is computed fully automatically in an original unmodified scene from 2007 game World of Padman. This benchmark is not tweaked for Lightsmark, and contains all sorts of geometrical difficulties with extra rooms hidden below the floor.
Before Lightsmark, real-time global illumination was limited to small scenes, small resolutions, small speeds, specially crafted scenes with handmade optimizations. Lightsmark breaks all limits at once, running in reasonably sized scene (220000 triangles) in high resolutions at excellent speed. Lightsmark is comparable to lower-demand OpenGL video games, such as: Call of Duty 4, Prey, Quake 4, and Doom 3.
This scene places medium to low demands on a graphics card processor and tests the maximum speed with which the scene can be properly displayed at each resolution. At the lower resolution, the large frame buffer does not offer the same benefits as it would at a higher resolution. Additionally, the larger video memory means a longer round-trip for information, and when the resolution is low that trip doesn't last very long and needs to be completed very quickly.

This is our first evidence that matching the video card to the rest of your hardware is just as important as matching it to the expected task. Notice from this test that Lightsmark doesn't favor the goliath Gigabyte GeForce 9800 GX2, or the CrossFireX set of Radeon HD 4850 graphic cards. In fact, the GeForce 9800 GX2 was outperformed in every single Lightsmark test by the GeForce 9800 GTX. What's really interesting to note is how the Radeon 4870 consistently trails behind the 9800 GTX at every resolution. Oddly enough, it was the G92 and GTX 200 GPU's that shined bright in LightsMark 2007.
When we tested Crysis at 1650x1050, video frame buffer was not as critical as raw processing power. It helped, but obviously it didn't make a huge margin of difference. In Lightsmark, information is passed through the buffer and called on very quickly, and the only thing which was going to benefit this test was the appropriate ratio of graphical stream processors to video memory buffer, so that it could keep up with demands. In terms of performance, this test offers very short but taxing graphics, and only the most nimble products with capable muscle can take advantage. This translates into trouble for anyone using new graphics hardware to render older (OpenGL) video games such as Doom 3 or Quake 4.
After all of the Lightsmark tests were complete, I wasn't sure that these test results would indicate anything in particular to most readers. As I mentioned before, the frame buffer has a whole lot to do with the speed of rendering. The larger the frame buffer, the longer it will take to complete the strobe of information. Lightsmark is meant to represent that collection of older games, which some of you might still be playing. Even Call of Duty 4: Modern Warfare runs on a proprietary game engine that Infinity Ward based off of the tried-and-true Q3 structure. So keep this in mind as you're shopping for a new video card, and don't overpower an older video game with multi-GPU graphics solutions because they will not produce the results you want.
| Product Series | Sapphire Radeon HD 4850 102-B50102-00-AT | FOXCONN GeForce 9800 GTX 9800GTX-512N | Sapphire Radeon HD 4870 102-B50701-10-AT | ZOTAC GeForce GTX 280 AMP! Edition ZT-X28E3LA-FCP | |
| Stream Processors | 800 | 128 | 800 | 128 (x2) | 240 |
| Core Clock (MHz) | 625 | 685 | 750 | 600 (x2) | 700 |
| Shader Clock (MHz) | N/A | 1713 | N/A | 1500 (x2) | 1400 |
| Memory Clock (MHz) | 993 | 1100 | 900 | 1000 (x2) | 1150 |
| Memory Amount | 512 MB GDDR3 | 512 MB GDDR3 |
512 MB GDDR5 |
512MB (x2) GDDR3 | 1024 MB GDDR3 |
| Memory Interface | 256-bit | 256-bit | 256-bit | 256-bit (x2) | 512-bit |
In the next section we change gears and test to compare our group of video cards in Unreal Tournament 3. Please continue on to see how the Unreal Engine 3 performs with our test collection of products.
Unreal Tournament 3
Unreal Tournament 3 (UT3) is a first-person shooter and online multiplayer video game by Epic Games and is the next installment of the Unreal series after Unreal Tournament 2004. It is published by Midway Games and was released in North America for Windows on November 19, 2007.
Unreal Tournament 3 is actually the fourth game in the Unreal Tournament series and the eighth Unreal game, but it has been numbered in terms of the engine it runs on. UT3 is subsequently part of the third generation, because it runs on the Unreal Engine 3, and does not reuse any content from previous versions.
Since Unreal Tournament 3 was designed as a DirectX 9 video game with no current support expected for DirectX 10, we use Windows XP Pro (Service Pack 3) for our benchmark testing. After completing tests on a wide range of products with settings at their highest, it appeared that Unreal Tournament 3 really didn't stress the video cards nearly as much as I would have liked.
Beginning at the low resolution of 1280x1024, the benchmark scores are so close (and high) for some products that it might be time to eliminate this game from our testing process. Nevertheless, it looks like the Unreal Engine 3 game engine doesn't care too much for the ATI Radeon HD 4850 or 4870 video cards. Even the CrossFireX set was just barely able to keep pace with the others that it surpassed in previous tests. With all High Quality settings and tweaks enabled along with 16x anisotropic filtering, Unreal Tournament 3 doesn't add strain to any of the graphics cards tested like Crysis did.
As the resolution was raised, the GeForce 9800 GTX eventually leveled out between the Radeon HD 4850 and 4870, which is really where the lightly-overclocked G92 product belongs for a low-demand game such as this one. The ZOTAC GeForce GTX 280 AMP! Edition loses just a single frame per second (0.6%) between 1280x1024 and 1680x1050, and the Sapphire Radeon 4850 drops only 6%. For now it appears that just about any graphics card can play Unreal Tournament 3 without issue, but quite frankly I don't know anyone who actually plays this game.

When I tested the Honeywell HWLM2216 recently, I noticed how the 1680x1050 widescreen display resolution of this 22" LCD monitor offered very little strain over a 19" standard display LCD monitor. Comparatively, 1680x1050 produces 1.76 MP and 1280x1024 produces 1.31, so there's only a very small difference expected between performance levels. The biggest difference is in the user experience, because the widescreen monitor comes in very handy for watching multimedia video or playing large world-scape video games.
At 1680x1050 resolution, the differences were beginning to show, but only 1920x1200 will be useful for illustrating how each product performs. Producing 2.3 MP with a 1920x1280 resolution on our 26" SOYO DYLM26E6 test monitor, each product is now separated far enough apart to sort out the winners and losers. The Sapphire Radeon HD 4850 still trails behind the GeForce 9800 GTX by 6%, but put another 4850 together for a CrossFireX set and they lead by 28%. The Sapphire Radeon HD 4870 enjoys a 11% lead over that same GeForce 9800 GTX, but the GeForce 9800 GX2 puts both G92 graphics processors to good use and beats the 4870 and both CrossFireX 4850's (by 16%). When everything was said and done, the overclocked ZOTAC GTX 280 AMP! Edition video card pulled off a very narrow victory over the 9800 GX2.
Similar to the LightsMark simulation tests, Unreal Tournament 3 appears to provide a very minimal load on the high-end video cards we're testing. Thankfully there are several new games arriving to market late into 2008, so with some luck this benchmark will only be used for low-end graphics comparison into the future.
| Product Series | Sapphire Radeon HD 4850 102-B50102-00-AT | FOXCONN GeForce 9800 GTX 9800GTX-512N | Sapphire Radeon HD 4870 102-B50701-10-AT | ZOTAC GeForce GTX 280 AMP! Edition ZT-X28E3LA-FCP | |
| Stream Processors | 800 | 128 | 800 | 128 (x2) | 240 |
| Core Clock (MHz) | 625 | 685 | 750 | 600 (x2) | 700 |
| Shader Clock (MHz) | N/A | 1713 | N/A | 1500 (x2) | 1400 |
| Memory Clock (MHz) | 993 | 1100 | 900 | 1000 (x2) | 1150 |
| Memory Amount | 512 MB GDDR3 | 512 MB GDDR3 |
512 MB GDDR5 |
512MB (x2) GDDR3 | 1024 MB GDDR3 |
| Memory Interface | 256-bit | 256-bit | 256-bit | 256-bit (x2) | 512-bit |
Our last benchmark of the article is coming next, which puts our collection of video cards against some very demanding graphics.
World in Conflict Benchmark Results
The latest version of Massive's proprietary Masstech engine utilizes DX10 technology and features advanced lighting and physics effects, and allows for a full 360 degree range of camera control. Massive's MassTech engine scales down to accommodate a wide range of PC specifications, if you've played a modern PC game within the last two years, you'll be able to play World in Conflict.
World in Conflict's FPS-like control scheme and 360-degree camera make its action-strategy game play accessible to strategy fans and fans of other genres... if you love strategy, you'll love World in Conflict. If you've never played strategy, World in Conflict is the strategy game to try.
World in Conflict offers an in-game benchmark; which records the minimum, average, and maximum frame rates during the test. Very recently another hardware review website made the assertion that these tests are worthless, but we couldn't disagree more. When used to compare video cards which are dependant on the same driver and use the same GPU architecture, the in-game benchmark works very well and comparisons are apples-to-apples.
Based on the test results charted below it's clear that WiC doesn't place a limit on the maximum frame rate (to conserve wasted power) which is good for full-spectrum benchmarks like ours, but bad for electricity bills. The average frame rate is shown for each resolution in the chart below. For the entire range of resolutions, the Radeon HD 4850 and GeForce 9800 GTX run neck-and-neck. Early on in testing at the 1280x1024 The CrossFireX set of HD 4850's are just a step behind the average frame rate of the GeForce 9800 GX2, and match the 4870 frame rate before having to settle down to just beneath the 9800 GX2 and GTX 280. Ultimately the overclocked ZOTAC GTX 280 would secure the lead with an average frame rate of 69 FPS; but a 3 FPS lead over the GeForce 9800 GTX is not exactly impressive.

With a balanced demand for CPU and GPU power, World in Conflict just begins to place demands on the graphics processor at the 1920x1280 resolution. I was expecting more results along the same line I've seen so far, and that is pretty much exactly what I got.
The performance decay had its hardest impact on the lower high-level video cards: GeForce 9800 GTX and Radeon HD 4850, which for all intents an purposes performed exactly the same throughout our entire WiC testing. Two HD 4850's in CrossFireX configuration will yield a 46% improvement over using only one, while it exceeds the performance of a single Sapphire Radeon HD 4870. The GeForce 9800 GX2 didn't budge a frame as it scaled from 1.31 MP up to 2.3 MP, showing how much raw power this product delivers in the right application. Taking a broader look at the average frame rate, it appears that only the mid-level GeForce 9800 GTX and Sapphire Radeon HD 4850 demonstrate a performance decay as the resolution is raised.
| Product Series | Sapphire Radeon HD 4850 102-B50102-00-AT | FOXCONN GeForce 9800 GTX 9800GTX-512N | Sapphire Radeon HD 4870 102-B50701-10-AT | ZOTAC GeForce GTX 280 AMP! Edition ZT-X28E3LA-FCP | |
| Stream Processors | 800 | 128 | 800 | 128 (x2) | 240 |
| Core Clock (MHz) | 625 | 685 | 750 | 600 (x2) | 700 |
| Shader Clock (MHz) | N/A | 1713 | N/A | 1500 (x2) | 1400 |
| Memory Clock (MHz) | 993 | 1100 | 900 | 1000 (x2) | 1150 |
| Memory Amount | 512 MB GDDR3 | 512 MB GDDR3 |
512 MB GDDR5 |
512MB (x2) GDDR3 | 1024 MB GDDR3 |
| Memory Interface | 256-bit | 256-bit | 256-bit | 256-bit (x2) | 512-bit |
In our next section, we discuss electrical power consumption and learn how well (or poorly) each video card will impact your utility bill...
Radeon 4870 Power Consumption
Life is not as affordable as it used to be, and items such as gasoline, natural gas, and electricity all top the list of resources which have exploded in price over the past few years. Add to this the limit of non-renewable resources compared to current demands, and you can see that the prices are only going to get worse. Planet Earth is needs our help, and needs it badly. With forests becoming barren of vegetation and snow capped poles quickly turning brown, the technology industry has a new attitude towards suddenly becoming "green". I'll spare you the powerful marketing hype that I get from various manufacturers every day, and get right to the point: your computer hasn't been doing much to help save energy... at least up until now.
To measure isolated video card power consumption, Benchmark Reviews uses the Kill-A-Watt EZ (model P4460) power meter made by P3 International. A baseline test is taken without a video card installed inside our computer system, which is allowed to boot into Windows and rest idle at the login screen before power consumption is recorded. Once the baseline reading has been taken, the graphics card is installed and the system is again booted into Windows and left idle at the login screen. Our final loaded power consumption reading is taken with the video card running a stress test using FurMark. Below is a chart with the isolated video card power consumption (not system total) displayed in Watts for each specified test product:
VGA Product Description(sorted by combined total power) |
Idle Power |
Loaded Power |
|---|---|---|
NVIDIA GeForce GTX 480 SLI Set |
82 W |
655 W |
NVIDIA GeForce GTX 590 Reference Design |
53 W |
396 W |
ATI Radeon HD 4870 X2 Reference Design |
100 W |
320 W |
AMD Radeon HD 6990 Reference Design |
46 W |
350 W |
NVIDIA GeForce GTX 295 Reference Design |
74 W |
302 W |
ASUS GeForce GTX 480 Reference Design |
39 W |
315 W |
ATI Radeon HD 5970 Reference Design |
48 W |
299 W |
NVIDIA GeForce GTX 690 Reference Design |
25 W |
321 W |
ATI Radeon HD 4850 CrossFireX Set |
123 W |
210 W |
ATI Radeon HD 4890 Reference Design |
65 W |
268 W |
AMD Radeon HD 7970 Reference Design |
21 W |
311 W |
NVIDIA GeForce GTX 470 Reference Design |
42 W |
278 W |
NVIDIA GeForce GTX 580 Reference Design |
31 W |
246 W |
NVIDIA GeForce GTX 570 Reference Design |
31 W |
241 W |
ATI Radeon HD 5870 Reference Design |
25 W |
240 W |
ATI Radeon HD 6970 Reference Design |
24 W |
233 W |
NVIDIA GeForce GTX 465 Reference Design |
36 W |
219 W |
NVIDIA GeForce GTX 680 Reference Design |
14 W |
243 W |
Sapphire Radeon HD 4850 X2 11139-00-40R |
73 W |
180 W |
NVIDIA GeForce 9800 GX2 Reference Design |
85 W |
186 W |
NVIDIA GeForce GTX 780 Reference Design |
10 W |
275 W |
NVIDIA GeForce GTX 770 Reference Design |
9 W |
256 W |
NVIDIA GeForce GTX 280 Reference Design |
35 W |
225 W |
NVIDIA GeForce GTX 260 (216) Reference Design |
42 W |
203 W |
ATI Radeon HD 4870 Reference Design |
58 W |
166 W |
NVIDIA GeForce GTX 560 Ti Reference Design |
17 W |
199 W |
NVIDIA GeForce GTX 460 Reference Design |
18 W |
167 W |
AMD Radeon HD 6870 Reference Design |
20 W |
162 W |
NVIDIA GeForce GTX 670 Reference Design |
14 W |
167 W |
ATI Radeon HD 5850 Reference Design |
24 W |
157 W |
NVIDIA GeForce GTX 650 Ti BOOST Reference Design |
8 W |
164 W |
AMD Radeon HD 6850 Reference Design |
20 W |
139 W |
NVIDIA GeForce 8800 GT Reference Design |
31 W |
133 W |
ATI Radeon HD 4770 RV740 GDDR5 Reference Design |
37 W |
120 W |
ATI Radeon HD 5770 Reference Design |
16 W |
122 W |
NVIDIA GeForce GTS 450 Reference Design |
22 W |
115 W |
NVIDIA GeForce GTX 650 Ti Reference Design |
12 W |
112 W |
ATI Radeon HD 4670 Reference Design |
9 W |
70 W |
The Sapphire Radeon HD 4870 is no stranger to high power bills based on the fact that it tops our chart for power consumption under load. Even at idle, the Sapphire 100243L gulps the watts down at a faster pace than the GeForce 9800 GX2. Regardless, the power requirements for the Radeon HD 4870 consist of two six-pin PCI-Express power connections to ensure that the RV770 receives enough juice to push out the frames in 3D mode. This may leave some middle-market enthusiasts and lower-end gamers in search of a new power supply force feed the Radeon HD 4870 the power it needs.
Most enthusiasts make the mistake of associating a smaller die process with an improved power efficiency. Clearly, the downside to the 55 nm RV770 GPU is it's lack of energy efficient operation. The power consumption measured under full load doesn't match the performance, but it certainly matched heat output. The idle power draw is extremely high, which is uncommon since emphasis is usually placed on idle/standby mode efficiency and conservation.

Taken as a whole the idle stand-by power consumption is pretty unforgivable, especially since this the condition your equipment will be in the majority of the time. While loaded power consumption is the highest we've ever seen, the price paid to your utility company for gaming would be about the same with just about any other video card. Once upon a time, the computer and gaming consoles seemed like an inexpensive alternative to arcade gaming... but that was before energy costs soared through the roof.
Please continue to the review conclusion in the next section, where I share my final thoughts on the RV770 graphics processor and give my opinion of the new Radeon HD 4800-series product offerings.
Radeon 4800-Series Final Thoughts
There's a lot to like about the new Radeon HD 4800 series of products. To begin with, 800 cores is nothing to scoff at; even if they aren't nearly as efficient as they sound. CrossFireX scales performance very well, and for the first time actually makes multi-card setups worth the money. The most likeable part of the Radeon HD 4870 is that it debuted at under $200, forcing NVIDIA to drop the price of their GeForce 9800 GTX to meet with competition. When ATI launched the Radeon HD 4870 at $300, NVIDIA had to answer back by dropping the GTX 260 to a more affordable price. But that's where everything becomes tricky, and the value of ATI's latest product comes into question.
I'm not entirely sold on everything that the chipmakers would like for us to believe. I think it's sometimes worth questioning the wisdom, and in this regard I find that AMD is trying to pull one over on consumers by describing their RV770 to have 800 scalar processors. The reality is that ATI's 800 stream processor cores do not compare 1:1 against the competition, especially since the GeForce 9800 GTX can outperform the Radeon HF 4850 with only 128 shader cores. So despite what ATI would like to market, scalar processors they are not as they function exactly like vector processors would. With 800 processor cores residing in five bank location, each series of 5 processor cores process only one vector unit at a time - even if that vector doesn't need to use all five processor cores. 800 Cores are there, but they are far from the efficiency level seen by the competition.
My final thoughts on the 4800-series is where the Radeon 4850 and 4870 come up short. They're both great products just so that we're clear, but for a 55 nm process there's a lot missing from the RV770's arsenal that really should be there. I consider efficiency at the very start of this list, and even though my first lesson on the relationship between die process size and energy efficiency came from Mr. Jen-Hsun Huang, President of NVIDIA, I later researched this on my own to discover that he was correct: reduced die process does not equal increased energy efficiency. Obviously this phenomenon holds up very well against the power consumption results I've tested for this review. The next area that I find myself less than impressed is in the memory bus architecture. NVIDIA can produce a 512-bit memory bus for a 1:1 ratio of memory to interface, so it's disappointing that ATI did not do the same for Radeon HD 4850 and 4870 (which uses GDDR5).
But here's why clarifying how the value has become so tricky to define. The initial interest in a product like the Radeon HD 4850 lies in the fact that it competes head-on with the GeForce 9800 GTX. But now that they are both priced the same, value takes on a new dimension. In each and every test I conducted, the Radeon HD 4850 kept up with the GeForce 9800 GTX but never outperformed it (until 4x AA was added to Crysis). This would be the main reason why I see value becoming more of an issue outside of video game performance. The GeForce 9800 GTX offers HDMI, and so does the Radeon HD 4850. Both offer essentially the same exact sub-features down the line, except for when it comes to multi-card configurations; which is where the CrossFireX configuration really comes to shine.
I am very much aware that NVIDIA offers SLI just like ATI offers CrossFireX, but what I'm talking about is multi-card compatibility with motherboards. AMD Didn't exactly impress the world with Phenom, and thus the world hasn't jumped onboard to use their processors. Instead, Intel scooped up a large share of the consumer base with their P35/X38/P45/X48 chipsets (all launched within about ten minutes from each other). But here's my point: ATI still wins. All of these Intel motherboards, along with all of the AMD motherboards, offer CrossFire support exclusively. NVIDIA is left holding their own hand, because only their own chipsets will support SLI.
Sapphire Radeon 4870 Conclusion
Presentation is always the first summary I give in each product review conclusion, but ironically this mundane topic seldom provides the same outcome. Sapphire, who I have pointed out once already is at the top of the sex-sells marketing game for the computer industry, offers us a full spectrum of tastes... er, personalities... for their product characters. Their latest 4800-series is not really so different, but I don't think they'll be showing off full-fledged lingerie models on their product packaging anytime soon. (I double-dare them.)
Judging the product appearance is a little more difficult than I'm used to. Lately, almost everything has been encased in plastic housings with a contoured finish. This doesn't mean that you can't look sharp without the extra plastic body work, but there's a level of protection all of that stuff provides which goes missing on ATI products. Still, Sapphire has done a very good job mixing red hues with carbon fiber decals, making the Radeon HD 4870 look as fast as it actually performs (unlike most Honda's with the same decals).

Construction is solid, but not without some concerns. I absolutely appreciate ATI for not placing memory module IC's on the back side of the PCB, but at the same time I have to hold both ATI and Sapphire accountable for the cooling unit. If you've read any or my video card reviews, you'll know how much I dislike VGA coolers that exhaust back into the computer case. So it's good news for ATI that they pleased me in this regard on their 4870. But even despite their best efforts, the cooling performance is dangerously low. Granted, the RV770 can reach 105°C+ before failure, it's too bad that most nearby components will melt by this point. Additionally, I am no fan of exposed electronic components, such as surface mounted capacitors found on the 4870. These are well known for being easily knocked off of the PCB, resulting in a dead product that could have been protected with an extra ten cents worth of plastic. Aside from these details, the Sapphire Radeon HD 4870 is a solid-built graphics card.
In terms of performance, the Sapphire 100243L Radeon HD 4870 usually performed around 25% better than the Sapphire Radeon HD 4850. During Crysis testing with 4x AA added, the Radeon HD 4870 was able to outperform the GeForce 9800 GX2 by nearly 40%, showing a prevailing strength in high-demand post-processing effects. As a graphics processor, the RV770 performed incredibly well; but as a hardware component I felt that there was a margin of performance lacking from the cooling solution incorporated on the 4870. With an idle temperature hovering around 80°C, the heat is generated during work or rest.
Value is always relative to supply and demand, along with whatever retailers think they can get from the consumer audience at any particular time. As of December 2008, the Sapphire Radeon HD 4870 is being sold at NewEgg for $204.99. I've found a few other sources selling around the same price, so it's a good idea to do some price shopping before you buy. All things considered, I think the Radeon HD 4870 should see a small price reduction after the initial glow of a fresh product launch fades away.
In conclusion, my final recommendation on the Sapphire 100243L Radeon HD 4870 is good but not compelling enough to ignore the options. The Radeon HD 4850 placed into a CrossFireX set often times outperformed the Radeon HD 4870 as a standalone product, making a very good argument for multi-card graphics solutions. On its own accord, the 4870 would occasionally reach the level of performance seen from the GeForce 9800 GTX but never actually outperformed it. Taken into consideration, you have to look at price and sub-feature offerings. It's no surprise that CrossFire and CrossFireX are available on just about every single motherboard that fits an Intel or AMD processor; the same is hardly true for the SLI. So then it's down to price. Since NVIDIA submitted to ATI's price point, both the GTX 260 and Radeon 4870 are now offered around the same cost. At the end of this point, there's really no decisive victory to be handed out. The drivers I tested with were Catalyst 8.6, and couldn't remain stable without an unmentioned Radeon HD 4800 Series Hotfix, but then again Forceware drivers are certainly not without their own problems. The Sapphire Radeon HD 4870 is an outstanding product and just as good as the alternative, so the decision is going to come down to personal preference and available pricing.
Pros:
+ Extremely good AA/AF performance for higher-end games
+ Supports DirectX 10 and Shader Model 4.0
+ 750 MHz GPU / 900 MHz GDDR5 vRAM
+ Features ATI AVIVO Technology
+ 1080p HDMI Audio and Video supported for HDCP output
+ Quiet fan under normal operation
+ Introduces new TeraScale Graphics Engine technology
+ Externally-exhausting cooling solution
+ Supports CrossFireX functionality
+ 24x Custom filter anti-aliasing (CFAA)
+ 5 GBps PCI Express 2.0 graphics interface
+ Kit includes CrossFireX bridge component
Cons:
- Consumes more power than any other product tested
- Maximum post-processing Anti Aliasing is limited to 8x
- Very loud fan noise on random rare occasions
- Fragile electronic components are exposed on PCB
- Extremely high heat output - very hot at idle
Ratings:
-
Presentation: 9.25
-
Appearance: 9.00
-
Construction: 8.75
-
Functionality: 8.75
-
Value: 8.25
Final Score: 8.75 out of 10.
Quality Recognition: Benchmark Reviews Silver Tachometer Award.
Questions? Comments? Benchmark Reviews really wants your feedback. We invite you to leave your remarks in our Discussion Forum.

Comments