| Sapphire Radeon HD 4850 X2 Video Card |
| Reviews - Featured Reviews: Video Cards | ||||||||||||||||||||||||||||||||||||||||||||||||||||||||||||||||||||||||||||||||||||||||||||||||||||||||||||||||||||||||||||||||||||||||||||||||||||||||||||||||||||||||||||||||||||||||||||||||||||||||||||||||||||||||||||||||||||||||||||||||||||||||||||||||||||||||||||||||||||||||||||||||||||||||||||||||||||||||||||||||||||||||||||||||||||||||||||||||||||||||||||||||||||||||||||||||||||||||||||||||||||||||||||||||||||||||||||||||||||||||||||||||||||||||||||||
| Written by Olin Coles | ||||||||||||||||||||||||||||||||||||||||||||||||||||||||||||||||||||||||||||||||||||||||||||||||||||||||||||||||||||||||||||||||||||||||||||||||||||||||||||||||||||||||||||||||||||||||||||||||||||||||||||||||||||||||||||||||||||||||||||||||||||||||||||||||||||||||||||||||||||||||||||||||||||||||||||||||||||||||||||||||||||||||||||||||||||||||||||||||||||||||||||||||||||||||||||||||||||||||||||||||||||||||||||||||||||||||||||||||||||||||||||||||||||||||||||||
| Tuesday, 04 November 2008 | ||||||||||||||||||||||||||||||||||||||||||||||||||||||||||||||||||||||||||||||||||||||||||||||||||||||||||||||||||||||||||||||||||||||||||||||||||||||||||||||||||||||||||||||||||||||||||||||||||||||||||||||||||||||||||||||||||||||||||||||||||||||||||||||||||||||||||||||||||||||||||||||||||||||||||||||||||||||||||||||||||||||||||||||||||||||||||||||||||||||||||||||||||||||||||||||||||||||||||||||||||||||||||||||||||||||||||||||||||||||||||||||||||||||||||||||
Sapphire Radeon HD 4850 X2ATI has learned that being the king of graphics means you must raise the bar for performance with each product release. Sapphire has taken this lesson, and engineered their own Radeon HD 4850 X2 as the latest evolution in graphics cards, and delivers a product nearly as grand as their Radeon HD 4870 X2. Benchmark Reviews has been fortunate to test the Sapphire Radeon HD 4850 X2 Dual-GPU video card 11139-00-40R against a collection of todays hottest video cards available. At some undetermined point in late June of 2008, ATI and AMD each gained ground on the competition in small steps. AMD launched several enthusiast-level processors, lifting them up out of a wild tailspin. Around the same time, ATI launched their Radeon HD 4850video card which competes directly with the GeForce 9800 GTX. Then, after a few on-again off-again launch dates, NVIDIA and ATI did an excellent job of confusing the community with a barrage of product launches. NVIDIA came out swinging with their GeForce GTX 280 and GTX 260 video cards, and ATI retaliated with the Radeon HD 4870 featuring the industries first implementation of GDDR5 video memory. Of course, none of these manufacturers simply released their products and sat on their hands. NVIDIA followed up with the GeForce 9800 GTX+, a 55nm part that would better cope with the now-popular Radeon HD 4850. Sapphire, ATI's most popular partner, answered back with a 'Toxic' version of the 4850 that offered improved performance through factory overclocking and after-market cooling. Not long afterwards, ZOTAC, and NVIDIA AIC (Add-in Card) partner, responded with their GeForce GTX 260²which updated the GPU from 192 to 216 cores. Perhaps it's only natural to have Sapphire get the last word in, with their Radeon HD 4850 X2 video card.
We live in a world where a company that produces the most powerful video card available is usually regarded as the leader in graphics technology. There is a certain amount of truth to this to be fair, but it's not always good to be the king. I imagine NVIDIA has to be getting a little tired of constantly polishing the throne in a lonely palace, especially after their recent launch of the NVIDIA GeForce GTX 280 offered just as much to gamers as it did to multimedia editors. But what happens to everyone else who doesn't have enough gold to buy a piece of the kingdom? The Radeon 4800-series is what happens. Ever since AMD purchased ATI, not only have times been tough for chipmakers, but our national economy has gone down the moat. Adding to the frustration for AMD was a series of flawed product launches and less-than-spectacular performance from those products that actually worked. So when you're living out in the stables with livestock, you learn to make the best of what you have. This is what it appears ATI has done with their latest Radeon HD 4850, and improved upon it by placing two RV770 GPUs on the same printed circuit board for the 4850 X2 graphics card. About the company: Sapphire Technology
|
||||||||||||||||||||||||||||||||||||||||||||||||||||||||||||||||||||||||||||||||||||||||||||||||||||||||||||||||||||||||||||||||||||||||||||||||||||||||||||||||||||||||||||||||||||||||||||||||||||||||||||||||||||||||||||||||||||||||||||||||||||||||||||||||||||||||||||||||||||||||||||||||||||||||||||||||||||||||||||||||||||||||||||||||||||||||||||||||||||||||||||||||||||||||||||||||||||||||||||||||||||||||||||||||||||||||||||||||||||||||||||||||||||||||||||||


 Designed by SAPPHIRE, the new HD 4850 X2 comprises two complete HD 4850 graphics systems on a single PCI-Express card connected by an on-board PCI Express Gen 2 bridge chip. Each GPU has 800 stream process units and a 256-bit memory interface driving 1GB of GDDR3 memory, making a total of 2GB on-board memory. Four Dual Link DVI outputs are provided as well as TV-Out. This provides a choice of Multi-monitor operation or CrossFire mode in which 3D applications such as games use both on-board GPU's together to deliver a single accelerated output on the Primary display. In this mode the SAPPHIRE HD 4850 X2 delivers industry leading levels of performance and achieves previously unavailable frame rates in games even at high resolutions with features enabled.

|
Series |
ATI Radeon HD 4870 | ATI Radeon HD 4850 |
ATI Radeon HD 4850 X2 |
ATI Radeon HD 4870 X2 |
| Stream Processors | 800 | 800 |
800x2 |
800x2 |
| Texture Units | 40 | 40 |
40x2 |
40x2 |
| ROPs | 16 | 16 |
16x2 |
16x2 |
| Core Clock | 750MHz | 625MHz |
625MHz |
750MHz |
| Memory Clock | 900MHz (3600MHz data rate) GDDR5 | 993MHz (1986MHz data rate) GDDR3 |
993MHz (1986MHz data rate) GDDR3 |
900MHz (3600MHz data rate) GDDR5 |
| Memory Bus Width | 256-bit | 256-bit |
2x256-bit |
2x256-bit |
| Frame Buffer | 512MB/1GB | 512MB |
2x1GB |
2x1GB |
| Transistor Count | 956M | 956M |
2x514M |
2x956M |
| Manufacturing Process | TSMC 55nm | TSMC 55nm |
TSMC 55nm |
TSMC 55nm |
Closer Look: Sapphire 4850 X2
The newest edition to the Radeon family takes a whole new approach to component layout and appearance. There's a lot of questions I have when it comes to building a twin-GPU graphics card: how much cooling does it need, and how much power will it consume? These are all things I plan to answer with this article.
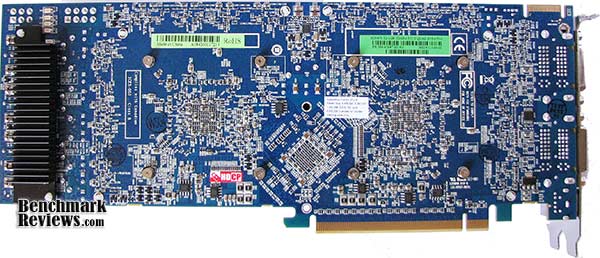
The Sapphire Radeon HD 4850 X2 graphics card (SKU 11139-00-40R) comes in non-ATI themed black and offers a double-slot sized product for the PCI-Express 2.0 bus. There are a few small details that seem to stand out as either interesting or unique, and I'll make sure to discuss each at length. Let's begin with looks.

Sapphire has been (and will likely continue to be) an icon for sex-sells marketing within the VGA industry. Palit has their cyborg-frog, XFX has an armor-clad wolf, and ZOTAC has a fire-breathing dragon; but none match the collection of attractive Ruby characters adorning Sapphire product. Although they have tried to simmer it down in the past few years, I still associate racy characters with their marketing graphics. I suppose that there's nothing wrong with an animated cute she-warrior looking out at you from the decals and retail packages Sapphire exposes them on, because after all this is a geeks industry. On the Radeon HD 4850 X2 Sapphire offers up a cute female character on the package, but nothing but logo on the graphics card.
All Sapphire graphics cards in the HD 4000 series incorporate the latest ATI Avivo HD Technology for enhanced video display and feature a second generation built in UVD (Unified Video decoder) for the hardware accelerated decoding of Blu-ray and HD DVD content for both VC-1 and H.264 codecs, as well as Mpeg files, considerably reducing CPU loading. The dedicated HDMI adaptor connects to any one of four DVI ports and has 7.1 surround sound support while delivering audio and video output on a single cable for direct connection to an HDMI ready display. The Sapphire 11139-00-40R offers a total of four DVI ports, but unfortunately there is no support for the up-and-coming DisplayPort interface or native HDMI.

Sapphire utilizes a full-length cooling unit to keep the dual-RV770 GPUs within operating specifications. While it obviously seems to be working, I am curious how ATI avoided a total meltdown considering how hot a single Sapphire Radeon HD 4850can get. The twin cooling fans are located directly above the GPUs, and pushes air to both ends of the cooler. While the majority of heat produced by the twin GPUs is exhausted out the rear near the power connections, some residual heat is expelled from holes in the sides of the heatsink shroud.
While I am a huge fan of externally-exhausting VGA coolers such as the one used on the reference Radeon HD 4870, I wasn't at all pleased with the exposed electronics that were inherent of the stock cooling package. On the other hand, I am also less enthusiastic about internally exhausting coolers which heat internal hardware, even if they do protect the components.

The cooling unit on the Sapphire Radeon HD 4850 X2 video card is held tight to the dual-RV770 GPUs with the use of several screws. The double-height cooler does a very good job of cooling the 4850 X2, but there is still a tremendous amount of heat that builds up on the PCB. If you're an overclocker, there isn't very much that can be done to help cool the unit from the reverse side of the circuit board, especially since there are no surface-mounted GDDR3 modules on this side of the Radeon HD 4850 X2. Sapphire does include a passive heatsink near the power regulation components, however.
Sapphire's unique double-size active cooling solution is good, but it's not perfect. The twin RV770 GPUs are clocked at 625 MHz on Radeon HD 4850 X2, and the heat output is directly related. At idle, the Sapphire Radeon HD 4850 recorded a cool 43°C, which is identical to the Sapphire Radeon HD 4870 Toxic video card we recently tested. However, while that Toxic 4870 creeped to only 62°C under load, the Sapphire Radeon HD 4850 X2 climbed to a scorching 83°C with an ambient room temperature of 20°C. Still, this is much better than the 93°C posted by the Sapphire Radeon HD 4870 X2 100251SR.
In our next section we detail our methodology for testing video cards. Following this we offer a cadre of benchmarks to show where the Sapphire Radeon HD 4850 X2 stands against the Radeon 4870, a pair of Radeon HD 4850's in CrossFire, the Radeon HD 4850 X2, and a GTX 260 and GTX 280 put in for good measure... so please read on!
Video Card Testing Methodology
At the start of all tests, the previous display adapter driver is uninstalled and trace components are removed using Driver Cleaner Pro.We then restart the computer system to establish our display settings and define the monitor. Once the hardware is prepared, we begin our testing. The synthetic benchmark tests in 3DMark06 will utilize shader models 2.0 and 3.0. In our higher-end VGA products we conduct tests at the following resolutions: 1280x1024 (19" Standard LCD), 1680x1050 (22-24" Widescreen LCD), and 1920x1200 (24-28" Widescreen LCD). In some tests we utilized widescreen monitor resolutions, since more users are beginning to feature these products for their own computing.
Each benchmark test program begins after a system restart, and the very first result for every test will be ignored since it often only caches the test. This process proved extremely important in the World in Conflict and Supreme Commander benchmarks, as the first run served to cache maps allowing subsequent tests to perform much better than the first. Each test is completed five times, with the average results displayed in our article.
Our site polls and statistics indicate that the over 90% of our visitors use their PC for playing video games, and practically every one of you are using a screen resolutions mentioned above. Since all of the benchmarks we use for testing represent different game engine technology and graphic rendering processes, I feel that this battery of tests will provide a diverse range of results for you to gauge performance on your own computer system. Since most gamers and enthusiasts are still using Windows XP, it was decided that DirectX 9 would be used for all tests until demand and software support improve for Windows Vista.
Test System
- Motherboard: Gigabyte GA-X48T-DQ6(Intel X48 Chipset) with version F6a BIOS
- Processor: Intel E8400 Core 2 Duo 3.0 GHz (Overclocked to 3.6 GHz)
- System Memory: Corsair PC3-14400 DDR3 1800MHz
- Audio: HT Omega Claro Plus+ AD8620BR Op Amp Sound Card
- Disk Drive: Mtron Pro 7500 32GB SATA-II SSD MSP-SATA7525
- Optical Drive: ASUS BC-1205PT SATA Blu-ray Disc Optical Drive
- Enclosure: Lian Li PC-B25B Black Aluminum Mid-Tower ATX Case
- PSU: ePower Technology EP-1200P10 xScale 1200W PSU
- Monitor: SOYO 26-Inch Widescreen LCD Monitor DYLM26E6
- Operating System: Windows XP Professional SP-3 (optimized to 16 processes at idle)
Benchmark Applications
-
3DMark06 v1.1.0 (8x Anti Aliasing & 16x Anisotropic Filtering)
-
Call of Duty 4: Modern Warfare v1.7.568 (4x AA/16x Trilinear AF)
-
Crysis v1.21 Benchmark (High Settings, 0x and 4x Anti-Aliasing)
-
World in Conflict v1.0.0.9 Performance Test (Very High Setting: 4x AA/4x AF)
Video Card Test Products
| Product Series | Sapphire Radeon HD 4850 102-B50102-00-AT | Sapphire Radeon HD 4870 102-B50701-10-AT | Sapphire Radeon HD 4850 X2 11139-00-40R |
XFX GeForce GeForce GTX 260 GX-260N-ADDU |
ZOTAC GeForce GTX 280 AMP! Edition ZT-X28E3LA-FCP | Sapphire Radeon HD 4870 X2 100251SR |
| Stream Processors | 800 | 800 | 1600 (800x2) | 192 | 240 | 1600 (800x2) |
| Core Clock (MHz) | 625 | 750 | 775 | 164 | 700 | 750 |
| Shader Clock (MHz) | N/A | N/A | N/A | 1242 | 1400 | N/A |
| Memory Clock (MHz) | 993 | 900 | 900 | 1150 | 1150 | 900 |
| Memory Amount | 512 MB GDDR3 | 512 MB GDDR5 |
512 MB GDDR5 |
896 MB GDDR3 | 1024 MB GDDR3 | 2048 MB GDDR5 |
| Memory Interface | 256-bit | 256-bit | 256-bit | 448-bit | 512-bit | 256-bit |
- Sapphire Radeon HD 4850 102-B50102-00-AT (Catalyst 8.10)
- ZOTAC GeForce 9800 GTX+ ZT-98PES2P-WSP(Forceware v178.13)
- Sapphire Radeon HD 4850 X2 11139-00-40R (Catalyst 8.542 RC1)
- XFX GeForce GTX 260 GX-260N-ADDU (Forceware v178.13)
- ZOTAC GeForce GTX 280 AMP! Edition ZT-X28E3LA-FCP(Forceware v178.13)
- Sapphire Radeon HD 4870 X2 100251SR (Catalyst 8.10)
Now we're ready to begin testing video game performance on the Sapphire Radeon HD 4850 X2, so please continue to the next page as we start with the 3DMark06 results.
3DMark06 Benchmark Results
3DMark is a computer benchmark by Futuremark (formerly named Mad Onion) to determine the DirectX 9 performance of 3D game performance with graphics cards. 3DMark06 uses advanced real-time 3D game workloads to measure PC performance using a suite of DirectX 9 3D graphics tests, CPU tests, and 3D feature tests.
3DMark06 tests include all new HDR/SM3.0 graphics tests, SM2.0 graphics tests, AI and physics driven single and multiple cores or processor CPU tests and a collection of comprehensive feature tests to reliably measure next generation gaming performance today. Some enthusiasts may note that Benchmark Reviews does not include CPU-bound tests in our benchmark battery, and that only graphic-bound tests are included.
Here at Benchmark Reviews, we believe that synthetic benchmark tools are just as valuable as video games, but only so long as you're comparing apples to apples. Since the same test is applied in the same controlled method with each test run, I believe 3DMark is a very reliable tool for comparing graphic cards against one-another.
More visitors to Benchmark Reviews operate at 1280x1024 resolution than any other, as it represents the native resolution of 19" LCD monitors. Using this resolution as a starting point, the maximum settings were applied to 3dMark06 which for these tests include 8x Anti-Aliasing and 16x Anisotropic Filtering. Low-resolution testing allows the graphics processor to plateau maximum output performance, which thereby shifts demand onto the system components to keep up. At the lower resolutions 3DMark will reflect the GPU's top-end speed in the composite score, indicating full-throttle performance with little load. This makes for a less GPU-dependant test environment, and is helpful in measuring the maximum output performance in the test results.
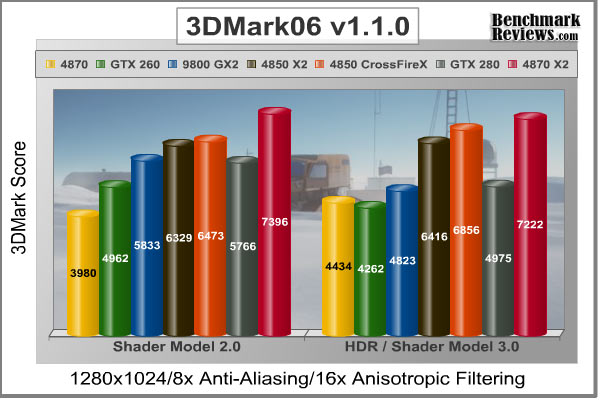
Right away our test results indicate that 3dMark06 benchmarks really like the CrossFireX pair of Sapphire Radeon HD 4850video cards. But because of the added overhead of combined graphics processors and video frame buffer memory, the light load created by the shader model 2.0 tests have a relatively negative impact on the CrossFireX score. Another way of describing this phenomenon is comparing the combined Radeon HD 4850 video cards to a race car that has only high gears available in the transmission: it will have a faster top-end speed, but it will take longer to get there.
In the SM 2.0 tests the Sapphire Radeon HD 4850 X2 keeps well ahead of the Radeon HD 4870, but only marginally ahead of the GeForce GTX 280 and barely ahead of the 9800 GX2at this resolution. However, moving into the more advanced HDR tests the Radeon HD 4850 X2 produces a much more decisive lead over everything except the CrossFireX set of Radeon HD 4850's and 4870 X2.
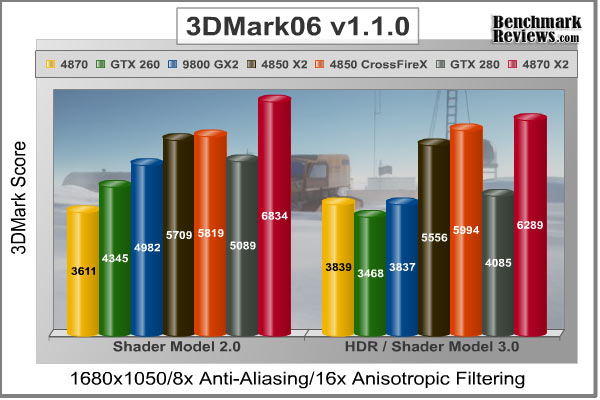
At the widescreen resolution of 1680x1050, the scores are practically identical in terms of ratio to all of our previous tests. The shader model 2.0 tests put the CrossFireX set right at the performance level of the Radeon HD 4850 X2, at least until they reach the shader model 3.0 tests where everything is split up. Twin Sapphire Radeon HD 4850 video cards in a CrossFireX manage to run circles around the competition in this 3dMark06 benchmark, beating the Sapphire 4850 X2 by a small margin and nearly matching the Sapphire Radeon HD 4870 X2 100251SR. which really makes an argument for inexpensive multi-card performance setup.
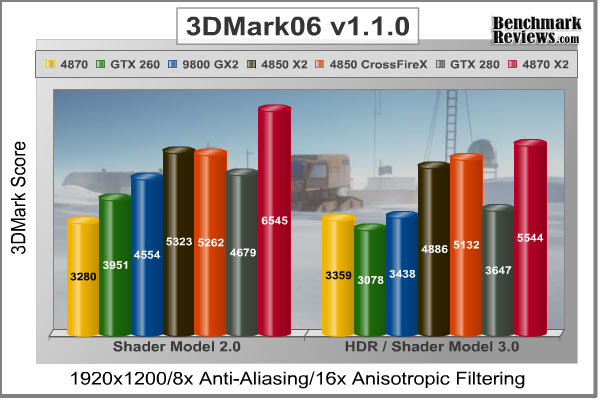
Finishing up the SM 2.0 series of synthetic benchmark tests under heavy load, the Radeon HD 4850 X2 finally nudges out the CrossFireX set of 4850's and easily beats out the AMP!'ed GTX 280. However, the Radeon HD 4870 X2 dominates over the entire field now and again in the more demanding shader model 3.0 tests. In the SM 3.0 tests we see that the CrossFireX set takes back its lead from the 4850 X2, but both products are still a long distance ahead of the GeForce GTX 280.
Two things were made very clear with the 3dMark06 benchmark tests: NVIDIA isn't winning the fight, and the Sapphire Radeon HD 4870 X2 is so far ahead of any other video card that it redefines the high-end of graphics performance. Sapphire's Radeon HD 4850 X2 appears to settle at an equal performance to the CrossFireX 4850's and slightly behind the dual-GPU 4870 X2 in most tests thus far.
| Product Series | Sapphire Radeon HD 4850 102-B50102-00-AT | Sapphire Radeon HD 4870 102-B50701-10-AT | Sapphire Radeon HD 4850 X2 11139-00-40R |
XFX GeForce GeForce GTX 260 GX-260N-ADDU |
ZOTAC GeForce GTX 280 AMP! Edition ZT-X28E3LA-FCP | Sapphire Radeon HD 4870 X2 100251SR |
| Stream Processors | 800 | 800 | 1600 (800x2) | 192 | 240 | 1600 (800x2) |
| Core Clock (MHz) | 625 | 750 | 775 | 164 | 700 | 750 |
| Shader Clock (MHz) | N/A | N/A | N/A | 1242 | 1400 | N/A |
| Memory Clock (MHz) | 993 | 900 | 900 | 1150 | 1150 | 900 |
| Memory Amount | 512 MB GDDR3 | 512 MB GDDR5 |
512 MB GDDR5 |
896 MB GDDR3 | 1024 MB GDDR3 | 2048 MB GDDR5 |
| Memory Interface | 256-bit | 256-bit | 256-bit | 448-bit | 512-bit | 256-bit |
Take the 3DMark06 tests at face value, because in our next section we begin real-world testing on a cadre of popular video games known for taxing the graphics processor, and the performance curve is expected change. Our first up is Call of Duty 4, so please continue on...
Call of Duty 4 Benchmark Results
Call of Duty 4: Modern Warfare runs on a proprietary game engine that Infinity Ward based off of the tried-and-true Q3 structure. This engine offers features such as true world-dynamic lighting, HDR lighting effects, dynamic shadows and depth of field. "Bullet Penetration" is calculated by the Infinity Ward COD4 game engine, taking into account things such as surface type and entity thickness. Certain objects, such as cars, and some buildings are destructible. This makes distinguishing cover from concealment important, as the meager protection provided by things such as wooden fences and thin walls does not fully shield players from harm as it does in many other games released during the same time period. Bullet speed and stopping power are decreased after penetrating an object, and this decrease is calculated realistically depending on the thickness and surface of the object penetrated.
This version of the game also makes use of a dynamic physics engine, a feature which was not implemented in previous Call of Duty titles for Windows PC's. The new in-game death animations are a combination of pre-set static animations combined with ragdoll physics. Infinity Ward's use of the well-debugged Quake 3 engine along with new dynamic physics implementation allows Call of Duty 4 to be playable by a wide range of computer hardware systems. The performance may be scaled for low-end graphic cards up to 4x Anti-Aliasing and 16x Tri-linear anisotropic texture filtering.
Before I discuss the results, I would like to take a moment to mention my general opinion on Fraps software when it comes to game performance benchmarking. If you're not familiar with the software, Fraps (derived from Frames per second) is a benchmarking, screen capture, and real-time video capture utility for DirectX and OpenGL applications. Some reviewers use this software to measure video game performance on their Windows system, as well as record gaming footage. My opinion is that it offers a valid third-party non-bias alternative to in-game benchmarking tools; but there is one caveat: it's not perfect. Because the user must manually begin the test, the starting point may vary from position to position and therefore skew the results.
In my testing with Fraps v2.9.4 build 7039, I used the cut-scene intro to the coup d'etat scene when Al Asad takes over control. First I allowed the level to load and let the scene begin for a few moments, then I would use the escape key to bring up the menu. Once I selected the restart level option, I would immediately press F11 to begin recording the benchmark data. This scene is nearly four minutes long, but I configured Fraps to record the first 180 seconds of it to remain consistent. Once the scene would end, I would repeat the restart process for a total of five tests. So within a 0.2 second starting point margin, all benchmark results are comparable which is probably as good as it can possibly get with this tool.

In our frame rate results, all five of the collected test scores were within 0.5 FPS of one-another and then averaged for the chart you see above. Call of Duty 4 showed some small degree of difference in graphics performance at the lower resolution of 1280x1024, but it tapered out thereafter for both the 1680x1050 and 1920x1200 resolutions.
Once the tests had been repeated and the results recorded, It was clear that the RV770 was a superior graphics processor when compared to the GT92 GPU, which is to be expected. At the lower resolutions the Radeon HD 4870 was tied with the GeForce GTX 260 and able to close the gap and get within range of the GeForce GTX 280 AMP! Edition. By the end of our benchmark tests the GeForce 9800 GX2 performed at the same level as the highly-overclocked GTX 280, and both fell slightly behind the Radeon HD 4850 X2. The CrossFireX set of Sapphire Radeon HD 4850's was not included in this test.
There were three distinct groups of results: the lower high-end consisting of the Sapphire Radeon HD 4870and XFX GeForce GTX 260, the mid high-end consisting of the GeForce 9800 GX2, Sapphire Radeon HD 4850 X2, and ZOTAC GeForce GTX 280 AMP! Edition, with the Sapphire Radeon HD 4870 X2 100251SRoccupying the upper high-end. Call of Duty 4 put a reasonable amount of strain on the Radeon HD 4870 and GeForce GTX 260 video cards, but they both did very well for themselves during our tests.
By the end of our testing, The 4870 X2 held a large lead of the pack with 122 FPS, while the Sapphire 4850 X2 took second with 100 FPS, followed by the GTX 280 with 98 FPS and GeForce 9800 GX2 with 96. Since the maximum anti-aliasing available in COD4 is 4x, there won't be any problem with the Radeon 4800-series limit of 8x AA.
| Product Series | Sapphire Radeon HD 4850 102-B50102-00-AT | Sapphire Radeon HD 4870 102-B50701-10-AT | Sapphire Radeon HD 4850 X2 11139-00-40R |
XFX GeForce GeForce GTX 260 GX-260N-ADDU |
ZOTAC GeForce GTX 280 AMP! Edition ZT-X28E3LA-FCP | Sapphire Radeon HD 4870 X2 100251SR |
| Stream Processors | 800 | 800 | 1600 (800x2) | 192 | 240 | 1600 (800x2) |
| Core Clock (MHz) | 625 | 750 | 775 | 164 | 700 | 750 |
| Shader Clock (MHz) | N/A | N/A | N/A | 1242 | 1400 | N/A |
| Memory Clock (MHz) | 993 | 900 | 900 | 1150 | 1150 | 900 |
| Memory Amount | 512 MB GDDR3 | 512 MB GDDR5 |
512 MB GDDR5 |
896 MB GDDR3 | 1024 MB GDDR3 | 2048 MB GDDR5 |
| Memory Interface | 256-bit | 256-bit | 256-bit | 448-bit | 512-bit | 256-bit |
In our next section, we shall see if the performance-demanding video game Crysis will help strengthen this position.
Crysis Benchmark Results
Crysisuses a new graphics engine: the CryENGINE2, which is the successor to Far Cry's CryENGINE. CryENGINE2 is among the first engines to use the Direct3D 10 (DirectX10) framework of Windows Vista, but can also run using DirectX9, both on Vista and Windows XP.
Roy Taylor, Vice President of Content Relations at NVIDIA, has spoken on the subject of the engine's complexity, stating that Crysis has over a million lines of code, 1GB of texture data, and 85,000 shaders. To get the most out of modern multicore processor architectures, CPU intensive subsystems of CryENGINE 2 such as physics, networking and sound, have been re-written to support multi-threading.
Crysis offers an in-game benchmark tool, which is similar to World in Conflict. This short test does place some high amounts of stress on a graphics card, since there are so many landscape features rendered. For benchmarking purposes, Crysis can mean trouble as it places a high demand on both GPU and CPU resources. Benchmark Reviews uses the Crysis Benchmark Tool by Mad Boris to test frame rates in batches, which allows the results of many tests to be averaged.
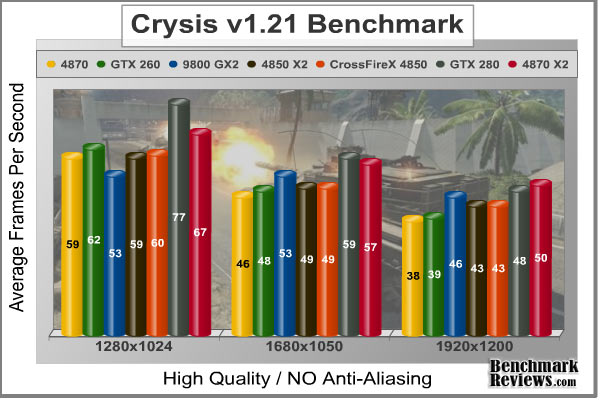
Low-resolution testing allows the graphics processor to plateau its maximum output performance, which thereby shifts demand onto the other system components. At the lower resolutions Crysis will reflect the GPU's top-end speed in the composite score, indicating full-throttle performance with little load. This makes for a less GPU-dependant test environment, and is helpful in creating a baseline for measuring maximum output performance in the next few test results. At the 1280x1024 resolution used by some newer 17" and most 19" monitors, all of the video cards tested performed at very respectable levels.
Without AA enabled, the performance was wide and varied until you get to 1920x1200 resolution. At this point, the video performance pushed many products to their lowest limits. The Sapphire Radeon HD 4870 X2 held a small lead of 50 FPS over the overclocked ZOTAC GeForce GTX 280 AMP! Edition's 48 FPS. Next in line with the GeForce 9800 GX2 believe it or not, with a respectable 46 FPS. Both the CrossFireX Sapphire Radeon HD 4850's and Sapphire 4850 X2 held onto a 43 FPS tie for fourth place, while the Radeon 4870 and GeForce GTX 260 were virtually tied for fifth place with 38 and 39 FPS respectively.
Things look a lot different when you add 4x anti-aliasing to the collection of video cards. At 1920x1200 the GTX 280 takes a decisive lead with 38.4 FPS over the Radeon HD 4870 X2 which scored 33.7. Not far behind was the GeForce GTX 260, which seized third place with 31.5 FPS. The 4850 X2 managed 27.7 FPS to the CrossFireX sets 26.0. The Radeon HD 4870 squeezed out a meager 24.8 FPS, while the often discounted GeForce 9800 GX2 had a difficult time with AA and forced itself to produce 20.2 FPS.
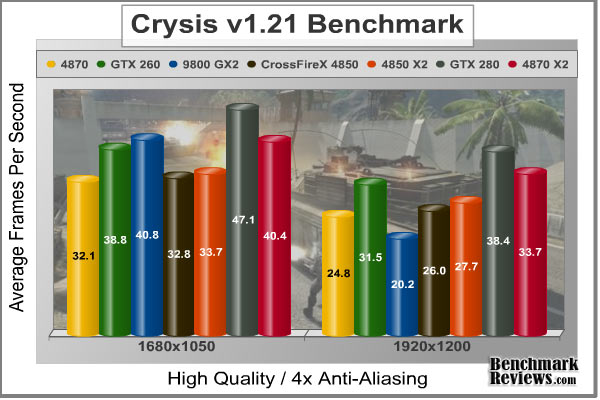
With only a small dose of anti-aliasing added to Crysis, there are very few products that would make for playable frame rates. Our Island timedemo mixes a some beach and water views so it's going to be on the high side of frame rates when compared to actual game play, but as you can see the Radeon products do extremely well when post-processing effects are added.
| Product Series | Sapphire Radeon HD 4850 102-B50102-00-AT | Sapphire Radeon HD 4870 102-B50701-10-AT | Sapphire Radeon HD 4850 X2 11139-00-40R |
XFX GeForce GeForce GTX 260 GX-260N-ADDU |
ZOTAC GeForce GTX 280 AMP! Edition ZT-X28E3LA-FCP | Sapphire Radeon HD 4870 X2 100251SR |
| Stream Processors | 800 | 800 | 1600 (800x2) | 192 | 240 | 1600 (800x2) |
| Core Clock (MHz) | 625 | 750 | 775 | 164 | 700 | 750 |
| Shader Clock (MHz) | N/A | N/A | N/A | 1242 | 1400 | N/A |
| Memory Clock (MHz) | 993 | 900 | 900 | 1150 | 1150 | 900 |
| Memory Amount | 512 MB GDDR3 | 512 MB GDDR5 |
512 MB GDDR5 |
896 MB GDDR3 | 1024 MB GDDR3 | 2048 MB GDDR5 |
| Memory Interface | 256-bit | 256-bit | 256-bit | 448-bit | 512-bit | 256-bit |
In our next section, Benchmark Reviews tests the less demanding Unreal Tournament 3 with our collection of video card. Read on to see how a blended medium-demand GPU test with low video frame buffer demand will impact our test products.
Unreal Tournament 3
Unreal Tournament 3 (UT3) is a first-person shooter and online multiplayer video game by Epic Games and is the next installment of the Unreal series after Unreal Tournament 2004. It is published by Midway Games and was released in North America for Windows on November 19, 2007.
Unreal Tournament 3 is actually the fourth game in the Unreal Tournament series and the eighth Unreal game, but it has been numbered in terms of the engine it runs on. UT3 is subsequently part of the third generation, because it runs on the Unreal Engine 3, and does not reuse any content from previous versions.
Since Unreal Tournament 3 was designed as a DirectX 9 video game with no current support expected for DirectX 10, we use Windows XP Pro (Service Pack 3) for our benchmark testing. After completing tests on a wide range of products with settings at their highest, it appeared that Unreal Tournament 3 really didn't stress the video cards nearly as much as I would have liked.
Beginning at the low resolution of 1280x1024, the benchmark scores are so close (and suspiciously high) for our collection of products that it might be time to eliminate this game from our testing process. Nevertheless, it looks like the Unreal Engine 3 game engine doesn't care too much for the ATI-based video cards. Even the CrossFireX set was just barely able to keep pace with the others that it surpassed in previous tests. With all High Quality settings and tweaks enabled along with 16x anisotropic filtering, Unreal Tournament 3 doesn't add strain to any of the graphics cards tested like Crysis did.

When I tested the Honeywell HWLM2216recently, I noticed how the 1680x1050 widescreen display resolution of this 22" LCD monitor offered very little strain over a 19" standard display LCD monitor. Comparatively, 1680x1050 produces 1.76 MP and 1280x1024 produces 1.31, so there's only a very small difference expected between performance levels. The biggest difference is in the user experience, because the widescreen monitor comes in very handy for watching multimedia video or playing large world-scape video games. At 1680x1050 resolution, the differences were beginning to show, but only 1920x1200 will be useful for illustrating how each product performs. Producing 2.3 MP with a 1920x1280 resolution on our 26" SOYO DYLM26E6 test monitor, each product is now separated far enough apart to sort out the winners and losers.
The ZOTAC GeForce GTX 280 AMP! Edition keeps the lead position with 151 FPS, but directly behind it is the now-discount GeForce 9800 GX2 with 149 FPS. The next closest competitor was the Radeon HD 4870 X2 with only 138 FPS between its two GPUs, with the GTX 260 right behind it with 134 FPS. The Sapphire Radeon HD 4850 X2 wasn't able to match the pace of a CrossFireX set in UT3, as both scored barely ahead of a single Sapphire Radeon HD 4870.
Unreal Tournament 3 appears to provide a very minimal load on the high-end video cards we're testing. Thankfully there are several new games arriving to market late into 2008, so with some luck this benchmark will only be used for low-end graphics comparison into the future.
| Product Series | Sapphire Radeon HD 4850 102-B50102-00-AT | Sapphire Radeon HD 4870 102-B50701-10-AT | Sapphire Radeon HD 4850 X2 11139-00-40R |
XFX GeForce GeForce GTX 260 GX-260N-ADDU |
ZOTAC GeForce GTX 280 AMP! Edition ZT-X28E3LA-FCP | Sapphire Radeon HD 4870 X2 100251SR |
| Stream Processors | 800 | 800 | 1600 (800x2) | 192 | 240 | 1600 (800x2) |
| Core Clock (MHz) | 625 | 750 | 775 | 164 | 700 | 750 |
| Shader Clock (MHz) | N/A | N/A | N/A | 1242 | 1400 | N/A |
| Memory Clock (MHz) | 993 | 900 | 900 | 1150 | 1150 | 900 |
| Memory Amount | 512 MB GDDR3 | 512 MB GDDR5 |
512 MB GDDR5 |
896 MB GDDR3 | 1024 MB GDDR3 | 2048 MB GDDR5 |
| Memory Interface | 256-bit | 256-bit | 256-bit | 448-bit | 512-bit | 256-bit |
Our last benchmark of the article is coming next, which puts our collection of video cards against some very demanding graphics.
World in Conflict Benchmark Results
The latest version of Massive's proprietary Masstech engine utilizes DX10 technology and features advanced lighting and physics effects, and allows for a full 360 degree range of camera control. Massive's MassTech engine scales down to accommodate a wide range of PC specifications, if you've played a modern PC game within the last two years, you'll be able to play World in Conflict.
World in Conflict's FPS-like control scheme and 360-degree camera make its action-strategy game play accessible to strategy fans and fans of other genres... if you love strategy, you'll love World in Conflict. If you've never played strategy, World in Conflict is the strategy game to try.
Based on the test results charted below it's clear that WiC doesn't place a limit on the maximum frame rate (to prevent a waste of power) which is good for full-spectrum benchmarks like ours, but bad for electricity bills. The average frame rate is shown for each resolution in the chart below. World in Conflict just begins to place demands on the graphics processor at the 1920x1280 resolution, so we'll jump ahead for our concensus.

To my complete surprise, the GeForce 9800 GX2 scored the best FPS performance with 64, compared to the next best of 61 from the GTX 280. Directly behind was the dual-RV770 Radeon HD 4870 X2 with a 59 FPS performance nearly matched by the CrossFireX set of 57 FPS. Sapphire's 4850 X2 held just barely ahead of the GTX 260, which scored 54 and 53 FPS respectively. The Radeon HD 4870 finsihed our set with a very good 48 FPS performance.
| Product Series | Sapphire Radeon HD 4850 102-B50102-00-AT | Sapphire Radeon HD 4870 102-B50701-10-AT | Sapphire Radeon HD 4850 X2 11139-00-40R |
XFX GeForce GeForce GTX 260 GX-260N-ADDU |
ZOTAC GeForce GTX 280 AMP! Edition ZT-X28E3LA-FCP | Sapphire Radeon HD 4870 X2 100251SR |
| Stream Processors | 800 | 800 | 1600 (800x2) | 192 | 240 | 1600 (800x2) |
| Core Clock (MHz) | 625 | 750 | 775 | 164 | 700 | 750 |
| Shader Clock (MHz) | N/A | N/A | N/A | 1242 | 1400 | N/A |
| Memory Clock (MHz) | 993 | 900 | 900 | 1150 | 1150 | 900 |
| Memory Amount | 512 MB GDDR3 | 512 MB GDDR5 |
512 MB GDDR5 |
896 MB GDDR3 | 1024 MB GDDR3 | 2048 MB GDDR5 |
| Memory Interface | 256-bit | 256-bit | 256-bit | 448-bit | 512-bit | 256-bit |
In our next section, we discuss electrical power consumption and learn how well (or poorly) each video card will impact your utility bill...
4850 X2 Power Consumption
EDITORS NOTE 11/20/2008: The Power consumption results for this product are being re-tested. Due to unfortunate circumstances, the Kill A Watt EZ provided to Benchmark Reviews by P3 International has been determined to be defective and inconsistent. We apologize for any confusion this has caused to our visitors.
Life is not as affordable as it used to be, and items such as gasoline, natural gas, and electricity all top the list of resources which have exploded in price over the past few years. Add to this the limit of non-renewable resources compared to current demands, and you can see that the prices are only going to get worse. Planet Earth is needs our help, and needs it badly. With forests becoming barren of vegetation and snow capped poles quickly turning brown, the technology industry has a new attitude towards suddenly becoming "green". I'll spare you the powerful marketing hype that I get from various manufacturers every day, and get right to the point: your computer hasn't been doing much to help save energy... at least up until now.
To measure isolated video card power consumption, Benchmark Reviews uses the Kill-A-Watt EZ (model P4460) power meter made by P3 International. A baseline test is taken without a video card installed inside our computer system, which is allowed to boot into Windows and rest idle at the login screen before power consumption is recorded. Once the baseline reading has been taken, the graphics card is installed and the system is again booted into Windows and left idle at the login screen. Our final loaded power consumption reading is taken with the video card running a stress test using FurMark. Below is a chart with the isolated video card power consumption (not system total) displayed in Watts for each specified test product:
VGA Product Description(sorted by combined total power) |
Idle Power |
Loaded Power |
|---|---|---|
NVIDIA GeForce GTX 480 SLI Set |
82 W |
655 W |
NVIDIA GeForce GTX 590 Reference Design |
53 W |
396 W |
ATI Radeon HD 4870 X2 Reference Design |
100 W |
320 W |
AMD Radeon HD 6990 Reference Design |
46 W |
350 W |
NVIDIA GeForce GTX 295 Reference Design |
74 W |
302 W |
ASUS GeForce GTX 480 Reference Design |
39 W |
315 W |
ATI Radeon HD 5970 Reference Design |
48 W |
299 W |
NVIDIA GeForce GTX 690 Reference Design |
25 W |
321 W |
ATI Radeon HD 4850 CrossFireX Set |
123 W |
210 W |
ATI Radeon HD 4890 Reference Design |
65 W |
268 W |
AMD Radeon HD 7970 Reference Design |
21 W |
311 W |
NVIDIA GeForce GTX 470 Reference Design |
42 W |
278 W |
NVIDIA GeForce GTX 580 Reference Design |
31 W |
246 W |
NVIDIA GeForce GTX 570 Reference Design |
31 W |
241 W |
ATI Radeon HD 5870 Reference Design |
25 W |
240 W |
ATI Radeon HD 6970 Reference Design |
24 W |
233 W |
NVIDIA GeForce GTX 465 Reference Design |
36 W |
219 W |
NVIDIA GeForce GTX 680 Reference Design |
14 W |
243 W |
Sapphire Radeon HD 4850 X2 11139-00-40R |
73 W |
180 W |
NVIDIA GeForce 9800 GX2 Reference Design |
85 W |
186 W |
NVIDIA GeForce GTX 780 Reference Design |
10 W |
275 W |
NVIDIA GeForce GTX 770 Reference Design |
9 W |
256 W |
NVIDIA GeForce GTX 280 Reference Design |
35 W |
225 W |
NVIDIA GeForce GTX 260 (216) Reference Design |
42 W |
203 W |
ATI Radeon HD 4870 Reference Design |
58 W |
166 W |
NVIDIA GeForce GTX 560 Ti Reference Design |
17 W |
199 W |
NVIDIA GeForce GTX 460 Reference Design |
18 W |
167 W |
AMD Radeon HD 6870 Reference Design |
20 W |
162 W |
NVIDIA GeForce GTX 670 Reference Design |
14 W |
167 W |
ATI Radeon HD 5850 Reference Design |
24 W |
157 W |
NVIDIA GeForce GTX 650 Ti BOOST Reference Design |
8 W |
164 W |
AMD Radeon HD 6850 Reference Design |
20 W |
139 W |
NVIDIA GeForce 8800 GT Reference Design |
31 W |
133 W |
ATI Radeon HD 4770 RV740 GDDR5 Reference Design |
37 W |
120 W |
ATI Radeon HD 5770 Reference Design |
16 W |
122 W |
NVIDIA GeForce GTS 450 Reference Design |
22 W |
115 W |
NVIDIA GeForce GTX 650 Ti Reference Design |
12 W |
112 W |
ATI Radeon HD 4670 Reference Design |
9 W |
70 W |
When I first tested (and published) this article, I wasn't certain that my results were accurate because of a very low power draw reading. After a full week of testing and re-testing, I can now be certain that my results were accurate all along. To my surprise, the Sapphire Radeon HD 4850 X2 exhibited such a low consumption at idle that it actually measured slightly less than a single Radeon HD 4850. But that's not the real news, because once I confirmed the results of my testing under full load this product stepped out and demanded my attention. At a mere 160W of VGA power consumption under load, the Sapphire Radeon HD 4850 X2 actually consumes 10W less power than the GeForce 9800 GX2. This might not mean anything to you yet, but consider this: it also consumes 83W less power than a single Radeon 4870, and a full 160W less than the 4870 X2 under load. That's very impressive energy efficiency in my book, and something that Sapphire should be quite proud of.

If enough power is supplied to the Sapphire 11139-00-40, a green LED glows from near the underside PCB heatsink. Without proper power, red LEDs glow to indicate a problem.
Keeping in mind that the Radeon HD 4850 X2 is NOT an AMD/ATI product, there's a lot to consider when you look at the phased power circuitry. Sapphire may have used a pair of ATI RV770 GPUs in their 4850 X2, but that's the end of the common parts list. Benchmark Reviews is still awaiting Sapphires official statement on the specifics of their engineering, but suffice it to say that they've managed to do something AMD couldn't: create an energy efficient Radeon video card.

Please continue to the review conclusion in the next section, where I share my final thoughts on the RV770 graphics processor and give my opinion of the new Radeon HD 4800-series product offerings.
Radeon 4800-Series Final Thoughts
There's a lot to like about the new Radeon HD 4800 series of products. To begin with, 800 cores is nothing to scoff at; even if they aren't nearly as efficient as they sound. CrossFireX scales performance very well, and for the first time actually makes multi-card setups worth the money. The most likable part of the Radeon HD 4850 is that it debuted at under $200, forcing NVIDIA to drop the price of their GeForce 9800 GTX+ to meet with the competition. When ATI launched the Radeon HD 4870 at $300, NVIDIA had to answer back by dropping the GTX 260 to a more affordable price. But that's where everything becomes tricky, and the value of ATI's latest product comes into question.
But here's why clarifying how the value has become so tricky to define. The initial interest in a product like the Radeon HD 4850 lies in the fact that it competes head-on with the GeForce 9800 GTX. But now that they are both priced the same, value takes on a new dimension. In each and every test I conducted, the Radeon HD 4850 kept up with the GeForce 9800 GTX but never outperformed it (until 4x AA was added to Crysis). This would be the main reason why I see value becoming more of an issue outside of video game performance. The GeForce 9800 GTX+ offers HDMI, and so does the Radeon HD 4850. Both offer essentially the same exact sub-features down the line, except for when it comes to multi-card configurations; which is where the CrossFireX configuration really comes to shine.
I am very much aware that NVIDIA offers SLI just like ATI offers CrossFireX, but what I'm talking about is multi-card compatibility with motherboards. AMD Didn't exactly impress the world with Phenom, and thus the world hasn't jumped onboard to use their processors. Instead, Intel scooped up a large share of the consumer base with their P35/X38/P45/X48 chipsets (all launched within about ten minutes from each other). But here's my point: ATI still wins. All of these Intel motherboards, along with all of the AMD motherboards, offer CrossFire support exclusively. NVIDIA is left holding their own hand, because only their own chipsets will support SLI... at least until we Intel launches the X58 chipset which is expected to combine their technology with SLI in special versions of the product.

I'm not entirely sold on everything that the chipmakers would like for us to believe. I think it's sometimes worth questioning the wisdom, and in this regard I find that AMD is trying to pull one over on consumers by describing their RV770 to have 800 scalar processors. The reality is that ATI's 800 stream processor cores do not compare 1:1 against the competition, especially since the GeForce 9800 GTX can outperform the Radeon HF 4850 with only 128 shader cores. So despite what ATI would like to market, scalar processors they are not as they function exactly like vector processors would. With 800 processor cores residing in five bank location, each series of 5 processor cores process only one vector unit at a time - even if that vector doesn't need to use all five processor cores. 800 Cores are there, but they are far from the efficiency level seen by the competition.
My final thoughts on the 4800-series is where the Radeon 4850 and 4870 come up short. They're both great products just so that we're clear, but for a 55 nm process there's a lot missing from the RV770's arsenal that really should be there. I consider efficiency at the very start of this list, and even though my first lesson on the relationship between die process size and energy efficiency came from Mr. Jen-Hsun Huang, President of NVIDIA, I later researched this on my own to discover that he was correct: reduced die process does not equal increased energy efficiency. Obviously this phenomenon holds up very well against the power consumption results I've tested for this review.
ATI's memory bus architecture also has me questioning their efforts. NVIDIA can produce a 512-bit memory bus for a 1:1 ratio of memory to interface (512MB @ 512-bit), so it's just a little disappointing that ATI did not do the same for their Radeon HD 4850 and 4870 (which uses GDDR5). Perhaps if I lower my expectations on improvements towards technology, I could accept a 256-bit Radeon HD 4850, but if you're going to make GDDR5 your marketing headline then perhaps you should also do something to match the technical achievements found in competing products. Notwithstanding, memory bandwidth is far from being saturated by today's software (and hardware interface limits), and so my complaint is really more of a moot point, but it still stands to reason that AMD missed an opportunity here.
Sapphire 4850 X2 Conclusion
Benchmark Reviews begins our conclusions with a summary rating of different product categories. The first is product presentation, which includes the level or information offered and the interest generated by the product packaging. In regards to Sapphire, which has historically used the 'sex sells' tactic to interest consumers with a sexy looking character (usually ATI's Ruby), the 4850 X2 adopts a different (but still sexy and cute) animated CG personality. There's plenty of information on the package, which should help educate the inexperienced enthusiast, while at the same time remaining interesting enough to be plucked from store shelves for a closer look.
Moving on to product appearance, there is a little less excitement stirred up by the lack of color or decals. The Radeon HD 4850 has been encased in a black aluminum fan shroud with a flat finish, and only two small labels complete the look. Two open-faced fans compliment the black finish, but the carbon fiber appearance and red coloring of past Sapphire products remains absent.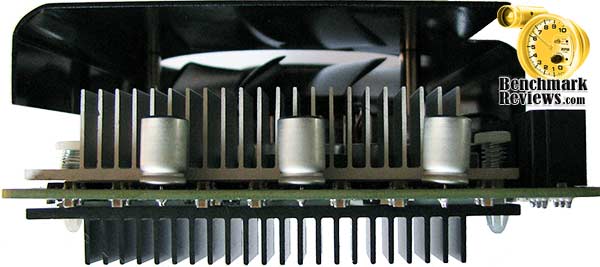 Even a pair of ATI-red fans would have made some level of difference and lend a little more appeal to this premium product.
Construction is solid, but not without some concerns. Sapphire has done a wonderful job of (finally) bringing energy efficient engineering to a Radeon product. With idle and loaded power draw being among the lowest we've recorded, Sapphires phased power construction is something ATI should invest into. On the other hand, If you've read any or my video card reviews you'll know how much I dislike VGA coolers that exhaust back into the computer case... no matter how well they cool. The 4850 X2 isn't doing the nearby components any favors, since it heats to a rather warm 83°C under full load. The overall size (roughly 11.25") is going to cause problems in smaller cases where drives are nearby. Additionally, the length of the Radeon HD 4850 creates a problem for the PCB, which appears to twist the card.
In terms of performance, the Sapphire Radeon HD 4850 X2 usually performed as well as a set of CrossFireX Sapphire Radeon HD 4850's, and slightly behind the awe-inspiring Sapphire Radeon HD 4870 X2. Depending on the test, we had the 4850 X2 either ahead or behind the GeForce GTX 280. On the other hand, there were a few occassions which witnessed the aging GeForce 9800 GX2 beat it out as well. The CD release video drivers might help over time, but that's solely dependant on Sapphire since ATI doesn't produce this product.
Value is always relative to supply and demand, along with whatever retailers think they can get from the consumer audience at any particular time. As of mid-December the 4850 X2 was being sold at NewEgg for $309.99 ($279.99 after rebate), while a single Radeon HD 4850 is offered for only $144.99 (after rebate) making for a sub-$300 CrossFireX configuration with equal or better performance (with heavy exception to power consumption). The Radeon HD 4850 X2 looks to be a good alternative to filling your computer case with individual video cards, and halfing the chance of failure.
In conclusion, my final recommendation on the Sapphire Radeon HD 4850 X2 graphics card is good, but at the moment Sapphire has some fine-tuning to do on their drivers so gamers can get the most out of their product. Much like any other CrossFire set, the X2 series requires the Catalyst Control Center software to manage the combined efforts while the driver negotiates the application workload. Taking the expected price into consideration, you have to look at other comparable offerings. It's no surprise that CrossFire and CrossFireX are available on just about every single motherboard that fits an Intel or AMD processor; the same is hardly true for the SLI. So then it's down to price. Since NVIDIA submitted to ATI's price point, heavily-overclocked versions of both the GTX 280 and Radeon 4870 X2 are now offered around the same cost. Those wanting an energy efficient video card will be pleased by the cost savings on their power bill, but the end of this point there's really no decisive victory to be handed to the Sapphire 4850 X2 until the price settles.
Pros:
+ Extremely good AA/AF performance for highest-end games
+ Energy efficient - very low power consumption
+ Supports DirectX 10 and Shader Model 4.0
+ Dual 625 MHz GPU / 2 GB of 993 MHz GDDR3 vRAM
+ Features ATI AVIVO Technology
+ 1080p HDMI Audio and Video supported for HDCP output
+ Quiet cooling fans under normal operation
+ Introduces new TeraScale Graphics Engine technology
+ Supports Dual-CrossFireX functionality
+ Kit includes CrossFireX bridge component
+ Quad DVI outputs for multi-panel picture support
Cons:
- Consumes more power than most other products tested
- Maximum post-processing Anti Aliasing is limited to 8x
- Fan noise is very loud under full load
- Exhausts heated air inside the computer case
- Driver development is at beta quality
- PCB sppears to flex slightly and should be thicker
- Lacks native HDMI interface (requires dongle adapter)
- Overall size and backside heatsink may interfere with other components
Ratings:
-
Presentation: 9.25
-
Appearance: 8.75
-
Construction: 9.25
-
Functionality: 9.50
-
Value: 7.00
Final Score: 8.75 out of 10.
Quality Recognition: Benchmark Reviews Silver Tachometer Award.
Questions? Comments? Benchmark Reviews really wants your feedback. We invite you to leave your remarks in our Discussion Forum.
Related Articles:
- Sapphire Radeon HD 4870 X2 Atomic ST-6026
- Apevia X-Jupiter Jr G Mid Tower ATX Case
- SilverStone Raven SST-RVM01B Gaming Mouse
- EVGA UV Plus+ UV-19 USB Display Hub
- Gigabyte GA-MA770T-UD3P AM3 Motherboard
- XFX Radeon R7950 Black Edition Video Card
- Intel DZ77GA-70K Benchmark Performance
- XFX Radeon HD R7790 Video Card
- EVGA GeForce GTX560Ti FTW 448-Core
- Palit GeForce 9800 GTX+ Video Card NE/98TX+XT352
