| AMD A10-6800K APU Richland Processor |
| Reviews - Featured Reviews: Processors | |||||||||||||||||||||||||||||||||||||||||||||||||||||||||||||||||||||||||||||||||||||||||||
| Written by Hank Tolman | |||||||||||||||||||||||||||||||||||||||||||||||||||||||||||||||||||||||||||||||||||||||||||
| Wednesday, 05 June 2013 | |||||||||||||||||||||||||||||||||||||||||||||||||||||||||||||||||||||||||||||||||||||||||||
AMD A10-6800K Richland APU Review
Manufacturer: Advanced Micro Devices
Product Name: Desktop Processor
Model Number: A10-6800K Part Number: AD680KW0A44HL / AD680KWOHLBOX Price As Tested: $149.99 (Newegg | Amazon) Full Disclosure: The product sample used in this article has been provided by AMD. So far, it seems that the early summer of 2013 is destined to be full of Intel Haswell coverage. Rather than consigning themselves to the shadows, AMD is quietly releasing two new members of their APU family. The next generation of APUs is being represented at the top by the A10-6800K and the A10-6700 Accelerated Processing Units, codenamed Richland. It has been about eight months since AMD released the last generation, Trinity APUs. When that happened, AMD took back the performance lead from Ivy Bridge in the sub-$150 CPU price range. This has been AMD's bread and butter for a while now, especially with their ability to pair discrete level graphics with their CPUs that totally decimate the onboard capabilities of their opponent. Haswell may change things, but for now, we'll see where AMD is setting the bar for entry-level performance. In this article, Benchmark Reviews takes a hard look at the third generation of AMD APUs with the top end AMD A10-6800K Richland Processor. 
From the recent tech news, it seems like both AMD and Intel are starting to move more development money towards the inevitable expansion of mobility processing and away from the old-hat and worn out desktop market. Can you blame them? Laptops are getting smaller and faster, but even they can't keep up with the publicity of tablets and smartphones. Intel has experienced a few design wins in the tablet market, especially where Windows 8 Pro tablets are concerned. The Atom processors are in a lot of designs, but the i5 tablets are what gets me salivating. AMD isn't far behind either. If Intel can throw an Ivy Bridge CPU into a tablet with its sub-par graphics performance, what's to stop AMD from putting an APU in a tablet and giving the mobility world a small taste of the power of desktop graphics? Well, power, actually, is exactly what has been stopping them. But that won't last for long. With all the profits tied up in the mobility space, desktop enthusiasts are looking for a cookie. A little token of appreciation for the years of toiling and dollars spent upgrading. The summer of 2013 promises a little for everyone with both Intel and AMD pushing out something for us desktop fools. Where their plans lie for the future of desktop computing is anyone's guess. Both companies have come out and said they are not giving up on it. While that may not mean much, let's take a quick look at what AMD is releasing for us. Next Generation A-Series APUsAMD has experienced a lot of success in their APU category since its inception in 2011, especially in the mobility space. With their low price and excellent graphics performance, APUs are great for laptops. Unfortunately, AMD hasn't had much success breaking into the tablet market with their APUs. APUs are also great for entry level systems. They provide processing power on par with Intel CPUs of the same price range, while providing a much superior level of graphics performance. Since the release of the APU, AMD has sat solidly on top of the entry level market. When the second generation of APUs, codenamed Trinity, was released, that position was solidified. For the next generation, AMD's Richland processors don't do much in terms of reinventing.
Richland uses the now tested and better-yielding Trinity die and improves on it. The turbo charged Piledriver cores in the Richland APUs have between 2 and 4 cores and have been updated to support the latest ISA instructions like FMA4, AVX, AES, and XOP. In fact, during testing, I was especially impressed by the ability of the A10 APUs in AES encryption tests. The A10 APUs also include 2MB of L2 cache per module (one module = two cores) and higher maximum Turbo frequencies. The A10-6800K can turbo up to 4.4GHz, 200MHz faster than the previous flagship A10-5800K. Of course, the K at the end of the model means that the clock speed is unlocked and can be overclocked more easily.
The real difference in the Richland APUs, however, lies not in the CPU, but in the GPU. The new APUs include AMD Radeon HD 8000 series GPU cores. On the A10-6800K, that means a Radeon HD 8670D with 384 Radeon Cores. The GPU clockspeed is 844MHz and the GPU supports up to 8x anti-aliasing and 16x anisotropic filtering, although let's not get ahead of ourselves. It is pretty unlikely that those levels of AA and AF will be used in most games with the A10-6800K and no discrete GPU. The 8670D GPU also supports AMD Eyefinity 3+1 and Display Port 1.2, if motherboard manufacturers play along. They'll need to if you plan on using that +1 monitor, since it requires a daisy chained Display Port connection.
The other upgrades to the next generation of APUs can be found in the AMD Turbo Core technology. Better yield means stronger processors that can withstand higher clock frequencies and higher voltage levels. That is the main reason for the higher turbo clocks. The new Turbo Cores are also "Temperature Smart", which I found out means they shutdown a lot more quickly when trying to overclock. The Turbo Core also includes new bottleneck detect algorithms which, hypothetically, would allow the Turbo Core to be more efficient.
Another interesting feature of the new generation of APUs is that they fit into existing FM2 motherboards. That wasn't the case when AMD upgraded from the first generation of APUs to the second generation. This time, though, you won't have to upgrade everything at once. You will want to flash your BIOS to the latest version. You can also consider upgrading your RAM, since the Richland APUs support RAM speeds up to DDR3 2133MHz. |
|||||||||||||||||||||||||||||||||||||||||||||||||||||||||||||||||||||||||||||||||||||||||||


| Processor | A10-6800K | A10-6700 | A8-6600K |
A8-6500 |
A6-6400K |
| CPU Base clock (GHz) | 4.1 | 3.9 | 3.7 | 3.4 | 3.4 |
| CPU Turbo clock (GHz) | 4.4 |
4.2 | 4.3 | 3.8 | 3.8 |
| Cores | 4 | 4 |
4 |
4 | 2 |
| Cache | 4MB | 4MB | 4MB | 4MB | 1M |
| Memory Support | Dual-channel DDR3-2133 | Dual-channel DDR3-1866 | Dual-channel DDR3-1866 | Dual-channel DDR3-1866 | Dual-channel DDR3-1866 |
| PCI-E lanes | 16 Gen 3 | 16 Gen 3 | 16 Gen 3 | 16 Gen 3 | 16 Gen 3 |
| Graphics | Radeon HD 8670D |
Radeon HD 8670D | Radeon HD 8570D | Radeon HD 8570D | Radeon HD 8470D |
| AMD Radeon Cores |
384 |
384 | 256 | 256 | 192 |
| Graphics Core clock | 844MHz | 844MHz | 844MHz | 800MHz | 80MHz |
| DirectX Version | 11.1 | 11.1 | 11.1 | 11.1 | 11.1 |
| AMD Turbo Core |
Yes | Yes | Yes | Yes | Yes |
| TDP | 100 watts | 65 watts | 100 watts | 84 watts | 84 watts |
| Unlocked | Yes |
No | Yes | No | Yes |
| MSRP | $142 | $142 | $112 | $112 | $69 |
Processor Testing Methodology
Richland is the next generation of APUs from AMD and follows Trinity in that role. Because of that, I have included the flagship Trinity processor in this review; the A10-5800K. Throughout the testing process, we will be able to see what kind of improvements the better yields and instructions have given the new APUs. As of this writing, the closest Intel processor to the A10-6800K and A10-6700 APUs that I have on hand, in terms of price and performance, is the Core i3-3220. I'll be comparing the i3-3220 to the new APUs so that we can see exactly where they stand. Of course, when the lower range of Haswell CPUs are released, we will have to revisit the comparisons.
While I did overclock the A10-6800K and run some tests at the overclocked speeds, I will only be included those results in the overclocking section of this review. The A10-6700, as a locked processor, was not intended to be overclocked, and I haven't included any results from overclocking the slower of the two APUs.
The question on everyone's mind, of course, is whether or not the new series of APUs can play games; especially the latest titles available now. Because of that, I'll be specifically answering that question by using an array of GPU synthetic benchmarks and two of the newest games. I've used the HD2500 graphics on the i3-3220 for comparison, but since that's really no competition I also included a GT 630 for low end discrete comparison. Unfortunately I didn't have a GPU between the GT 630 and the Radeon HD 7850 on hand to test with. I added in results from the Radeon HD 7850 and the GTX 660Ti just to show was a little more juice can provide. At around $150, the Radeon HD 7850 could be a great match up for a Richland APU.Intel Z77 Express Test Platform
- Motherboard: Biostar Hi-Fi Z7&X
- Processor: 3.3GHz Intel Core i3-3220 and 3.3GHz Intel Core i5-2500K
- System Memory: 8GB DDR3-1600 (two 4GB DIMMs) at 11-11-12-28
- Primary Drive: Seagate ST1000LM014 1TB SSHD drive
- Graphics Adapter: AMD Radeon HD7850; GT 630; GTX 660Ti; Integrated HD2500
AMD FM2 A-Series Platform
- Motherboard: ASUS F2A85-M Pro
- Processor: 3.8GHz A10-5800K; 3.9GHz A10-6700; 4.1GHz A10-6800K
- System Memory: 8GB DDR3-1600 (two 4GB DIMMs) at 11-11-12-28
- Primary Drive: Seagate ST1000LM014 1TB SSHD drive
- Graphics Adapter: AMD Radeon HD7850; GT 630; GTX 660Ti; Integrated Radeon HD Graphics
Benchmark Applications: CPU
- Operating System: Windows 7 Home Premium 64-Bit
- Finalwire AIDA64 Extreme Edition v2.99.2446 (Beta)
- Futuremark PCMark 7
- Maxon CINEBENCH R11.5 64-Bit
- SiSoft Sandra 2013.SP3a
Benchmark Applications: Integrated GPU
- ComputeMark 2.1
- 3DMark 11
- Unigine Heaven 4.0
- BioShock Infinite
- Tomb Raider
Let's start the benchmarking with an AIDA64 run in the next section.
AIDA64 Extreme Edition Tests
AIDA64 is FinalWire's full 64-bit benchmark and test suite utilizing MMX, 3DNow! and SSE instruction set extensions, and will scale up to 32 processor cores. An enhanced 64-bit System Stability Test module is also available to stress the whole system to its limits. For legacy processors all benchmarks and the System Stability Test are available in 32-bit versions as well.

All of the benchmarks used in this test- Queen, Photoworxx, ZLib, hash, and AES- rely on basic x86 instructions, and consume very little system memory while also being aware of Hyper-Threading, multi-processors, and multi-core processors. Of all the tests in this review, AIDA64 is the one that best isolates the processor's performance from the rest of the system. While this is useful in that it more directly compares processor performance, readers should remember that virtually no "real world" programs will mirror these results.

The Queen and Photoworxx tests are synthetic benchmarks that iterate the function many times and over-exaggerate what the real-world performance would be like. The Queen benchmark focuses on the branch prediction capabilities and misprediction penalties of the CPU. It does this by finding possible solutions to the classic queen problem on a chessboard. At the same clock speed theoretically the processor with the shorter pipeline and smaller misprediction penalties will attain higher benchmark scores.
Like the Queen benchmark, the Photoworxx tests for penalties against pipeline architecture. The synthetic Photoworxx benchmark stresses the integer arithmetic and multiplication execution units of the CPU and also the memory subsystem. Due to the fact that this test performs high memory read/write traffic, it cannot effectively scale in situations where more than two processing threads are used, so quad-core processors with Hyper-Threading have no real advantage. The AIDIA64 Photoworxx benchmark performs the following tasks on a very large RGB image:
- Fill
- Flip
- Rotate90R (rotate 90 degrees CW)
- Rotate90L (rotate 90 degrees CCW)
- Random (fill the image with random colored pixels)
- RGB2BW (color to black & white conversion)
- Difference
- Crop

Finally, the floating point tests.

Let's move on to the PCMark 7benchmark.
PCMark 7 Tests
PCMark 7 is Futuremark's successor to PCMark Vantage. The full suite of tests comprises seven different sequences with more than 25 sub-tests that exercise your system's abilities in storage, computation, image and video manipulation, web browsing and gaming. It was developed with input from the designers, engineers and product managers at AMD, Compal, Dell, Hitachi GST, HP, Intel, NVIDIA, Samsung, Seagate, Western Digital and many other well-known companies.
For this benchmark I chose the PCMark test, which provides a number indicating total system performance, as well as the Productivity, Creativity, Entertainment, and Computation test suites.
Creativity Test
The Creativity test contains a collection of workloads to measure the system performance in typical creativity scenarios. Individual tests include viewing, editing, transcoding and storing photos and videos. At the end of the benchmark run the system is given a Creativity test score.
- Storage
- importing pictures
- video editing
- Image manipulation
- Video transcoding - high quality
Computation Test
The Computation test contains a collection of workloads that isolate the computation performance of the system. At the end of the benchmark run the system is given a Computation test score.
- Video transcoding - downscaling
- Video transcoding - high quality
- Image manipulation

Productivity Test
The Productivity test is a collection of workloads that measure system performance in typical productivity scenarios. Individual workloads include loading web pages and using home office applications. At the end of the benchmark run the system is given a Productivity test score. The Productivity test consists of:
- Storage
- Windows Defender
- Starting applications
- Web browsing and decrypting
- Productivity
- Data decryption
- Text editing
Entertainment Test
The Entertainment test measures your PC performance in common entertainment scenarios such as recording, viewing, streaming and transcoding TV shows and movies, importing, organizing and browsing new music and playing games. Some workloads require DirectX 10.
It's important to note that since PCMark 7 was designed as a system test, the scores are dependent on the configuration of the entire system being tested, including things like the memory, hard disk, and graphics cards used: it's not an isolated CPU test like most of the other benchmarks I'm using in this review. However, since all other hardware (motherboard, video card, memory, hard disk, etc.) was identical, with only the CPUs being changed, any performance differences here can be attributed to differences in CPU performance.

In the next section I run everyone's favorite benchmark: CINEBENCH!
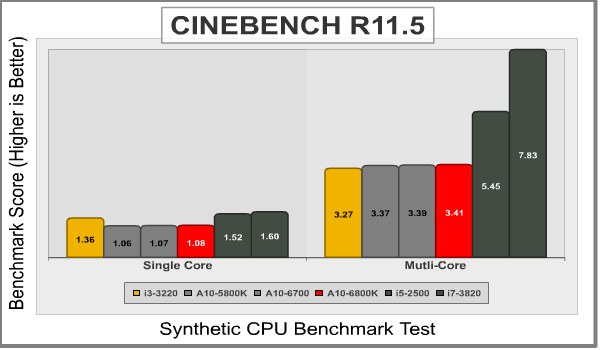
CINEBENCH 11.5
Maxon CINEBENCH is a real-world test suite that assesses the computer's performance capabilities. CINEBENCH is based on Maxon's award-winning animation software, Cinema 4D, which is used extensively by studios and production houses worldwide for 3D content creation. Maxon software has been used in blockbuster movies such as Spider-Man, Star Wars, The Chronicles of Narnia, and many more. CINEBENCH Release 11.5 includes the ability to more accurately test the industry's latest hardware, including systems with up to 64 processor threads, and the testing environment better reflects the expectations of today's production demands. A more streamlined interface makes testing systems and reading results incredibly straightforward.
The CINEBENCH R11.5 test scenario comprises three tests: an OpenGL-based test that models a simple car chase (which I didn't use for this test), and single-core and multi-core versions of a CPU-bound computation using all of a system's processing power to render a photo-realistic 3D scene, "No Keyframes", the viral animation by AixSponza. This scene makes use of various algorithms to stress all available processor cores, and all rendering is performed by the CPU: the graphics card is not involved except as a display device. The multi-core version of the rendering benchmark uses as many cores as the processor has, including the "virtual cores" in processors that support Hyper-Threading. The resulting "CineMark" is a dimensionless number only useful for comparisons with results generated from the same version of CINEBENCH.
Next up is SiSoft Sandra's suite of CPU benchmarks.
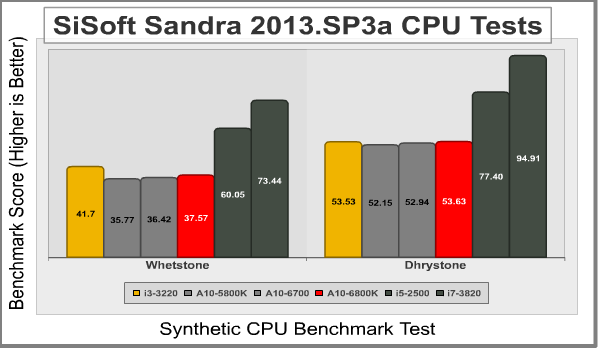
SiSoft Sandra 2013
SiSoftware Sandra (the System ANalyser, Diagnostic and Reporting Assistant) is an information & diagnostic utility. It should provide most of the information (including undocumented) you need to know about your hardware, software and other devices whether hardware or software. It's available in five versions, ranging from the free "Lite" version to the Sandra Enterprise version. Sandra fully supports and exploits multi-processor and multi-core systems, NUMA memory, Hyper-Threading, and MMX, SSE, SSE2, SSE3, SSSE3, SSE 4.1, SSE 4.2, AVX, and FMA instructions.
It works along the lines of other Windows utilities, however it tries to go beyond them and show you more of what's really going on. Giving the user the ability to draw comparisons at both a high and low-level. You can get information about the CPU, chipset, video adapter, ports, printers, sound card, memory, network, Windows internals, AGP, PCI, PCI-X, PCIe (PCI Express), database, USB, USB2, 1394/Firewire, etc.
CPU Cache Memory Tests
The SANDRA DhryStone and Whetstone tests are CPU tests that run completely within the CPU + cache memory itself. These tests are perfect for seeing general efficiency per processing core. Dhrystone is basically a suite of arithmetic and string manipulating programs and is an older CPU tests. Even so, it remains a simple and accurate way to show RAW CPU processing performance. The whetstone benchmark primarily measures floating-point arithmetic performance.
CPU MultiMedia and Cryptography Tests
This benchmark generates a picture (640x480) of the well-known Mandelbrot fractal, using 255 iterations for each data pixel, in 32 colours. It is a real-life benchmark rather than a synthetic benchmark, designed to show the improvements MMX/Enhanced, 3DNow!/Enhanced, SSE(2) bring to such an algorithm. The benchmark is multi-threaded for up to 64 CPUs maximum on SMP systems. This works by interlacing, i.e. each thread computes the next column not being worked on by other threads. Sandra creates as many threads as there are CPUs in the system and assignes each thread to a different CPU.
The benchmark contains many versions (ALU, MMX, (Wireless) MMX, SSE, SSE2, SSSE3) that use integers to simulate floating point numbers, as well as many versions that use floating point numbers (FPU, SSE, SSE2, SSSE3). This illustrates the difference between ALU and FPU power. The SIMD versions compute 2/4/8 Mandelbrot point iterations at once - rather than one at a time - thus taking advantage of the SIMD instructions. Even so, 2/4/8x improvement cannot be expected (due to other overheads), generally a 2.5-3x improvement has been achieved. The ALU & FPU of 6/7 generation of processors are very advanced (e.g. 2+ execution units) thus bridging the gap as well.

Financial Operations, Multi-Core Efficiency, and Floating Point Tests
These final three tests measure the ability of the CPU to conduct various other operations. Financial-esque operations, including highly detailed mathematical algorithms are measured in thousands of operations per second (kOPT/s). The speed at which information is transmitted in multi-core setups is tested as well. Finally, SiSoft Sandra has its own suite of ALU Floating Point tests to test out the floating point operations of the CPU.

Next up we'll take a look at the GPU capabilities of the A10-6800K.
DX11 performance
ComputeMark 2.1
ComputeMark is a DirectX 11 Compute Shader Benchmark designed specifically with GPU punishing in mind. It attacks the compute power of your graphics card and spits out a benchmark score. The ComputeMark 2.1 benchmark is a free, downloadable benchmark that is available to everyone. I've included it here so that anyone can try it out and compare their scores to something they see here.

3DMark 11
3DMark11 is Futuremark's latest iteration of the video card software benchmark suite, building on the features of 3DMark Vantage and 3DMark 06 as well as earlier version. It's optimized and intended for testing DirectX-11 capable hardware running under Windows Vista or Windows 7.

Heaven 4.0
The Unigine Heaven 4.0 benchmark is a free publicly available tool that grants the power to unleash the graphics capabilities in DirectX-11 for Windows 7 or updated Vista Operating Systems. It reveals the enchanting magic of floating islands with a tiny village hidden in the cloudy skies. With the interactive mode, emerging experience of exploring the intricate world is within reach. Through its advanced renderer, Unigine is one of the first to set precedence in showcasing the art assets with tessellation, bringing compelling visual finesse, utilizing the technology to the full extend and exhibiting the possibilities of enriching 3D gaming.
The distinguishing feature in the Unigine Heaven benchmark is a hardware tessellation that is a scalable technology aimed for automatic subdivision of polygons into smaller and finer pieces, so that developers can gain a more detailed look of their games almost free of charge in terms of performance. Thanks to this procedure, the elaboration of the rendered image finally approaches the boundary of veridical visual perception: the virtual reality transcends conjured by your hand. The Heaven benchmark excels at providing the following key features:
- Native support of OpenGL, DirectX 9, DirectX-10 and DirectX-11
- Comprehensive use of tessellation technology
- Advanced SSAO (screen-space ambient occlusion)
- Volumetric cumulonimbus clouds generated by a physically accurate algorithm
- Dynamic simulation of changing environment with high physical fidelity
- Interactive experience with fly/walk-through modes
- ATI Eyefinity support

Gaming Benchmarks
For true gaming benchmarks, I've included two of the lastest and most popular titles available at launch; BioShock Infinite and Tomb Raider.
For BioShock, I used the low presets, expecting that it would be hard on the integrated GPUs. According to the press release from AMD, the Radeon HD 8670D did a little better than the results I saw.

For Tomb Raider, I used the normal presets. Again, in the press release I recieved from AMD, it looked as though the integrated graphics could handle the game a little better than what I experienced. Of course, they were also using DDR3-2333 RAM, where I was using DDR3-1600. Generally speaking, though, increased RAM speed doesn't amount to more than a couple of FPS difference.

Lets take a look at overclocking.
AMD A10-6800K Overclocking
For the unlocked K-series APUs, AMD recommends using AOD, AMD Overdrive. AOD is a utility that can be downloaded directly from AMD as a stand alone program. AOD can also be accessed and used from within the Catalyst suite, also known as the Vision Control Center.

I actually ran into some trouble overclocking the AMD A10-6800K. First off, as you can see above, the APU was running at 4.3GHz from the get go. Obviously it was in turbo mode, but without anything running other than Overdrive, I'm not sure why it was pushing 4.3GHz.

To manually overclock the AMD A10-6800K, you first have to turn off Turbo Core Control. You can do this by clicking the button with the same name and unchecking the box that says Enabled at the top of the screen. After that, you have full range to overclock the CPU Core Multiplier. I initially pushed the multiplier up to 46X, but when I ran the integrated stress test within AOD, it failed very quickly. I figured the CPU must have needed more juice, so I bumped the voltage up to 1.3875v. This gave me enough juice to run the overclock at 4.6GHz stably.

I tried a bunch of other settings, increasing the voltage slightly, decreasing the multiplier and increasing the reference clock, you name it. Nothing withstood stressing. I have to admit that I am a little disappointed that I was only able to overclock the A10-6800K to 200MHz higher than the stock Turbo speed. Of course, it was 500MHz higher than the stock clock speed, so that wasn't too bad.
In Cinebench, this translated to a score of 3.85 over a stock score of 3.41. That's about a 13% increase in performance for an extremely easy overclock.
I was also able to stably overclock the GPU to 1GHz from 844MHz, an increase of about 18.5%. This translated into increased FPS in 3DMark 11 on Test 1 from 9.2 to 11.9, up over 29%. In GT2 I went from 9.94 to 12.72, up 28%. GT3 went from 11.88 to 15.21, up 28%, and GT4 went from 7.13 to 8.89, up nearly 25%.
Overall, the increase in the GPU was much more dramatic than the increase in the CPU, and you might actually get some playable FPS on the low settings of higher end games if you can overclock to 1000MHz or better.

The AMD Overdrive utility also comes with the ability to automatically overclock the APU. I tried using the presets, but failed everytime. I'd recommend slowly working your way up on your own.
Richland Final Thoughts
Unfortunately, AMD seems to always show up to the party a little bit late. Sure, the next generation of APUs made it out before the low-end of the Haswell spectrum, but the fanfare was minimal and actual performance increase was only slight over the previous generation of APUs. The nice part is, of course, that the new Richland APUs still use the FM2 platform, meaning that anyone with a Trinity system can start taking advantage of higher speed RAM, increased clock speeds, and better integrated GPUs without having to upgrade the motherboard.

I also have to credit AMD for maintaining the highest level of performance for the sub- $150 price point. The AMD A10-6800K, at an MSRP of $142 looks set to take on whatever Haswell can throw at that level, and certainly so in terms of graphics power. While I haven't had hands on time with a Haswell CPU yet, AMD shared some of their benchmarks with me just before publishing this article. While the actual levels of performance don't reach the newely released Haswell Core i5 numbers, the price to performance ratio certainly favors the Richland in lower end Home and Work productivity benchmarks. If Richland is competing with the more expensive i5 CPUs, then it has a strong chance against the upcoming i3 CPUs.
Of course, also of note on those tests that AMD revealed was the fact that the older A10-5800K topped their charts in price to performance ratio, solidly beating out even the newer A10-6800K. I have to admit that those numbers aren't convincing me to buy a new Richland APU, but rather to take advantage of the dropping prices on the older Trinity APUs. After all, the new 8000 series onboard GPU can only pair with the same level of discrete GPU that last generations Trinity APUs could.
The one defining feature that might just convince me to run out and buy a Richland APU over a Trinity is its focus on working better with Miracast and Splashtop for using a wireless monitor or streaming games to my mobile devices. That just might make all the difference. If I wasn't planning on doing either of those two things, however, it just fiscally makes more sense to buy a Trinity APU at this point. Ultimately, I think both Haswell and Richland are sort of a disappointment. It looks like both Intel and AMD are focusing more on mobile platforms and pushing development away from desktop advancements.
AMD A10-6800K Conclusion
The AMD A10-6800K APU is a good next-step in the world of AMD Accelerated Processing Units. It represents a slight increase in performance in both the CPU and GPU portions of the unit over the last generation of Trinity processors. I'm not sure that I think it should be named the A10-6800K, though. In all honesty, it seems more like an A10-5900K instead. That would make the A10-6700 something like the A10-5950 I suppose. The reason I say that is because it is not really a significant enough increase in any area for me to justify calling it a new series. I suppose I can't complain too much, however. The A10-6800K still uses the same FM2 platform and only requires a BIOS update to use all of the increased functionality.
I actually find it quite humorous that David Ramsey, in his review of the new Haswell Core i7-4770K, refers to it as a veritable step backwards because the performance increase doesn't justify the price increase. Little did he know that this type of behavior is apparently the new industry standard. (Editor's note:did anyone notice the 2011 copyright marked on the processor?) AMD did the exact same thing with the A10-6800K. The new processor costs 10% more than the A10-5800K, but performs only 5 to 6% better on average. Just like David said with the Haswell CPU, if you were to get your hands on a late model 5800K, there is a high likelihood that you could overclock it to be faster than a new model 6800K.
Since the FM2 platform looks like it will be around and supported for at least the next 6 months to a year with a new stream of processors, there really isn't any reason that I can see to upgrade at this point to a Richland APU. If you are in the market right now for a new entry to mid-level desktop computer, I have to recommend Trinity at its current price. I think I might still give the win to Richland if you are building an HTPC, but then again, that's only if you plan on using a Wireless TV or monitor in the near future. Otherwise, Trinity still wins with its ability to pair with the same GPUs as Richland.
The overclockability of the A10-6800K really doesn't do it much justice either, looking from a CPU perspective. While I was able to reach 500MHz faster than the stock clock speed, that really only translates into 200MHz higher than the maximum turbo clock speed available from the A10-6800K anyway. That did provide a slight boost in CPU performance, but I wouldn't count on that as a selling point. The GPU, on the other hand, overclocked very well. I was able to bump it to 1000MHz which pulled around a 25% increase in performance of GPU tasks. A 25% increase actually gives the A10-6800K a chance at playing the latest games, albeit on the lowest settings.
In conclusion, I can't fully get behind a recommendation at this point for the $149.99 (Newegg | Amazon) A10-6800K Richland APU. It just doesn't provide the level of performance increase that would justify buying it over last generation's processors. I think there is a good chance that the price of the Richland APUs will drop relatively quickly. When it does, I'll get behind it. Until then, get a Trinity.
Pros:
Cons:
Ratings:
-
Performance: 8.00
-
Overclock: 7.00
-
Construction: 9.00
-
Functionality: 9.50
-
Value: 7.50
Final Score: 8.20 out of 10.
COMMENT QUESTION: How often do you upgrade your PC?
Related Articles:
- XFX Radeon HD5830 DX11 Video Card
- NVIDIA GeForce GTS 450 GF106 Video Card
- Rosewill Ranger Mid-Tower Computer Case
- Antec TruePower Quattro 850W Modular PSU TPQ-850
- Mushkin Ridgeback Redline Enhanced DDR3
- Thermaltake Armor A90 VL90001W2Z
- Corsair Obsidian 700D Full-Tower Case
- ASUS Sabertooth P67 B3 TUF Motherboard
- Diamond Viper ATI Radeon HD 3870 512MB Video Card
- Guild Wars 2 Digital Deluxe Video Game

Comments
this was proven false with APUs which can gain as much as a 20-25% boost from 1866 RAM over 1600 and the same with 1600 over 1333 which means which means if used bishock infinite would most likely have come in at a low but very much playable 25 FPS.
i only felt the need to point this out because anyone who is considering these new APU should be aware that RAM speed makes a much bigger difference than it does with any other setup.
2133Mhz 1866Mhz 1600Mhz
Devil May Cry
1080p, Ultra, all settings max 41.351 38.051 35.691
Far Cry 3 Blood Dragon
1080p, DX11, med, low post fx, low shadows 30 26 24.932
Bioshock Infinite
1080p, low preset 31.2 27.9 25.56
Tomb Raider
1080p, low preset, texture quality normal 42.9 38.7 36
Sometimes the FPS gains are up to 4 or 5 FPS. So I should have said a few FPS difference rather than a couple. Either way, I didn't have any 2133MHz RAM on hand to test with.
#hothardware.com/Reviews/AMD-A106800K-and-A106700-Richland-APUs-Tested/?page=11
Those numbers I posted above were from AMD's own testing and not one of those tests shows a performance increase of more than 6.9 FPS between the DDR3-1600MHz RAM and the DDR3-2133MHz RAM.
If there are any lingering doubts, the answer is yes, 2133MHz RAM will increase performance for the A10-6800K, but not dramatically enough to call testing with DDR3-1600MHz RAM a waste of time.
2. What is the performance of matching the APU + discrete GPU against an i3 or i5 + with the same discrete GPU? The iGPU is great, but most gamers are going to wonder if they can recommend the A10-6800K as a viable alternative to the i3-3225/i5-3570K/4670K as a gaming CPU with single GPU. With the ability to run two GPUs in x8/x8, it would be nice to see Crossfire tests with two discrete GPUs, if that is possible...
Thanks,
Kris
As for your second question, I would have loved to run some CrossfireX tests. Unfortunately, the Richland APUs only support CFX up to Radeon HD 6670. I didn't have a 6670, 6570, or 6470 on hand to test with. I tried to use a 7790 and a 7850, but they don't work. As for using two discrete GPUs, those results aren't going to factor in the APU in any measurable way. You'd get close to the same results regardless of the setup with two discrete GPUs in CFX. I think I showed pretty well that, when paired with a Radeon HD 7850 or a GTX 660Ti, the A10-6800K is more than viable as a gaming CPU. Those scores will be consistent with any CPU.
Firstly, thank you for the getback!
So if I understand you correctly, even though they support x8/x8 configs, APUs do not support disabling the iGPU and running, say, two 7850s or 660 Ti's?
I am wondering how the APU compares directly to the i3-3225 and i5-3570K/4670K as *just* a gaming CPU, where a discrete card will be present and the iGPU will not be utilized for gaming.
A game like Supreme Commander, with lots of units on screen, would be a great way to test the CPU's capability in the game.
You can definitely use two video cards in CF or SLI configuration in an FM2 motherboard and bypass using the IGP altogether. My point was that, for nearly all high-end games, the CPU wouldn't make a significant difference in that case. The FPS using an A10-6800K would be about the same as if you were using an i5-4670K or even an i7-4770K. With CPU intensive games, of which there are a few, the faster CPU would obviously provide better performance. I ran tests using the GTX 660Ti as the sole GPU and the on both the i3-3220 machine and the A10-6800K machine, the actual gaming performance was always within 3%, generally considered to be the margin of error.
I have little experience with the desktop APU's, as most of my customers rarely ask for those. I can however comment on the A10 in laptops. I bought a Trinity (A10-4600m) based laptop for school around this time last year and I was floored at the graphics performance. AMD is a clear winner if your shopping for a laptop on a budget and dont want or cant afford one with a discrete GPU in it. I am partial to Intel/Nvidia in the desktop market, but next time Im on the market for a Laptop without a discrete GPU, I know what I will be getting.
This is around 10-30fps slower than the 6800k in most games. And almost twice the price!!
Youtube link:
#youtu.be/k7Yo2A__1Xw
#hexus.net/tech/reviews/cpu/46073-amd-a10-5800k-trinity-needs-faster-ram/?page=3
and many more
See no reason why the 6800 shouldn't also