| SandForce SF1200 RAID-0 SSD Performance |
| Reviews - Featured Reviews: Storage | |||||||||||||||||||||||||||||||||||||||||||||||||||||||||||||||||||||||||||||||||||||||||
| Written by Olin Coles | |||||||||||||||||||||||||||||||||||||||||||||||||||||||||||||||||||||||||||||||||||||||||
| Tuesday, 04 May 2010 | |||||||||||||||||||||||||||||||||||||||||||||||||||||||||||||||||||||||||||||||||||||||||
SandForce SF-1200 RAID-0 SSD PerformanceThe SandForce SF-1222TA3-SBH processor is part of the SF-1200 SSD controller family, and through various new technology implementations SandForce has redefined performance expectations for the entire solid state storage landscape. Not only are bandwidth speeds extremely fast (nearly saturating the SATA-3GB/s interface), but operational IOPS performance reaches SLC-NAND levels. Additionally, SandForce RAISE technology provides redundant protection for single SSD computer systems, and data is automatically secured with AES-128 encryption. Benchmark Reviews has individually tested the ADATA S599, Corsair Force F100, and RunCore Pro-V SSDs, all which use the SandForce SF-1200 controller, but we've never experimented with these drives in a combined array. For this article, Benchmark Reviews tests two SandForce SF-1200 SSDs in a striped RAID-0 array to unleash absolute performance. The biggest mistake PC hardware enthusiast make with SSDs is grading them by their speed. File transfer speed is important, but only so long as the operational IOPS performance can sustain that bandwidth under load. Installing a single SSD into a system that previously used a hard drive storage device will produce dramatic improvements, but for this project, two of the most powerful prosumer SSDs on the market are combined into a striped 4KB/128KB RAID-0 array to provide maximum speed and performance at the cost of data redundancy. It's true that if one disk fails in a RAID-0 array that all data is lost, but some hardcore gamers and PC hardware enthusiasts are willing to take that risk. So long as backup precautions are in place, the payoff can be worth the gamble. In a very short time span the entire SSD market has created and recreated itself many times over. Counting the generations of SSD processors has become difficult for experienced experts, and keeping-up with controller architecture has come with its own set of challenges. Benchmark Reviews has tested many Solid State Drive products, and we've seen everything from dual-SATA controllers in RAID-0 to extremely large cache buffer modules used inside of them. While the SSD industry grows daily, only a few select manufacturers offer popularly-accepted Flash NAND SSD controllers. While the SSD industry grows daily, only a few select manufacturers offer popularly-accepted Flash NAND SSD controllers. As of May 2010 the most popular consumer SSD controllers are: Indilinx IDX110M00-FC "Barefoot", Intel PC29AS21AA0, JMicron JMF612, Toshiba T6UG1XBG, Samsung S3C29RBB01-YK40, SandForce SF-1200/1500, and the Marvell 88SS9174-BJP2 SATA 6Gb/s SSD controller.
For decades, the slowest component in any computer system was the hard drive. Most modern processors operate within approximately 1-ns (nanosecond = one billionth of one second) response time, while system memory responds between 30-90 ns. Traditional Hard Disk Drive (HDD) technology utilizes magnetic spinning media, and even the fastest spinning desktop storage products exhibit a 9,000,000 ns - or 9 ms (millisecond = one thousandth of one second) initial response time. In more relevant terms, The processor receives the command and waits for system memory to fetch related data from the storage drive. This is why any computer system is only as fast as the slowest component in the data chain; which is usually the hard drive. The theoretical goal for achieving optimal performance is for system memory to operate as quickly as the central processor, and the storage drive to operate as fast as memory. With present technology this is an impossible task, so enthusiasts try to close the speed gaps between components as much as possible. Although system memory is up to 90x (9000%) slower than most processors, just consider that the hard drive is an added 1000x (100,000%) slower than that same memory. Essentially, these three components are as different in speed as walking is to driving and flying. Solid State Drive technology bridges the largest gap. The difference a SSD makes to operational reaction times and program speeds is dramatic, and takes the storage drive from a slow 'walking' speed to a much faster 'driving' speed. Solid State Drive technology improves initial response times by more than 450x (45,000%) for applications and Operating System software, when compared to their HDD counterparts. Bandwidth Speed vs Operational PerformanceAs we've explained in our SSD Benchmark Tests: SATA IDE vs AHCI Mode guide, Solid State Drive performance revolves around two dynamics: bandwidth speed (MB/s) and operational performance (IOPS). These two metrics work together, but one is more important than the other. Consider this analogy: operational IOPS performance determines how much cargo a ship can transport in one voyage, and the bandwidth speed is to fast the ship moves. By understanding this and applying it to SSD storage, there is a clear importance set on each variable depending on the task at hand. For casual users, especially those with laptop or desktop computers that have been upgraded to use an SSD, the naturally quick response time is enough to automatically improve the user experience. Bandwidth speed is important, but only to the extent that operational performance meets the minimum needs of the system. If an SSD has a very high bandwidth speed but a low operational performance, it will take longer to load applications and boot the computer into Windows than if the SSD offered a higher IOPS performance. SandForce SF-1200 FeaturesSandForce SF-1200 SSD Processors enable commodity flash memory to reliably operate in cost and power sensitive client computing environments. The SF-1200 is a true single-chip SSD Processor designed for volume manufacturing and outstanding performance. Innovative DuraClass technology delivers world class reliability, endurance, performance and power consumption.
Endurance and Longevity
Performance and Power Optimization
Mobile Computing Security
Data Protection and Reliability SandForce Specifications
SandForce SF-1200 SSD ControllerThe SandForce SF-1200 SATA-3GBps controller is new to the industry, but many manufacturers are already hailing it as the replacement for Indilinx's industry-leading Barefoot processor. Both are second-generation SATA products limited to 3.0 GB/s transfer speeds, and both offer similar specifications. SandForce adds DuraClass technology to their SF-1200 processor, which claims to provide best-in-class endurance, performance, and lower power consumption. DuraWrite technology extends the endurance of MLC-NAND memory by providing at least five year lifecycles measured with 3000-5000 cycle MLC flash. Additionally, SandForce RAISE technology provides RAID-like protection for single SSD computer systems, and data is secured with AES-128 automatic encryption. SandForce has hit the 2010 SSD industry with full force, much the same way that Indilinx did back in 2009. Finished-goods companies can utilize the SandForce SF1200 processor in their own product line, which then receives a "SandForce Driven" badge. The SandForce SF-1222 processor is presently available in the ADATA S599, Corsair Force, RunCore Pro-V, Patriot Inferno, OWC Mercury Extreme Pro-RE, G.Skill Phoenix Pro, OCZ Vertex-2, PhotoFast G-Monster 2, OCZ Agility-2, and Mach Xtreme SSD series.
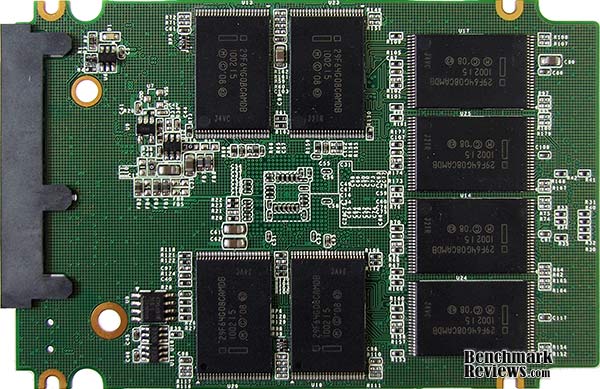
From the view above the printed circuit board (PCB), it doesn't look like there's anything dramatically innovative on the SandForce Solid State Drive. Eight flash NAND modules make a horseshoe around the SandForce SF-1200 SSD processor, and plenty of electronics fill in the remaining space atop the printed circuit board. But once the SandForce SSD board is turned to expose the underside, the difference is obvious: SandForce has used their DuraClass technology to remove the DRAM buffer.
The 2nd-generation SATA-3.0GBps SandForce SF-1222TA3-SBH processor is part of their SF-1200 family of SSD controller chips, and SSDs will utilize either the SF-1200 processor for retail consumers or SF-1500 for enterprise devices. All SandForce SSD controllers offer native TRIM support in Microsoft Windows-7, Native Command Queuing (NCQ) with 32 command slots, and Self-Monitoring, Analysis, and Reporting Technology (SMART) command set. While not directly important to transfer speeds or operational performance, SandForce utilizes a Tensilica Diamond Core DC_570T CPU inside the SF-1200 processor.
Another benefit of SandForce's SF-1200 architecture is that the SSD keeps all information on the NAND grid and removes the need for a separate cache buffer DRAM module. The result is a faster transaction, albeit at the expense of total storage capacity. SandForce SSDs utilize over-provisioning technology, which allocates a portion of NAND for data storage and the remainder reserved for transaction and cache buffer space. SandForce has also marketing custom firmware to the finished-goods companies that sell their SSDs, which remove performance restrictions. The SF-1200 SSD processor provides ECC data protection and includes SandForce's unique RAISE (Redundant Array of Independent Silicon Elements) technology. RAISE provides the protection and reliability of RAID on a single SSD drive, thanks to flash architecture, without the significant write overhead of parity. The SandForce DuraClass technology automatically stores data in AES-128 encrypted format, preventing data extraction directly from the physical flash memory modules.
Sixteen multi-layer cell Intel 29F64G08CAMDB flash NAND modules are joined to the SandForce SF-1200 controller. On professional-level 28% over-provisioned SandForce SSDs, these NAND modules may combine for 128GB of physical storage space yet only 100GB of this capacity is designated for data. Consumer-level SandForce SSDs receive 7% over-provisioning and 128GB devices will yield 120GB of usable storage space. Because the SandForce SF-1200 SSD processor inside the many SSDs is a non-exclusive component available market-wide, Benchmark Reviews expects to see many new solid state storage products using this controller in the near future. Please continue on for details and performance results for this Solid State Drive... SSD Testing MethodologySolid State Drives have traveled a long winding course to finally get where they are today. Up to this point in technology, there have been several key differences separating Solid State Drives from magnetic rotational Hard Disk Drives. While the DRAM-based buffer size on desktop HDDs has recently reached 32 MB and is ever-increasing, there is still a hefty delay in the initial response time. This is one key area in which flash-based Solid State Drives continually dominates because they lack moving parts to "get up to speed". However the benefits inherent to SSDs have traditionally fallen off once the throughput begins, even though data reads or writes are executed at a high constant rate whereas the HDD tapers off in performance. This makes the average transaction speed of a SSD comparable to the data burst rate mentioned in HDD tests, albeit usually lower than the HDD's speed. Comparing a Solid State Disk to a standard Hard Disk Drives is always relative; even if you're comparing the fastest rotational spindle speeds. One is going to be many times faster in response (SSDs), while the other is usually going to have higher throughput bandwidth (HDDs). Additionally, there are certain factors which can affect the results of a test which we do our best to avoid. RAID-0 Stripe ModeThis article presents two opposing views: one set of results using RAID-0 configured with 4KB stripe sizes, and the other using Intel's ICH10 maximum of 128KB stripes. Many PC hardware enthusiasts ask which RAID-0 stripe size is better, without understanding the implications involved with the answer. There are countless variables that could make one size perform better than another and a magnetic hard drive, but for solid state storage products the response time is up to 450x faster and therefore has less impact on performance. More often than not, the size of files stored on the drive are the key indicator behind the appropriate RAID-0 stripe size. Each stripe of data is a specific size. If a stripe size is set to 4KB, then a 4KB file would be written by only one drive using a single stripe. However, if that file is 8KB, then it would be split in half and written to both drives. Not many files are as small as 4KB anymore, which creates a storage processing penalty when larger files are written. For example, if a 4KB stripe is assigned and a 4MB file is written, then 500 date stripes are written to each drive. When these same drives are assigned a 128KB stripe size, each drive is written to only 31 times. This may create the illusion that larger stripe file sizes are better, but SSDs could possibly change this dynamic. SSD Testing DisclaimerEarly on in our SSD coverage, Benchmark Reviews published an article which detailed Solid State Drive Benchmark Performance Testing. The research and discussion that went into producing that article changed the way we now test SSD products. Our previous perceptions of this technology were lost on one particular difference: the wear leveling algorithm that makes data a moving target. Without conclusive linear bandwidth testing or some other method of total-capacity testing, our previous performance results were rough estimates at best. Our test results were obtained after each SSD had been prepared using DISKPART or Sanitary Erase tools. As a word of caution, applications such as these offer immediate but temporary restoration of original 'pristine' performance levels. In our tests, we discovered that the maximum performance results (charted) would decay as subsequent tests were performed. SSDs attached to TRIM enabled Operating Systems will benefit from continuously refreshed performance, whereas older O/S's will require a garbage collection (GC) tool to avoid 'dirty NAND' performance degradation. It's critically important to understand that no software for the Microsoft Windows platform can accurately measure SSD performance in a comparable fashion. Synthetic benchmark tools such as HD Tach and PCMark are helpful indicators, but should not be considered the ultimate determining factor. That factor should be measured in actual user experience of real-world applications. Benchmark Reviews includes both bandwidth benchmarks and application speed tests to present a conclusive measurement of product performance. Test System
Drive Hardware TestedThe following storage hardware has been used in our benchmark performance testing, and may be included in portions of this article:
Test Tools
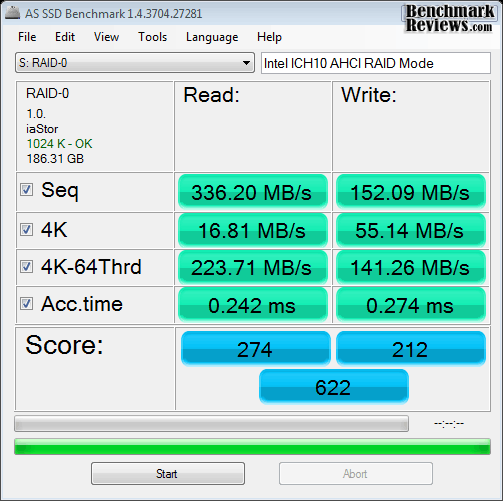
Test Results DisclaimerThis article utilizes benchmark software tools to produce operational IOPS performance and bandwidth speed results. Each test was conducted in a specific fashion, and repeated for all products. These test results are not comparable to any other benchmark application, neither on this website or another, regardless of similar IOPS or MB/s terminology in the scores. The test results in this project are only intended to be compared to the other test results conducted in identical fashion for this article. AS-SSD BenchmarkAlex Schepeljanski of Alex Intelligent Software develops the free AS SSD Benchmark utility for testing storage devices. The AS SSD Benchmark tests sequential read and write speeds, input/output operational performance, and response times. Because this software receives frequent updates, Benchmark Reviews recommends that you compare results only within the same version family. Beginning with sequential read and write performance, our pair of SandForce SF-1200 SSDs combined into a RAID-0 array with 4KB stripes produced 336.2 MB/s read speed, but only 152.1 MB/s write performance. The sequential file transfer speeds have traditionally been low with this benchmark tool, especially for SandForce controllers, which is why we will concentrate on the operational IOPS performance for this section. Single-threaded 4K IOPS performance delivers 16.81 MB/s read operations, which is nearly identical to single-drive performance. Write operations rendered 141.26 MB/s and measures nearly double the performance of a single SSD. Similarly, the 64-thread 4K reads recorded 223.71 MB/s, while write performance was 141.26.
Compared to the 4KB stripes, 128KB RAID-0 stripes appear to make the first big impact with sequential read performance (although write performance lags slightly behind). 4KB single-threaded performance was slightly higher, but a 4 MB/s improvement (compared to 227.8 MB/s) was seen in 4K-64 thread read tests, and an additional 2 MB/s for 4K-64Thrd writes.
Displayed in the chart below, the 64-thread 4KB IOPS performance results for several enthusiast-level storage products illustrates which products offer the best operation under load:
Drive Hardware
In the next section, Benchmark Reviews tests transfer rates using ATTO Disk Benchmark. ATTO Disk BenchmarkThe ATTO Disk Benchmark program is free, and offers a comprehensive set of test variables to work with. In terms of disk performance, it measures interface transfer rates at various intervals for a user-specified length and then reports read and write speeds for these spot-tests. There are some minor improvements made to the 2.34 version of the program, but the benchmark is still limited to non-linear samples up to 256MB. ATTO Disk Benchmark requires that an active partition be set on the drive being tested. Please consider the results displayed by this benchmark to be basic bandwidth speed performance indicators. Our basic bandwidth speed tests begin with both SandForce SSDs connected to the Intel ICH10 controller in RAID-0 4K-stripe mode, as the ATTO Disk Benchmark tools performs file transfers ranging from 0.5 KB to 8192 KB. The 4KB striped set of SF-1200 SSDs reveals a 471 MB/s maximum read speed that plateaus from about 4-8192 KB file chunks, and 448 MB/s peak write bandwidth plateaus from 64-8192 KB.
SandForce SF-1200 SSDs in RAID-0 using 4KB StripesWith the RAID-0 SandForce SSDs configured with 128K-stripes, ATTO Disk Benchmark reports dramatically different results. The 128KB striped set of SF-1200 SSDs reveals a 579 MB/s peak read speed that plateaus from about 8-8192 KB file chunks, and 545 MB/s peak write bandwidth plateaus from 128-8192 KB.
SandForce SF-1200 SSDs in RAID-0 using 128KB StripesOur results for ATTO Disk Benchmark are illustrated in the chart below, with positions determined by total combined bandwidth:
Drive Hardware
In the next section, Benchmark Reviews tests sequential performance using the CrystalDiskMark 3.0 software tool... CrystalDiskMark 3.0 TestsCrystalDiskMark 3.0 is a file transfer and operational bandwidth benchmark tool from Crystal Dew World that offers performance transfer speed results using sequential, 512KB random, and 4KB random samples. For our test results chart below, the 4KB 32-Queue Depth read and write performance was measured using a 1000MB space. CrystalDiskMark requires that an active partition be set on the drive being tested, and all drives are formatted with NTFS on the Intel ICH10 controller set to AHCI-mode. Benchmark Reviews uses CrystalDiskMark to illustrate operational IOPS performance with multiple threads. In addition to our other tests, this benchmark allows us to determine operational bandwidth under heavy load. Sequential tests on the SF-1200 RAID-0 4KB striped set produced a maximum read speed of 365.0 MB/s, while the write speed was only 150.6 MB/s. Oddly enough, reported sequential write speed actually increased with each test. The sequential file transfer speeds have traditionally been low with this benchmark tool, especially for SandForce controllers, which is why we will concentrate on the operational IOPS performance for this section. CrystalDiskMark 3.0 reported 512K results of 312.9 MB/s read and 150.8 MB/s write performance, which are about 50% higher than a single disk. 4K tests produced 18.18 read and 67.56 write performance, which is similar to a single SandForce SF-1200 SSD. 4KB queue depth 32 IOPS is one area where the RAID-0 SSDs excel, and nearly doubles the single-drive performance.
SandForce SF-1200 SSDs in RAID-0 using 4KB StripesSimilar to AS-SSD and ATTO Benchmark tests, CrystalDiskMark revealed immediate gains in regard to sequential transfer performance where RAID-0 128KN stripe sets were used. Sequential read speed soared to 443.8 MB/s (over 365 MB/s), while write performance was roughly the same. Generally speaking, 512K and 4K transfers were also very similar, with a slight edge in relation to read tests. 4KB queue depth 32 IOPS performance improved by 10 MB/s for read tests, but was only 3 MB/s better in write tests.
SandForce SF-1200 SSDs in RAID-0 using 128KB StripesDisplayed in the chart below, the maximum 4KB queue depth 32 IOPS performance results for several enthusiast-level storage products illustrate which products offer the best operation under load:
Drive Hardware
Iometer IOPS PerformanceIometer is an I/O subsystem measurement and characterization tool for single and clustered systems. Iometer does for a computer's I/O subsystem what a dynamometer does for an engine: it measures performance under a controlled load. Iometer was originally developed by the Intel Corporation and formerly known as "Galileo". Intel has discontinued work on Iometer, and has gifted it to the Open Source Development Lab (OSDL). Iometer is both a workload generator (that is, it performs I/O operations in order to stress the system) and a measurement tool (that is, it examines and records the performance of its I/O operations and their impact on the system). It can be configured to emulate the disk or network I/O load of any program or benchmark, or can be used to generate entirely synthetic I/O loads. It can generate and measure loads on single or multiple (networked) systems. To measure random I/O response time as well as total I/O's per second, Iometer is set to use 4KB file size chunks over a 100% random sequential distribution. The tests are given a 50% read and 50% write distribution. While this pattern may not match traditional 'server' or 'workstation' profiles, it illustrates a single point of reference relative to our product field. Our charts show the Read and Write IOPS performance as well as I/O response time (measured in ms). Iometer was configured to test for 120 seconds, and after five tests the average is displayed in our benchmark results. The first tests included random read and write IOPS performance, where a higher I/O is preferred.
In the Random IOPS performance tests the single layer cell (SLC) OCZ Agility EX (3982/3988), Intel X25-E Extreme (3543/3548), and OCZ Vertex EX (3106/3091) outperformed all other products by a wide margin. Combined into a RAID-0 array using 4KB stripes, the pair of SandForce SF-1200 SSDs only led their individual counterparts by a small margin, and 128KB stripes were virtually the same as a single SSD. The RAID-0 set produced 2205/2204 IOPS, while the individual ADATA S599 SSD produced 2087/2081 I/O's, Corsair F100 delivered 2077/2076, and the RunCore Pro-V recorded 2021/2015. Indilinx-based MLC SSDs start with the Corsair Nova delivering 1982/1995, then the OCZ Vertex Turbo SSD rendered 1774/1770, while the Corsair recorded 1769/1773; both of which are just slightly ahead of a single Vertex SSD that produced 1702 for read and write IOPS. Finishing out the second-tier IOPS performance is the WD SiliconEdge-Blue with 1625/1632 and OCZ Agility SSD with 1625/1618 IOPS. The SATA 6Gb/s Crucial RealSSD-C300 produced 1070 read-IOPS with 1069 write, and creates a third-level tier of operational performance suitable for personal computer systems. Kingston's SSDNow V+ SNVP325 offered 826/829 IOPS. Every other product thereafter responded with low IOPS operational performance, and are not suggested for high input/output applications or performance-orientated computer systems.
The Iometer random IOPS average response time test results were nearly an inverse order of the IOPS performance results. It's no surprise that SLC drives perform I/O processes far better than their MLC versions, but that gap is slowly closing as controller technology improves the differences and enhances cache buffer space. The Read/Write IOPS performance for the 64GB OCZ Agility-EX SLC SSD was 0.19/0.06 ms, with the Intel X25-E Extreme SSD measuring 0.22/0.06 ms, while the OCZ Vertex-EX achieved 0.26/0.06 ms. Stripe size didn't impact response time. Our pair of RAID-0 SandForce SSDs responded to IO commands in 0.23/0.23, which isn't much quicker than a single SF-1200 SSD. The ADATA S599, Corsair F100, RunCore Pro-V (all SandForce SF-1200 SSDs), each produced 0.25/0.25 ms. The Corsair X256 and OCZ Vertex Turbo SSD both scored 0.50/0.06ms, while the Vertex SSD offered 0.52/0.06ms. The mainstream Agility SSD produced 0.55/0.06ms while Western Digital's SiliconEdge-Blue offered 0.51/0.11ms, the Corsair Nova delivered 0.57/0.09ms, Crucial's 256GB RealSSD C300 responded in 0.87/0.06ms, and the second-generation Kingston SSDNow V+ SNVP325 responded to read requests in 0.27ms while write requests were a bit slower at 0.93ms. The Western Digital VelociRaptor did very well compared against SSD products, producing 6.59/0.82ms. These times were collectively the best available, as each product measured hereafter performed much slower. Drive Hardware
In our next section, we test linear read and write bandwidth performance and compare its speed against several other top storage products using EVEREST Disk Benchmark. Benchmark Reviews feels that linear tests are excellent for rating SSDs, however HDDs are put at a disadvantage with these tests whenever capacity is high. EVEREST Disk BenchmarkMany enthusiasts are familiar with the Lavalys EVEREST benchmark suite, but very few are aware of the Disk Benchmark tool available inside the program. The EVEREST Disk Benchmark performs linear read and write bandwidth tests on each drive, and can be configured to use file chunk sizes up to 1MB (which speeds up testing and minimizes jitter in the waveform). Because of the full sector-by-sector nature of linear testing, Benchmark Reviews endorses this method for testing SSD products, as detailed in our Solid State Drive Benchmark Performance Testing article. However, Hard Disk Drive products suffer a lower average bandwidth as the capacity draws linear read/write speed down into the inner-portion of the disk platter. EVEREST Disk Benchmark does not require a partition to be present for testing, so all of our benchmarks are completed prior to drive formatting. The high-performance storage products tested with EVEREST Disk Benchmark are connected to the Intel ICH10 controller on the Gigabyte GA-X58A-UD7 motherboard. Using the 1MB block size, read performance of the SandForce SF-1200 RAID-0 SSD 4KB stripe set measured an average 437.7 MBps with a similar maximum peak of 245.2 MBps. Linear write-to tests were next...
SandForce SF-1200 SSDs in RAID-0 using 4KB StripesUsing 128KB stripes, read performance of the SandForce SF-1200 RAID-0 set measured an average 470.5 MBps with a maximum peak speed of 482.6 MBps. Up to this point, read performance has been better with larger 128KB RAID-0 stripe sizes. Linear write-to tests were next...
SandForce SF-1200 SSDs in RAID-0 using 128KB StripesLinear disk benchmarks are superior tools in my opinion, because they scan from the first physical sector to the last. A side affect of many linear write-performance test tools is that the data is erased as it writes to every sector on the drive. Normally this isn't an issue, but it has been shown that partition table alignment will occasionally play a role in overall SSD performance (HDDs don't suffer this problem). The combined SandForce RAID-0 SSDs recorded an average linear write-to speed of 458.9 MBps, with a maximum performance of 477.1 MBps using 4KB stripes.
SandForce SF-1200 SSDs in RAID-0 using 4KB StripesWith 128KB RAID-0 stripes, write speeds were down 12 MB/s but peak speeds were the same. An average 446.7 MB/s write speed was not far from the 476.7 MB/s peak performance, but still trailed 4KB stripe size results.
SandForce SF-1200 SSDs in RAID-0 using 128KB StripesThe chart below shows the average linear read and write bandwidth speeds for a cross-section of SATA storage devices tested with EVEREST:
I personally consider linear tests to be the single most important comparison of storage drive products, although HDD products suffer performance degradation over the span of their storage capacity. Linear bandwidth certainly benefits the Solid State Drive, since there's very little fluctuation in transfer speed. This is because Hard Disk Drive products decline in performance as the spindle reaches the inner-most sectors on the magnetic platter, away from the fast outer edge. Drive Hardware
In the next section, I share my final thoughts on the struggle between SSD and HDD technology before delivering my conclusion and final product rating. SSD vs Hard Disk DriveThe last days of old technology are always better than the first days of new technology. Never has this saying been more true than with the topic of storage technology, specifically in regard to the introduction of Solid State Drive technology a few years ago. The only things standing in the way of widespread Solid State Drive (SSD) adoption are high storage capacity and affordable price of Hard Disk Drive (HDD) devices. Because NAND flash-based SSD technology costs more per gigabyte of capacity than traditional magnetic hard drives, the benefits of immediate response time, transfer speeds, and operational input/output performance often get overlooked. Like most consumer products, it wasn't a question of how much improvement was evident in the new technology, it was price. I'll discuss product costs more in just a moment, but for now consider how each new series of SSD product employs greater performance than the one before it, convincing would-be consumers into waiting for the right time to buy. There's also a gray area surrounding SSD performance benchmarks that has me concerned. You might not know this, but SSDs can be very temperamental towards the condition of their flash NAND. My experience testing dozens of Solid State Drives is that a freshly cleaned device (using an alignment tool) will always outperform the same device once it's been formatted and used. A perfect example is Indilinx Barefoot-based SSDs, which suffers severely degraded performance when writing to 'dirty' flash NAND. The reason that all of this will matters is simple: the performance results reported to consumers in product reviews (such as this one) often report the very best performance scores, and the process used to obtain these results is not applicable to real-world usage. This is where garbage collection techniques such as TRIM become important, so that end-users will experience the same performance levels as we do in our tests.
Garbage Collection (GC) is the current solution for keeping flash NAND in 'clean' condition, while maintaining optimal performance. Windows 7 offers native TRIM support, and most retail SSDs also include this special GC function or at least offer a firmware update that brings the drive up-to-date. For anyone using an Operating System or SSD that does not offer Garbage Collection functionality, you'll be using 'dirty' flash NAND modules and suffering sub-optimal performance for each write-to request. A few SSD manufacturers offers free tools to help restore peak-level performance by scheduling GC to 'clean' used NAND sectors, but these tools add excessive wear to the NAND the same way disk defragmenting tools would. SLC flash modules may resist wear much better than MLC counterparts, but come at the expense of increased production cost. The best solution is a more durable NAND module that offers long-lasting SLC benefits at the cost of MLC construction. Adoption is further stalled because keen consumers aware of this dilemma further continue their delay into the SSD market. Getting back to price, the changes in cost per gigabyte have come as often as changes to the technology itself. At their inception, high-performance models such the 32GB MemoRight GT cost $33 per gigabyte while the entry-level 32GB Mtron MOBI 3000 sold for $14 per gigabyte. While an enjoyable decline in NAND component costs forced consumer SSD prices down low in 2009, the price of SSD products has been on the rise during 2010. Nevertheless, Solid State Drives continue to fill store shelves despite price or capacity, and there are a few SSD products now costing only $2.03 per gigabyte. Although the performance may justify the price, which is getting dangerously close to the $1.00 per gigabyte WD VelociRaptor hard drive, costs may still close some buyers out of the market. Price notwithstanding, the future is in SSD technology and the day when HDDs are obsolete is nearing; but there are still a few bumps in the road to navigate. SandForce RAID-0 ConclusionAll SandForce SSD controllers offer native TRIM support in Microsoft Windows-7, Native Command Queuing (NCQ) with 32 command slots, and Self-Monitoring, Analysis, and Reporting Technology (SMART) command set. Intel's ICH-10 SATA controller allows pass-through TRIM functionality, but it does not work with RAID arrays - even with their latest Intel Rapid Storage Technology (RST) software. Regardless, The SF-1200 SSD processor provides ECC data protection and includes SandForce's unique RAISE (Redundant Array of Independent Silicon Elements) technology. RAISE provides the protection and reliability of RAID on a single SSD drive, thanks to flash architecture, without the significant write overhead of parity. The SandForce DuraClass technology automatically stores data in AES-128 encrypted format, preventing data extraction directly from the physical flash memory modules. Unlike most product review articles we publish, Benchmark Reviews has approached the conclusion to this project a little differently. Since the SandForce SF-1222TA3-SBH processor has already become the centerpiece for so many popular SSDs, the combination of any two SandForce SF1200-based storage products into a RAID-0 array can apply here. Benchmark Reviews has individually tested the ADATA S599, Corsair Force F100, and RunCore Pro-V SSDs, which all produce virtually identical single-SSD performance results, but the PhotoFast G-Monster 2, OCZ Agility-2, Mach Xtreme, and OWC Mercury Extreme SSDs could also be used to create a RAID array. After considering the sum of our SSD test results, it appears that RAID-0 can often deliver nearly twice the performance of a single SandForce SF-1200 SSD. While not every test produced impressive results, many did, and the added sequential file transfer performance may be worth the risk of sacrificed data redundancy. In regard to RAID-0 stripe size, our tests demonstrated a clear preference for 128KB stripes over the much smaller 4KB alternative. Sequential read speeds increased from 471 MB/s to 579 MB/s in ATTO Disk Benchmark, and write performance jumped from 448 MB/s to 545 MB/s by using 128KB stripes. Operational IOPS performance didn't offer the same level of improved performance, and 4KB stripes occasionally outperformed the 128KB size. For enthusiasts, deciding between a single SandForce SF-1200 SSD and a pair of SSDs combined into a RAID-0 array will depend on the intended workload tasks. Because the risk of a data disaster is much higher with RAID-0, this configuration will likely be used by performance hardware enthusiasts since corporate enterprise IT professionals generally demand some level of data redundancy. Although the costs might prohibit the possibility, three SSDs combined into a RAID-5 set may provide the best mix of data striping and failover data redundancy. Depending on the outcome of our results, Benchmark Reviews may publish a follow-up article featuring three SandForce SF-1200 SSDs combined into a RAID-5 array. Compared against these RAID-0 results, chances are very good that performance will be similar between the two formats. Since RAID-0 uses the same two striped drives but lacks the overhead of an alternating data parity drive, RAID-5 test results may not offer any improvement other than data redundancy. Of course, the only way to prove this theory is through many hours of testing. As of May 2010 the Corsair Force F100 CSSD-F100GB2-BRKT Solid State Drive kit is available online for $410, or $4.10 per Gigabyte of storage capacity. Alternatively, the 200GB Corsair Force F200 SSD is available for $720, or 3.60 per Gigabyte. As prices for other SandForce SSDs becomes available, we will update this article. In conclusion, the idea of enjoying a RAID-0 striped array seems like a nice idea for high-performance PC hardware enthusiasts, but for twice the cost of an already-expensive product you don't necessarily receive twice the user experience. ATTO and other benchmarks may report a dramatic increase in sequential file transfer performance, but unless you're moving data on a regular basis there will be a very minimal real-world improvement over any single SSD. Ultimately I do not recommend RAID-0, regardless of HDD or SSD used. Even with a test proven back-up procedure in place, all it takes is one minor data problem to render the entire set a disaster. Of course, if you're more concerned with absolute maximum performance, then a pair of SandForce SF-1200 SSDs combined into a 128KB-stripe RAID-0 array will stretch that smile from ear to ear. Pros:
+ Impressive 579/545 MBps read/write speed with ATTO Cons:
- Currently all RAID controllers lack pass-through TRIM support Comments? Questions? Benchmark Reviews appreciates constructive feedback, so leave your comment below are ask questions in our Discussion Forum.
Related Articles:
|
|||||||||||||||||||||||||||||||||||||||||||||||||||||||||||||||||||||||||||||||||||||||||


Comments
However the SanForce controller is not over-hyped. The products are still exponentially over priced but I must now watch SSD's and view them as a product to consider when the prices reach below SAS at near offered capacities.
Great review again!
Please also test with 2 x Crucial RealSSD C300 in RAID 0,
even if it's necessary to use the software RAID in Windows
+ an inexpensive 6G controller like the ASUS PCIE GEN2 SATA6G
controller.
And, comparing other host controllers would also be a good test
e.g. Highpoint 640, Intel's RS2BL040, and the integrated
6G ports on AMD's latest 890FX chipsets on motherboards by
ASUS, MSI and Gigabyte.
Until more SSDS conform to the current standard,
we will just have to wait and see what happens
to market prices for 3G and 6G products
when both are widely available.
That's why I'm waiting (for now).
MRFS
I only have one Crucial C300 SSD, and there aren't any plans to purchase a second unit. I do have a RAID-capable SATA 6Gb/s controller, if you or anyone else would like to loan one out. Comparing host controllers would be interesting, but since it would be specific to brands and drivers I'm not confident of the articles' shelf life.
In reality, a single SSD of any denomination will deliver virtually the same end-user experience as a RAID-0 array.
Also- I used Intel Rapid Storage Technology Driver 9.6.0.1014 for this article.
so the following comments are for the benefit of
other readers:
We recently added 2 cheap SATA/6G ports with this ASUS
PCIE GEN2 SATA6G controller -- only $20 at Newegg here:
#newegg.com/Product/Product.aspx?Item=N82E16813131610&Tpk=N82E16813131610
Yes, that card does NOT support RAID.
So, we had no trouble enabling XP's software RAID 0
with 2 x new WD 1TB SATA/6G HDDs:
#newegg.com/Product/Product.aspx?Item=N82E16822136533&Tpk=N82E16822136533
Just convert partitions to "dynamic disks" and you're almost there.
Can someone loan Olin one more Crucial C300 SSD, maybe Crucial,
so he can compare software RAID 0 with 2 x SATA/6G SSDs?
It might even work with Intel's latest Rapid Storage Technology
set to JBOD on both devices.
Until then ...
... keep up the good work, Olin!
MRFS
OS Software Raid solutions can alter the testing results when compared to Hardware Raid. This is due to caching, CPU utilization(compute) , increased latency(I/O), and even performance increases in Software configured Raid benchmarks that would not appear in Hardware configured Raid benchmarks(such as queuing/scheduling and the like).
-just some thoughts, but I'm sure Benchmark Reviews will keep having thorough reviews.
As for using the the PCIe-based SATA 6Gb/s add-in cards for a RAID array, or even a compatible SAS controller, the PCI-Express bus is still limited to 5GB/s bandwidth.
As I posted earlier, now that controllers like this SandForce are out I am going to focus on SSD's considerably more. I'll scrutinize the prices on SSD's considerably more as well!
I agree that this has been a major marketing tool
of HBA vendors, but a lot of those vendors began
their HBA marketing when CPUs had only one core.
Now, with dual and quad-core CPUs quite common,
the idle core(s) can do a lot of the same computation
that was previously done by dedicated IOPs.
Multi-cores, in turn, can make software RAID
a very cost-effective proposition, e.g.
for the 8 GB database that we manage and
update cheaply with XCOPY.
MRFS
But back to Olin Coles testing with HBA/Raid Controllers...
Way to go! That's the industry wide accepted standard for most RAID. Software RAID would really change the benchmarks, and probably greatly when considering SSD's. But that would be a great article right there. Since so much technology has changed, what is the performance and benching differences between Software and Hardware RAID today on SSD's and HDD's? Perhaps coming soon to Benchmark reviews?
#en.wikipedia.org/wiki/PCI_Express#PCI_Expr ess_2.0
"... a 32-lane PCI connector (x32) can support throughput up to 16 GB/s aggregate."
Thus, PCI-E 2.0 x16 lanes support 8 GB/second bandwidth.
Did you mean 5 Gigabits per second, instead of 5 Gigabytes per second?
I think you must be referring to a single PCI-E 2.0 x1 lane,
in only one direction.
PCI-E 1.0 x1 lane has a bandwidth of 2.5 Gb/sec in each direction;
PCI-E 2.0 x1 lane has a bandwidth of 5.0 Gb/sec in each direction.
Quadruple each for x4 lanes, and double that again for x8 lanes e.g.
Highpoint RocketRAID 2720 or Intel RS2BL080.
The edge connector on the add-in card is a quick indicator
of a RAID card's rated bandwidth.
MRFS
Tech at OCZ explained overprovisioning as a MAJOR FACTOR in the usable lifespan of an MLC ssd.
I am using it as my major drive because it is bootable too.
When installing these you must install windows while the bios is set for ACHI for the best performance.
Also turn off indexing and all the "performance" enhancing options in windows.
Windows is SO MUCH FASTER. The internet on the slowest DSL is so much improved.
I have asus ma4a89gtd pro/usb3 (stock athlon II 635 4 core 2.9GHZ processor + windows 7 pro) and the drive set up to usb 6gbs - but I don't think usb3 makes any speed difference.