| MSI N560GTX Ti Hawk Video Card |
| Reviews - Featured Reviews: Video Cards | |||||||||||||||||||||||||||||||||||||||||||||||||||||||||||||||||||||||||||||||||||||||||||||||||||||||||||||||||||||||||||||||||||||||||||||||||||||||||||||||||||||||||||||||||||||||||||||||||||||||||||||||||||||||||||||||||||||||||||||||||||||||||||||||||||||||||||||||||||||||||||||||||||||||||||||||||||||||||||||||||||||||||||||||||||||||||||||||||||||||||||||||||||||||||||||||||||||||||||||||||||||||||||||||||||||||||||||||||||||||||||||||||||||||||||||||||||||||||||||||||||||||||||||||||||||||||||||||||||||||||||||||||||||||||||||||||||||||||||||||||||||||||||||||||||||||||||||||||||||||||||||||||||||||||||||||||||||||||||||||||||||||||||||||||||||||||||||||||||||||||||||||||||||||||||||||||||||||||||||||||||||||||||||||||||||||||||||||||||||||||||||||||||||||||||||||||||||||||||||||||||||||||||||||||||||||||||||||||||||||||||||||||||||||||||||||||||||||||||||||||||||||||||
| Written by Steven Iglesias-Hearst | |||||||||||||||||||||||||||||||||||||||||||||||||||||||||||||||||||||||||||||||||||||||||||||||||||||||||||||||||||||||||||||||||||||||||||||||||||||||||||||||||||||||||||||||||||||||||||||||||||||||||||||||||||||||||||||||||||||||||||||||||||||||||||||||||||||||||||||||||||||||||||||||||||||||||||||||||||||||||||||||||||||||||||||||||||||||||||||||||||||||||||||||||||||||||||||||||||||||||||||||||||||||||||||||||||||||||||||||||||||||||||||||||||||||||||||||||||||||||||||||||||||||||||||||||||||||||||||||||||||||||||||||||||||||||||||||||||||||||||||||||||||||||||||||||||||||||||||||||||||||||||||||||||||||||||||||||||||||||||||||||||||||||||||||||||||||||||||||||||||||||||||||||||||||||||||||||||||||||||||||||||||||||||||||||||||||||||||||||||||||||||||||||||||||||||||||||||||||||||||||||||||||||||||||||||||||||||||||||||||||||||||||||||||||||||||||||||||||||||||||||||||||||||
| Thursday, 19 May 2011 | |||||||||||||||||||||||||||||||||||||||||||||||||||||||||||||||||||||||||||||||||||||||||||||||||||||||||||||||||||||||||||||||||||||||||||||||||||||||||||||||||||||||||||||||||||||||||||||||||||||||||||||||||||||||||||||||||||||||||||||||||||||||||||||||||||||||||||||||||||||||||||||||||||||||||||||||||||||||||||||||||||||||||||||||||||||||||||||||||||||||||||||||||||||||||||||||||||||||||||||||||||||||||||||||||||||||||||||||||||||||||||||||||||||||||||||||||||||||||||||||||||||||||||||||||||||||||||||||||||||||||||||||||||||||||||||||||||||||||||||||||||||||||||||||||||||||||||||||||||||||||||||||||||||||||||||||||||||||||||||||||||||||||||||||||||||||||||||||||||||||||||||||||||||||||||||||||||||||||||||||||||||||||||||||||||||||||||||||||||||||||||||||||||||||||||||||||||||||||||||||||||||||||||||||||||||||||||||||||||||||||||||||||||||||||||||||||||||||||||||||||||||||||||
MSI N560GTX Ti Hawk Video Card
Manufacturer: MicroStar International Full Disclosure: The product sample used in this article has been provided by MSI. NVIDIA have completely blown away their previous generation GPU's with the introduction of the GTX 5xx line up and while they are 'good enough' at stock speeds, it's normal for AIB partners to push these GPU's to their limits. MSI have tweaked the GeForce GTX 560Ti to 950MHz GPU / 1050MHz Memory, given it the 'Hawk' moniker, slapped on a Twin Frozr III cooler and sent it out into the wild to show the world what it is made of. Price wise the MSI N560GTX-Ti Hawk will obviously set you back more than a reference GTX 560Ti but in return it delivers stellar performance and excellent cooling capability. The MSI N560GTX-Ti Hawk has the standard 1GB memory with a 256-bit wide memory interface giving it 134.4GB/s memory bandwidth. The 40nm manufacturing process of the GF114 GPU allows NVIDIA's foundry's to cut 1.95 billion (1,950,000,000) transistors into the GPU core, a crazy feat of modern engineering. The Hawk also supports 'Triple Over Voltage' out of the box with the right version of MSI Afterburner (2.2.0 Beta 2). Benchmark Reviews aims to provide you with an unbiased review of the MSI N560GTX-Ti Hawk and report back our findings, keeping you informed on the latest technologies available on the market today.
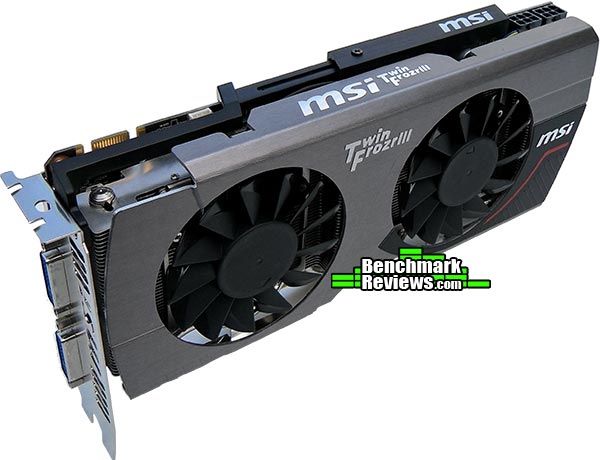
For this review we have a wide range of video card comparisons in our usual mixture of DX10 / DX11 synthetic benchmarks and current games to get a good idea where it fits in performance and price wise. We also intend to overclock the GPU to its limits and see if the Twin Frozr III cooler with its improved fan design has what it takes to cool the GPU and other components effectively, so without further delay let's move on and get stuck in. Closer Look: MSI N560GTX Ti HawkLet's take a good look at the MSI N560GTX-Ti Hawk's exterior, later we shall strip it down to see what secrets the Hawk is hiding. The image below shows a very professional looking video card, it measures 24.4cm long x 11.6cm tall and is a true dual slot design.
The guts of the MSI Twin Frozr III cooler are well hidden by the gun-metal color aluminum shroud. This shroud improves over the previous Twin Frozr II design and looks much less hideous and much more functional. Twin 92mm 'Propeller Blade' fans dominate the front face of the GTX 560Ti Hawk and complete the aesthetics.
Looking along the spine of the GTX 560Ti Hawk we see a new feature that is starting to grace modern GeForce GPU's. I am talking of course about the semi aesthetic, fully functional re-enforcement bar that stops the card warping over time due to the weight of the Twin Frozr III cooler. Anyone who has installed an aftermarket cooler in the past has noticed that the sheer weight will pull the card down and cause it to warp, thankfully this problem is now alleviated.
The MSI N560GTX-Ti Hawk requires two 6-pin PCI-E power connectors from your PSU, while MSI includes two molex to 6-pin adapter cables it is highly recommended to use a PSU that already has these connectors present.
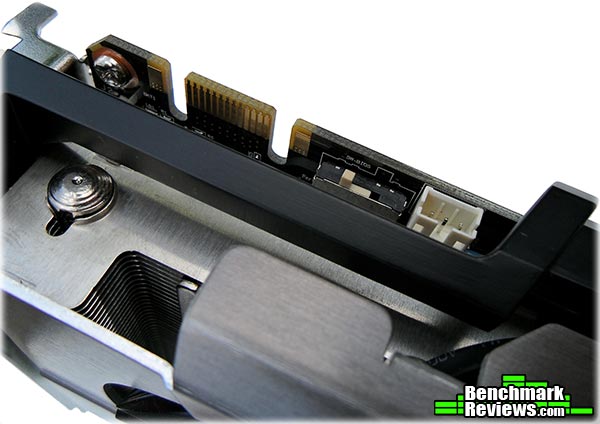
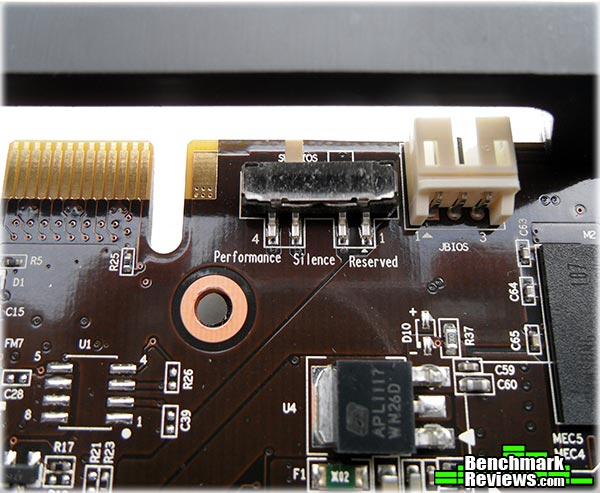
As is the norm we see only one SLI finger so 2-way SLI is all you will get from the MSI N560GTX-Ti Hawk. Next to the SLI connector is a cooling profile switch, we will look at this in more detail later in the review along with the unidentified header to its right.
At the rear of the card are three V-check points, MSI include little adapters for these to make it easier to take readings with a multi-meter which we will look at closer later in the review. In my opinion it would be much easier to take said readings if the V-check points were in a much more accessible place.
For output we have a mini HDMI connector and two DVI-I connectors, bundled with the card you get a mini HDMI to HDMI adapter and a DVI to D-SUB adapter, so as far as connectors go MSI has pretty much covered all the bases here. The top half of the PCI bracket is vented and we have a nice MSI logo cut out, but the design of the cooler exhausts the hot air inside the case rather than out here.
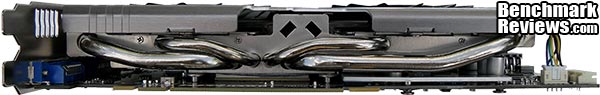
In this side profile view we see that the Twin Frozr III cooler make full use of the dual slot dimensions. Two 8mm and two 6mm heatpipes emerge here and transport the GPU heat to the aluminum fin array of the Twin Frozr III heatsink.
Removing the cooler assembly reveals yet another heatsink, MSI have dubbed this the 'Form-in-one' heatsink and it covers all of the memory IC's and the power circuitry. There is a slight bit of overkill with the thermal paste here but nothing that can't be remedied, the temperature recordings are good so only us perfectionists need worry about cleaning and refining here.
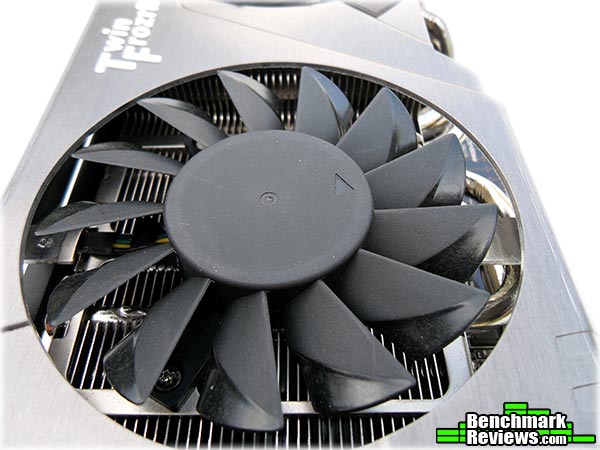
The Twin Frozr III design incorporates two 92mm propeller blade PWM fans introduced by MSI on their Cyclone II coolers. These fans have proven track record for cooling ability but they are not the quietest when running at full speed, thankfully you won't need to ramp them up to 100% to get optimum performance as they cool very effectively on their auto cycle with minimal noise disruption. MSI N560GTX Ti Hawk DetailsThe gloves are off now so to speak as we take a more detailed look at the MSI N560GTX-Ti Hawk video card.
The MSI GTX 560Ti Hawk sports a chocolate brown PCB which makes a nice difference from the bright colors we have bocome accustomed to with the video cards of old. In the 'MSI hierarchy' the Hawk is typically one step below the Lightning (MSI's top end card of which a GTX 560Ti variant doesn't exist as yet) and includes a few goodies not found on other models. In this section we will take a look at these.
First up we have the P/S switch, this switch allows you to select between Silent mode (lower noise but higher GPU temperature) and Performance mode (lower GPU temperature but more noise from the fan). There is no real question as to my preferred mode but it's nice to have a choice. You might also notice that there is a third option labelled Reserved, the function of this setting is undisclosed so selecting it might well be tempting fate. To the right we see the unidentified header, my best guess is that it is a simple programming interface for the performance profiles, but I don't know this for sure. It could even be just a 3-pin fan header.
A close up here of the V-check points seen earlier. MSI didn't make clear in their supplied documentation which point was which and I had to remove the cooler assembly to reveal the secret. Clearly labelled from top to bottom are; V-GPU, V-MEM and V-PLL. These correspond with the triple over voltage feature supported by the N560GTX-Ti Hawk from MSI, although the range of over voltage leaves a little room for improvement (+150mV for GPU, +80mV for MEM and +30mV for AUX/PLL).
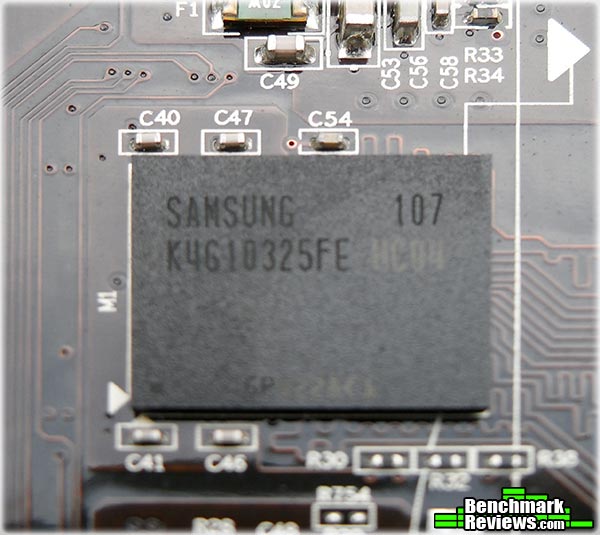
Eight Samsung K4G10325FE HC04 128MB modules make up the 1GB of memory available. Loosely translated the code tells us that these GDDR5 modules are rated 1.5v and operate 0.40ns 5GB/s and are Halogen free commercial modules.
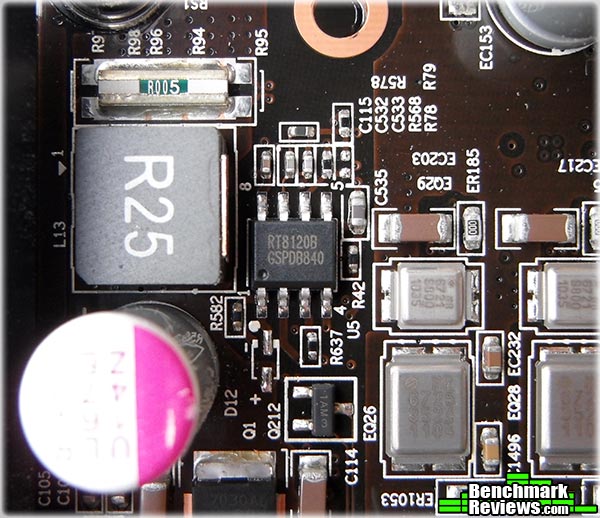
The RT8120 is a single-phase synchronous buck PWM DC/DC voltage controller manufactured by Richtek Technology Corporation.
For voltage control MSI have utilized the uP6218AM VRM Controller.
The rear of the PCB is a fairly well populated and there is a nice surprise here for the curious enthusiasts lurking out there.
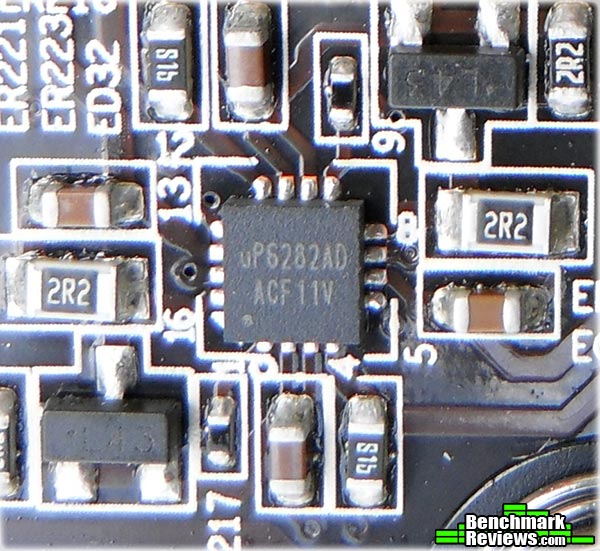
Four uP6282AD Mosfet Drivers from uPI Semiconductor Corp control 2 phases each for a total of 8 phases.
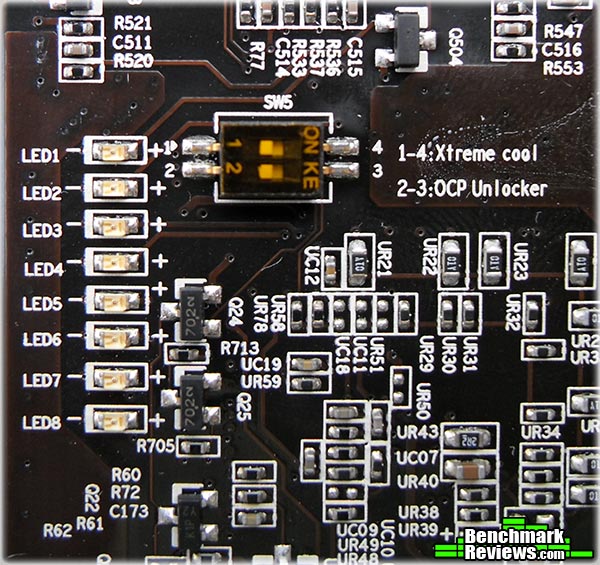
And here is that little surprise I mentioned earlier, in the form of PWM activity LED's and some extra switch goodness. Firstly I would like to talk a little about the PWM activity LED's, if you are a energy conscious user then you will be happy to learn that MSI include a little app that automatically reduces PWM phase usage to conserve power when they are not needed. In the image below you will see that they glow pretty bright red when active. Secondly let's ponder the uses of the OCP Unlocker and Xtreme cool switches, these type of switches are usually reserved for MSI's Lightning series of cards. OCP stands for over current protection and enabling this option would deliver more current for a more stable overclock. Xtreme cool is less obvious, I can only assume it is for sub-zero overclocking support (to aid with cold bug boots etc).
Let's take a little time to look at the features and specifications of the N560GTX-Ti Hawk from MSI and then we will get straight into performance testing. MSI N560GTX Ti Hawk Features
MSI N560GTX Ti Hawk Specifications
Source: MSI Computer Corp. VGA Testing MethodologyThe Microsoft DirectX-11 graphics API is native to the Microsoft Windows 7 Operating System, and will be the primary O/S for our test platform. DX11 is also available as a Microsoft Update for the Windows Vista O/S, so our test results apply to both versions of the Operating System. The majority of benchmark tests used in this article are comparative to DX11 performance, however some high-demand DX10 tests have also been included. According to the Steam Hardware Survey published for the month ending April 2011, the most popular gaming resolution is 1920x1080 with 1680x1050 hot on its heels, our benchmark performance tests concentrate on these higher-demand resolutions: 1.76MP 1680x1050 and 2.07MP 1920x1080 (22-24" widescreen LCD monitors), as they are more likely to be used by high-end graphics solutions, such as those tested in this article. In each benchmark test there is one 'cache run' that is conducted, followed by five recorded test runs. Results are collected at each setting with the highest and lowest results discarded. The remaining three results are averaged, and displayed in the performance charts on the following pages. A combination of synthetic and video game benchmark tests have been used in this article to illustrate relative performance among graphics solutions. Our benchmark frame rate results are not intended to represent real-world graphics performance, as this experience would change based on supporting hardware and the perception of individuals playing the video game.
Intel P55 Test System
DirectX-10 Benchmark Applications
DirectX-11 Benchmark Applications
Video Card Test Products
DX10: 3DMark Vantage3DMark Vantage is a PC benchmark suite designed to test the DirectX10 graphics card performance. FutureMark 3DMark Vantage is the latest addition the 3DMark benchmark series built by FutureMark corporation. Although 3DMark Vantage requires NVIDIA PhysX to be installed for program operation, only the CPU/Physics test relies on this technology. 3DMark Vantage offers benchmark tests focusing on GPU, CPU, and Physics performance. Benchmark Reviews uses the two GPU-specific tests for grading video card performance: Jane Nash and New Calico. These tests isolate graphical performance, and remove processor dependence from the benchmark results.
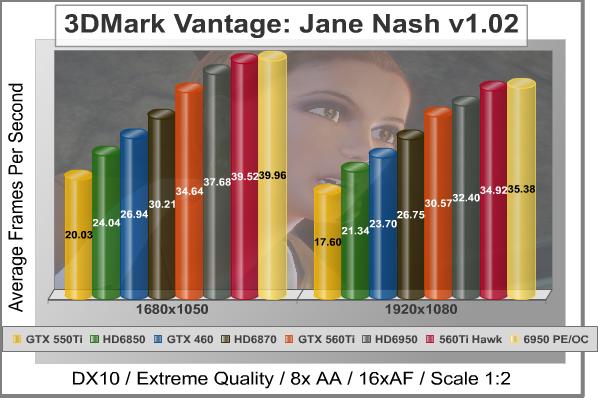
3DMark Vantage GPU Test: Jane NashOf the two GPU tests 3DMark Vantage offers, the Jane Nash performance benchmark is slightly less demanding. In a short video scene the special agent escapes a secret lair by water, nearly losing her shirt in the process. Benchmark Reviews tests this DirectX-10 scene at 1680x1050 and 1920x1080 resolutions, and uses Extreme quality settings with 8x anti-aliasing and 16x anisotropic filtering. The 1:2 scale is utilized, and is the highest this test allows. By maximizing the processing levels of this test, the scene creates the highest level of graphical demand possible and sorts the strong from the weak.
Cost Analysis: Jane Nash (1680x1050)Test Summary: For one priceless moment, in the whole history of man... all of the results scale appropriately, as one would expect when looking at the stats of the video card line-up. However, due to different aspects that go into game making processes, you will see very varied results throughout this performance analysis. The MSI GTX 560Ti Hawk increases it's worth over the stock 560Ti by $0.50 per FPS and matches the HD6870 and HD6950 for value. 3DMark Vantage GPU Test: New CalicoNew Calico is the second GPU test in the 3DMark Vantage test suite. Of the two GPU tests, New Calico is the most demanding. In a short video scene featuring a galactic battleground, there is a massive display of busy objects across the screen. Benchmark Reviews tests this DirectX-10 scene at 1680x1050 and 1920x1080 resolutions, and uses Extreme quality settings with 8x anti-aliasing and 16x anisotropic filtering. The 1:2 scale is utilized, and is the highest this test allows. Using the highest graphics processing level available allows our test products to separate themselves and stand out (if possible).
Cost Analysis: New Calico (1680x1050)Test Summary: The tables have turned in the New Calico Vantage test, here the results show that the FERMI architecture is the more advanced. The performance gap is minimal across the board though, with the MSI GTX 560Ti Hawk beating the MSI 6950 TF3 PE/OC card by 3~5 FPS. Once again the Hawk shows that it offers great value when we analyse the cost per FPS results.
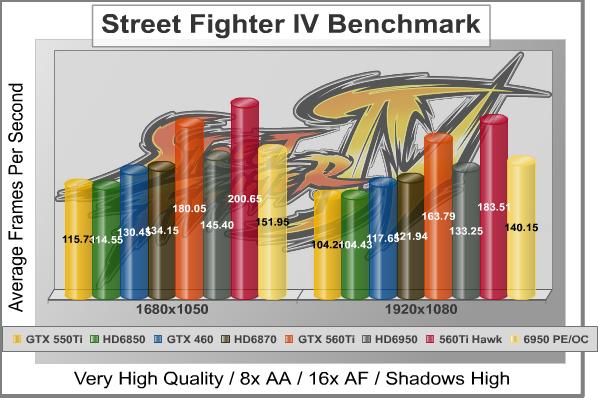
DX10: Street Fighter IVCapcom's Street Fighter IV is part of the now-famous Street Fighter series that began in 1987. The 2D Street Fighter II was one of the most popular fighting games of the 1990s, and now gets a 3D face-lift to become Street Fighter 4. The Street Fighter 4 benchmark utility was released as a novel way to test your system's ability to run the game. It uses a few dressed-up fight scenes where combatants fight against each other using various martial arts disciplines. Feet, fists and magic fill the screen with a flurry of activity. Due to the rapid pace, varied lighting and the use of music this is one of the more enjoyable benchmarks. Street Fighter IV uses a proprietary Capcom SF4 game engine, which is enhanced over previous versions of the game. Using the highest quality DirectX-10 settings with 8x AA and 16x AF, a mid to high end card will ace this test, but it will still weed out the slower cards out there.
Cost Analysis: Street Fighter IV (1680x1050)Test Summary: The Street Fighter IV test comes across a little biased towards the green team, perhaps the good old 'NVIDIA The way it's meant to be played' logo displayed when you launch the benchmark gives that away. As you will see later in the performance analysis, this analogy is turned on its head when a game that was touted as an NVIDIA game (METRO 2033)actually performs better on AMD hardware when PhysX is disabled. Street Fighter IV is a very fast paced game but the MSI GTX560Ti Hawk is simply overkill.
DX11: Aliens vs PredatorAliens vs. Predator is a science fiction first-person shooter video game, developed by Rebellion, and published by Sega for Microsoft Windows, Sony PlayStation 3, and Microsoft Xbox 360. Aliens vs. Predator utilizes Rebellion's proprietary Asura game engine, which had previously found its way into Call of Duty: World at War and Rogue Warrior. The self-contained benchmark tool is used for our DirectX-11 tests, which push the Asura game engine to its limit. In our benchmark tests, Aliens vs. Predator was configured to use the highest quality settings with 4x AA and 16x AF. DirectX-11 features such as Screen Space Ambient Occlusion (SSAO) and tessellation have also been included, along with advanced shadows.
Cost Analysis: Aliens vs Predator (1680x1050)Test Summary: In the Alien vs Predator benchmark it is the turn of the AMD hardware to show what it is made of. Even with its extreme overclock the MSI GTX 560Ti Hawk struggles to match even a stock HD6950. If this is your sort of game you would be best to own an ATI card. The MSI GTX 560Ti Hawk still delivers respectable frame rates at both resolutions.
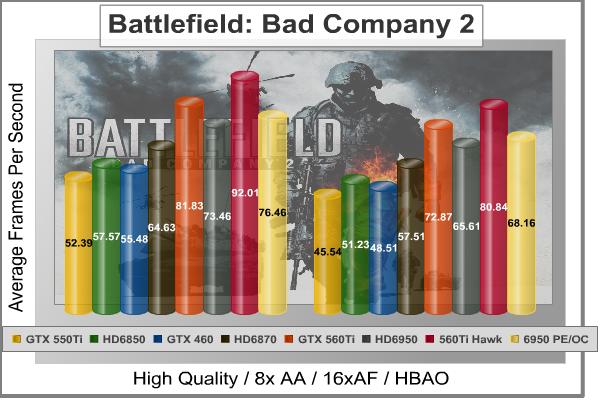
DX11: Battlefield Bad Company 2The Battlefield franchise has been known to demand a lot from PC graphics hardware. DICE (Digital Illusions CE) has incorporated their Frostbite-1.5 game engine with Destruction-2.0 feature set with Battlefield: Bad Company 2. Battlefield: Bad Company 2 features destructible environments using Frostbit Destruction-2.0, and adds gravitational bullet drop effects for projectiles shot from weapons at a long distance. The Frostbite-1.5 game engine used on Battlefield: Bad Company 2 consists of DirectX-10 primary graphics, with improved performance and softened dynamic shadows added for DirectX-11 users. At the time Battlefield: Bad Company 2 was published, DICE was also working on the Frostbite-2.0 game engine. This upcoming engine will include native support for DirectX-10.1 and DirectX-11, as well as parallelized processing support for 2-8 parallel threads. This will improve performance for users with an Intel Core-i7 processor. Unfortunately, the Extreme Edition Intel Core i7-980X six-core CPU with twelve threads will not see full utilization. In our benchmark tests of Battlefield: Bad Company 2, the first three minutes of action in the single-player raft night scene are captured with FRAPS. Relative to the online multiplayer action, these frame rate results are nearly identical to daytime maps with the same video settings. The Frostbite-1.5 game engine in Battlefield: Bad Company 2 appears to equalize our test set of video cards, and despite AMD's sponsorship of the game it still plays well using any brand of graphics card.
Cost Analysis: Battlefield: Bad Company 2 (1680x1050)Test Summary: As DirectX 11 titles go, Battlefield: Bad Company 2 is not the most demanding. Even the low end GTX 550Ti can deliver above standard frame rates. The good news is that you can rest assured that your video card won't be the cause of your lag in BF: BC2.
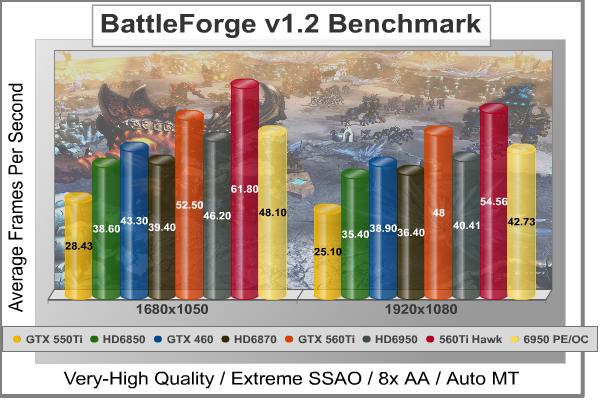
DX11: BattleForgeBattleForge is free Massive Multiplayer Online Role Playing Game (MMORPG) developed by EA Phenomic with DirectX-11 graphics capability. Combining strategic cooperative battles, the community of MMO games, and trading card gameplay, BattleForge players are free to put their creatures, spells and buildings into combination's they see fit. These units are represented in the form of digital cards from which you build your own unique army. With minimal resources and a custom tech tree to manage, the gameplay is unbelievably accessible and action-packed. Benchmark Reviews uses the built-in graphics benchmark to measure performance in BattleForge, using Very High quality settings (detail) and 8x anti-aliasing with auto multi-threading enabled. BattleForge is one of the first titles to take advantage of DirectX-11 in Windows 7, and offers a very robust color range throughout the busy battleground landscape. The charted results illustrate how performance measures-up between video cards when Screen Space Ambient Occlusion (SSAO) is enabled.
Cost Analysis: BattleForge (1680x1050)Test Summary: Battleforge with all the settings cranked up looks very nice indeed, once again the FERMI based video cards offer better performance over their AMD rivals in this title. Cost per FPS is the same for GTX460 and MSI GTX 560TiHawk, the question now is... How much power does one need?
DX11: Lost Planet 2Lost Planet 2 is the second instalment in the saga of the planet E.D.N. III, ten years after the story of Lost Planet: Extreme Condition. The snow has melted and the lush jungle life of the planet has emerged with angry and luscious flora and fauna. With the new environment comes the addition of DirectX-11 technology to the game. Lost Planet 2 takes advantage of DX11 features including tessellation and displacement mapping on water, level bosses, and player characters. In addition, soft body compute shaders are used on 'Boss' characters, and wave simulation is performed using DirectCompute. These cutting edge features make for an excellent benchmark for top-of-the-line consumer GPUs. The Lost Planet 2 benchmark offers two different tests, which serve different purposes. This article uses tests conducted on benchmark B, which is designed to be a deterministic and effective benchmark tool featuring DirectX 11 elements.
Cost Analysis: Lost Planet 2 (1680x1050)Test Summary: Lost Planet 2 is a tough cookie to crack, in our tests we had to use relatively moderate settings just to get some acceptable numbers. This game wants high level hardware to play maxed out. The GTX 560Ti is indeed an amazing piece of hardware to behold, delivering above average frame rates at a much lower cost/performance ratio.
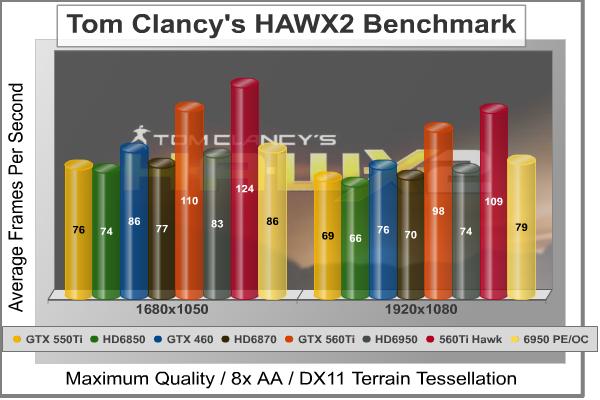
DX11: Tom Clancy's HAWX 2Tom Clancy's H.A.W.X.2 has been optimized for DX11 enabled GPUs and has a number of enhancements to not only improve performance with DX11 enabled GPUs, but also greatly improve the visual experience while taking to the skies. The game uses a hardware terrain tessellation method that allows a high number of detailed triangles to be rendered entirely on the GPU when near the terrain in question. This allows for a very low memory footprint and relies on the GPU power alone to expand the low resolution data to highly realistic detail. The Tom Clancy's HAWX2 benchmark uses normal game content in the same conditions a player will find in the game, and allows users to evaluate the enhanced visuals that DirectX-11 tessellation adds into the game. The Tom Clancy's HAWX2 benchmark is built from exactly the same source code that's included with the retail version of the game. HAWX2's tessellation scheme uses a metric based on the length in pixels of the triangle edges. This value is currently set to 6 pixels per triangle edge, which provides an average triangle size of 18 pixels. The end result is perhaps the best tessellation implementation seen in a game yet, providing a dramatic improvement in image quality over the non-tessellated case, and running at playable frame rates across a wide range of graphics hardware.
Cost Analysis: HAWX 2 (1680x1050)Test Summary: HAWX 2 is a strange game in that you need to look very close to see the difference in quality settings, the main difference is in the terrain but this is easily overlooked as you are busy fighting with the controls just to fly in a straight line. The GTX 560Ti pummels on all of the video cards in this line up, beating them in both FPS performance and price per FPS, but all of the other cards also deliver excellent frame rates. The landscapes are beautifully rendered making the game scenery pleasurable, now I just need to master the controls.
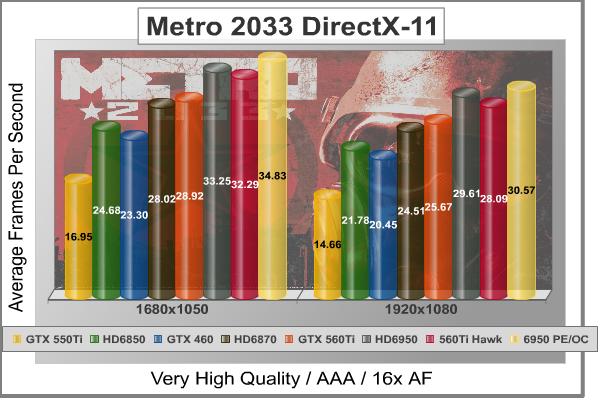
DX11: Metro 2033Metro 2033 is an action-oriented video game with a combination of survival horror, and first-person shooter elements. The game is based on the novel Metro 2033 by Russian author Dmitry Glukhovsky. It was developed by 4A Games in Ukraine and released in March 2010 for Microsoft Windows. Metro 2033 uses the 4A game engine, developed by 4A Games. The 4A Engine supports DirectX-9, 10, and 11, along with NVIDIA PhysX and GeForce 3D Vision. The 4A engine is multi-threaded in such that only PhysX had a dedicated thread, and uses a task-model without any pre-conditioning or pre/post-synchronizing, allowing tasks to be done in parallel. The 4A game engine can utilize a deferred shading pipeline, and uses tessellation for greater performance, and also has HDR (complete with blue shift), real-time reflections, color correction, film grain and noise, and the engine also supports multi-core rendering. Metro 2033 featured superior volumetric fog, double PhysX precision, object blur, sub-surface scattering for skin shaders, parallax mapping on all surfaces and greater geometric detail with a less aggressive LODs. Using PhysX, the engine uses many features such as destructible environments, and cloth and water simulations, and particles that can be fully affected by environmental factors. NVIDIA has been diligently working to promote Metro 2033, and for good reason: it's one of the most demanding PC video games we've ever tested. When their flagship GeForce GTX 480 struggles to produce 27 FPS with DirectX-11 anti-aliasing turned to to its lowest setting, you know that only the strongest graphics processors will generate playable frame rates. All of our tests enable Advanced Depth of Field and Tessellation effects, but disable advanced PhysX options.
Cost Analysis: Metro 2033 (1680x1050)Test Summary: Metro 2033 is hard on all video cards, and in our tests only the factory overclocked video cards delivered acceptable frame rates. It is also rather apparent that the AMD GPU's deliver better performance across the board when compared to their theoretical rivals. This game was intended to be played with PhysX enabled and we all know this is something only NVIDIA cards can do well at the moment, hopefully in the future we might see PhysX code that is better optimized for multi-core CPU's.
DX11: Unigine Heaven 2.1The Unigine Heaven 2.1 benchmark is a free publicly available tool that grants the power to unleash the graphics capabilities in DirectX-11 for Windows 7 or updated Vista Operating Systems. It reveals the enchanting magic of floating islands with a tiny village hidden in the cloudy skies. With the interactive mode, emerging experience of exploring the intricate world is within reach. Through its advanced renderer, Unigine is one of the first to set precedence in showcasing the art assets with tessellation, bringing compelling visual finesse, utilizing the technology to the full extend and exhibiting the possibilities of enriching 3D gaming. The distinguishing feature in the Unigine Heaven benchmark is a hardware tessellation that is a scalable technology aimed for automatic subdivision of polygons into smaller and finer pieces, so that developers can gain a more detailed look of their games almost free of charge in terms of performance. Thanks to this procedure, the elaboration of the rendered image finally approaches the boundary of veridical visual perception: the virtual reality transcends conjured by your hand. Although Heaven-2.1 was recently released and used for our DirectX-11 tests, the benchmark results were extremely close to those obtained with Heaven-1.0 testing. Since only DX11-compliant video cards will properly test on the Heaven benchmark, only those products that meet the requirements have been included.
Cost Analysis: Unigine Heaven (1680x1050)Test Summary: Unigine heaven is also quite hard on video cards, only the best video cards will be able to run it smooth at the highest settings, certain parts of this benchmark put more work on the GPU than others. With the exception of the GTX 460 and overclocked MSI 6950 results we see nearly perfect scaling in the line-up. The high overclock on the MSI GTX 560Ti Hawk certainly makes a lot of difference in our tests. In the following sections we will report our findings on power consumption and overclocking.
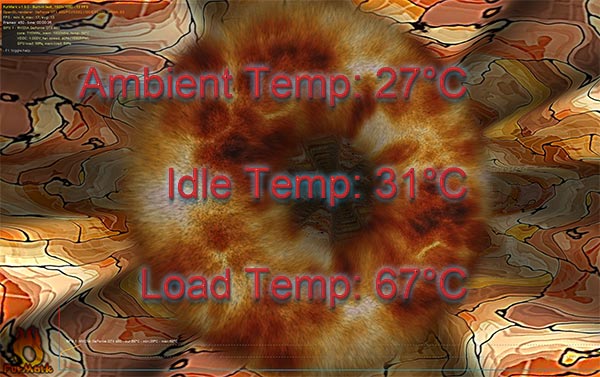
MSI N560GTX Ti Hawk TemperaturesBenchmark tests are always nice, so long as you care about comparing one product to another. But when you're an overclocker, gamer, or merely a PC hardware enthusiast who likes to tweak things on occasion, there's no substitute for good information. Benchmark Reviews has a very popular guide written on Overclocking Video Cards, which gives detailed instruction on how to tweak a graphics cards for better performance. Of course, not every video card has overclocking head room. Some products run so hot that they can't suffer any higher temperatures than they already do. This is why we measure the operating temperature of the video card products we test. To begin my testing, I use GPU-Z to measure the temperature at idle as reported by the GPU. Next I use FurMark's "Torture Test" to generate maximum thermal load and record GPU temperatures at high-power 3D mode. The ambient room temperature remained at a stable 27°C throughout testing. FurMark does two things extremely well: drive the thermal output of any graphics processor higher than applications of video games realistically could, and it does so with consistency every time. Furmark works great for testing the stability of a GPU as the temperature rises to the highest possible output. The temperatures discussed below are absolute maximum values, and not representative of real-world performance.
As previously stated my ambient temperature remained at a stable 27°C throughout the testing procedure, the Twin Frozr cooler is very efficient and a heavy load from FurMark raises the temperature from 31°C (40% fan speed) idle to 67°C load with an automatic fan speed of 59%. Putting the fan on manual and cranking it up to 100% saw the temperature drop to 62°C but the noise level at max speed is far from quiet. A 5°C improvement in temperature is all well and good but I would personally reserve using 100% fan speeds for when the GPU reaches above 80°C. 
In the next section we will look at power consumption figures, let's go. VGA Power ConsumptionLife is not as affordable as it used to be, and items such as gasoline, natural gas, and electricity all top the list of resources which have exploded in price over the past few years. Add to this the limit of non-renewable resources compared to current demands, and you can see that the prices are only going to get worse. Planet Earth needs our help, and needs it badly. With forests becoming barren of vegetation and snow capped poles quickly turning brown, the technology industry has a new attitude towards turning "green". I'll spare you the powerful marketing hype that gets sent from various manufacturers every day, and get right to the point: your computer hasn't been doing much to help save energy... at least up until now. For power consumption tests, Benchmark Reviews utilizes an 80-Plus Gold rated Corsair HX750w (model: CMPSU-750HX) This power supply unit has been tested to provide over 90% typical efficiency by Ecos Plug Load Solutions. To measure isolated video card power consumption, I used the energenie ENER007 power meter made by Sandal Plc (UK). A baseline test is taken without a video card installed inside our test computer system, which is allowed to boot into Windows-7 and rest idle at the login screen before power consumption is recorded. Once the baseline reading has been taken, the graphics card is installed and the system is again booted into Windows and left idle at the login screen. Our final loaded power consumption reading is taken with the video card running a stress test using FurMark. Below is a chart with the isolated video card power consumption (not system total) displayed in Watts for each specified test product:
* Results are accurate to within +/- 5W.
At Idle the MSI GTX 560Ti Hawk consumes 47 (166-119) watts at idle and 227 (346-119) watts when running full load using the test method outlined above. The MSI GTX 560Ti Hawk uses more power at idle and at load than the reference GTX 560Ti (17W idle / 199W load), this can be attributed to the above average overclock. The idle power consumption can be lowered by installing the bundled MSI 'APS' utility that automatically controls the usage of PWM phases to save power when they are not essential. As we can see in the GPU-Z screenshot below the MSI GTX 560Ti Hawk uses 0.95v when idle, when under load it uses 1.062v.
In the next section we will be discussing our overclocking adventure with the MSI GTX 560Ti Hawk. MSI N560GTX Ti Hawk OverclockingBefore I start overclocking I like to get a little bit of information, firstly I like to establish operating temperatures and since we know these are well within specifications we can quickly move on. Next I like to know what the voltage and clock limits are, so I fired up the bundled MSI Afterburner utility. I established that vCore was adjustable between 825mV and 1150mV and clock speeds were limited to 1350MHz max on the GPU (linked Shaders 2700MHz) and 3500MHz DDR (7GHz effective!!!) maximum frequency for the memory. This is more than enough range to move forward with, armed with this info I know I can squeeze every last drop of performance out of the MSI GTX 560Ti Hawk. My preferred weapons are MSI Afterburner (v2.2.0 Beta 3) for fine tuning while using FurMark (v1.9.0) to load the GPU.
Above is a reminder of the temperature and clock speeds of the MSI GTX 560Ti Hawk, everything looked as if the Hawk was going to break some serious barriers but sadly it wasn't to be. During my overclocking session with FurMark the MSI GTX 560Ti Hawk had passed the 1GHz GPU barrier (1067MHz) but it proved to be unstable during benchmark testing. It wasn't until I reduced the GPU clock speed to 990MHz (+81mV GPU voltage) that stability was again established. Memory overclocks became unstable above 2230MHz DDR (4.4GHz effective) despite an 80mV voltage increase on the memory voltage. Due to time constraints I wasn't able to experiment further with clock speeds and the potential stability enhancements from enabling OCP via the switch on the rear side of the PCB. I fully intend to experiment further with overclocking the MSI GTX 560Ti Hawk as I believe this card has more potential, until then though the increases in performance from this round of overclocking are displayed below.
With a 40MHz GPU overclock (168MHz over reference design) and a 65MHz memory overclock (113MHz over reference design) we went back to the bench and ran through the entire test suite. Overall there is an average 3.88% increase in scores (at 1920x1080 resolution). We also re ran temperature tests at the overclocked speeds with a slightly lower ambient temperature of 26°C. The Twin Frozr III cooler on the MSI N560GTX-Ti Hawk once again did not fail to please, at idle the GPU sat at 36°C (40% fan speed). Pushing the temperature up with FurMark saw the GPU load temperature rise to 75°C (71% fan speed) and cranking the fan on manual to 100% saw the temperature drop to 71°C. That's all of the testing over for now, in the next section I will deliver my final thoughts and conclusion. MSI N560GTX Ti Hawk Final ThoughtsI am overall very impressed with the performance of the MSI N560GTX-Ti Hawk, in most tests it was able to better a stock HD6950 and an overclocked HD6950 where a stock NVIDIA GTX 560Ti would not be able to. MSI really know how to build a great video card and our results have proved this today, this card is certainly worthy of the HAWK moniker and my only hope is that further experimentation will yield better overclocking results. The Twin Frozr III is essentially the same as the Twin Frozr II. The main differences between the two are; 1) Improved 'Propeller Blade' fans, 2) MSI's 'Form-in-one' heatsink covering all of the memory and power circuitry, and 3) An improved shroud design that not only enhances the aesthetic qualities of the cooler, but also covers the aluminum fin array much better. These enhancements culminate to make the overclocked GTX 560Ti Hawk run cooler than a GTX 560Ti with a reference design cooler when under load. MSI N560GTX Ti Hawk ConclusionImportant: In this section I am going to write a brief five point summary on the following categories; Performance, Appearance, Construction, Functionality and Value. These views are my own and help me to give the MSI N560GTX-Ti Hawk Video Card a rating out of 10. A high or low score does not necessarily mean that it is better or worse than a similar video card that has been reviewed by another writer here at Benchmark Reviews, which may have got a higher or lower score. It is however a good indicator of whether the MSI N560GTX-Ti Hawk is good or not. I would strongly urge you to read the entire review, if you have not already, so that you can make an educated decision for yourself.
The graphics performance of the MSI N560GTX-Ti Hawk is way above standard, sure other GTX 560Ti cards may be able to reach this core clock but the Hawk does it out of the box. In seven out of our ten tests the 560Ti Hawk manages to beat not only a stock speed HD6950 but also an overclocked variant of the HD6950, this is something a reference design GTX 560Ti is unable to achieve. The appearance of the MSI N560GTX-Ti Hawk is, as I'm sure you will agree, very nice indeed. The side view is given extra attention thanks to the anti-warp edge support and shroud design that provide both function and aesthetics. These additions are relatively simple but it makes all the difference once you install the card into your system. There are some that will surely disagree but thanks to the graphic nature of this review you can easily make your mind up for yourself. One thing is for sure, the Twin Frozr III design really makes the Twin Frozr II look ugly. Construction is excellent as you would expect from a company with a good reputation like MSI, there were some slightly missed areas during the cleaning process but it is nothing major as it only hurts the aesthetics and not the performance. Taking the card to pieces and reconstructing it was a breeze and everything lined up perfectly, the Twin Frozr III cooler is solid and really adds some weight. This gives the feel of confidence when handling the card that you won't break it. Functionality is very good, I can't help but keep singing praise for the Twin Frozr III cooler, it really is so good. The MSI Afterburner and Kombustor utilities are very handy when it comes to overclocking and stress testing your video card. The bundled APS (Auto Phase Switching) utility should help reduce power consumption by disabling power phases when they are not needed, I would have prefered if it would run without confirmation after every boot but it only takes 2 clicks to enable it. The V-Check points and the fan profile switch add a whole new level of functionality to the GTX 560Ti and will give enthusiasts something extra to play with. The MSI N560GTX-Ti Hawk video card is available now for $264.99 at NewEgg.com at this price point it is only a small premium over the average price of $249.99 for a standard GTX 560Ti. Throughout our tests the price/performance ratio is very appealing indeed, but the GTX460 has come down in price recently and still offers excellent overall cost/performance. The very high factory overclock and quality cooler design are this cards main selling point. Pros:
|
|||||||||||||||||||||||||||||||||||||||||||||||||||||||||||||||||||||||||||||||||||||||||||||||||||||||||||||||||||||||||||||||||||||||||||||||||||||||||||||||||||||||||||||||||||||||||||||||||||||||||||||||||||||||||||||||||||||||||||||||||||||||||||||||||||||||||||||||||||||||||||||||||||||||||||||||||||||||||||||||||||||||||||||||||||||||||||||||||||||||||||||||||||||||||||||||||||||||||||||||||||||||||||||||||||||||||||||||||||||||||||||||||||||||||||||||||||||||||||||||||||||||||||||||||||||||||||||||||||||||||||||||||||||||||||||||||||||||||||||||||||||||||||||||||||||||||||||||||||||||||||||||||||||||||||||||||||||||||||||||||||||||||||||||||||||||||||||||||||||||||||||||||||||||||||||||||||||||||||||||||||||||||||||||||||||||||||||||||||||||||||||||||||||||||||||||||||||||||||||||||||||||||||||||||||||||||||||||||||||||||||||||||||||||||||||||||||||||||||||||||||||||||||


Comments
* Not to mention a fine effort again from you guys:)
1)They are nickel plated copper heatpipes.
2)I have not actually reviewed a video card with the twin frozr II, but if you look at Bruce Norman's review of the MSI N560GTX-Ti Twin Frozr II here at BmR /index.php?option=com_content&task=view&id=689&Itemid=72&limit=1&limitstart=1 you will see they are essentially the same cooler with a different shroud and different fans (as I described in my final thoughts). The extra $$ is not necessarily just for the cooler but the different features the Hawk card has over the Twin Frozr II card.
Hope this helps.
Hope this helps.
MSI's bizarre marketing aside, the cooler seems to be the best custom air cooler on the market right now.
I've got a pretty hard to answer question!! I'm totally confused to buy this card (MSI N560 GTX Ti hawk)or ATI HD 6950 2GB reference version and flash it to HD 6970 2GB which is quit stronger than this card.But I don't know anything about the risks of this flashing process and consequences. The price of this card (MSI) is about 30$ cheaper than 2GB version of 6950 in our country. But XFX version of 6950 2gb has the same price as the MSI card has.What do you say Steven? (power consumption of this card is higher than HD 6950)
Thank you very much.
Buying a reference 6950 to flash to a 6970 is a risky choice. First you must find a compatible BIOS and then of course you have to flash it.
If the flash goes wrong or you use an incompatible BIOS you will only see a blank screen next time you boot, some 6950's have dual BIOS switch to overcome this issue but some don't. If the flash does not work out you will have to install another card in slot one and the failed flash card in slot 2 and use the -i function of atiflash to detect the correct GPU to and reflash the BIOS to the correct card.
For example where the failed GPU is in slot 2 the command "atiflash -i" would list any installed GPU's starting with 0 upwards, the second card would typically be 1. The command to reflash that would be "atiflash -r -f 1 biosname.bin"
While the GTX560Ti HAWK has higher power consumption, my testing shows that it is better than the 6950 2gb at the tested resolutions in most tests.
If you do manage to flash a HD6950 to a HD6970 you would see a big rise in power consumption and heat production but obviously you would get much better FPS.
What are your thoughts?
The one 6950 I've played with that would flash to 6970 would always crash under heavy load, probably because it only had a single 6-pin power connector, rather than the dual 6-pin power connectors a "real" 6970 has.
Bottom line: if you can flash your 6950 to a 6970 and it runs well, great, but don't buy any 6950 expecting to be able to do this.
no i see it have only 18 Amps available per lane (12x18=216w)
you think is possible to use it or ill better start looking for a single lane ( CM Silent Pro M850)
thanks in advance for reply