| MSI N560GTX-Ti GeForce Video Card |
| Reviews - Featured Reviews: Video Cards | ||||||||||||||||||||||||||||||||||||||||||||||||||||||||||||||||||||||||||||||||||||||||||||||||||||||||||||||||||||||||||||||||||||||||||||||||||||||||||||||||||||||||||||||||||||||||||||||||||||||||||||||||||||||||||||||||||||||||||||||||||||||||||||||||||||||||||||||||||||||||||||||||||||||||||||||||||||||||||||||||||||||||||||||||||||||||||||||||||||||||||||||||||||||||||||||||||||||||||||||||||||||||||||||||||||||||||||||||||||||||||||||||||||||||||||||||||||||||||||||||||||||||||||||||||||||||||||||||||||||||||||||||||||||||||||||||||||||||||||||||||||||||||||||||||||||||||||||||||||||||||||||||||||||||||||||||||||||||||||||||||||||||||||||||||||||||||||||||||||||||||||||||||||||||||||||||||||||||||||||
| Written by Bruce Normann | ||||||||||||||||||||||||||||||||||||||||||||||||||||||||||||||||||||||||||||||||||||||||||||||||||||||||||||||||||||||||||||||||||||||||||||||||||||||||||||||||||||||||||||||||||||||||||||||||||||||||||||||||||||||||||||||||||||||||||||||||||||||||||||||||||||||||||||||||||||||||||||||||||||||||||||||||||||||||||||||||||||||||||||||||||||||||||||||||||||||||||||||||||||||||||||||||||||||||||||||||||||||||||||||||||||||||||||||||||||||||||||||||||||||||||||||||||||||||||||||||||||||||||||||||||||||||||||||||||||||||||||||||||||||||||||||||||||||||||||||||||||||||||||||||||||||||||||||||||||||||||||||||||||||||||||||||||||||||||||||||||||||||||||||||||||||||||||||||||||||||||||||||||||||||||||||||||||||||||||||
| Sunday, 30 January 2011 | ||||||||||||||||||||||||||||||||||||||||||||||||||||||||||||||||||||||||||||||||||||||||||||||||||||||||||||||||||||||||||||||||||||||||||||||||||||||||||||||||||||||||||||||||||||||||||||||||||||||||||||||||||||||||||||||||||||||||||||||||||||||||||||||||||||||||||||||||||||||||||||||||||||||||||||||||||||||||||||||||||||||||||||||||||||||||||||||||||||||||||||||||||||||||||||||||||||||||||||||||||||||||||||||||||||||||||||||||||||||||||||||||||||||||||||||||||||||||||||||||||||||||||||||||||||||||||||||||||||||||||||||||||||||||||||||||||||||||||||||||||||||||||||||||||||||||||||||||||||||||||||||||||||||||||||||||||||||||||||||||||||||||||||||||||||||||||||||||||||||||||||||||||||||||||||||||||||||||||||||
MSI N560GTX-Ti Twin Frozr II/OC ReviewHistory always repeats itself, and NVIDIA is hoping for a repeat performance with their new GTX 560 Ti video card. They've applied the same tweaks to the GF104 GPU that brought the high-end Fermi cards back from the dead, and now have the GF114 in place to do battle in the upper mid-market. NVIDIA launched the GTX 460 about six months ago, and it has been the darling of the gaming community since then. With performance per mm2 and per watt numbers that put the first Fermi chips to shame, it deserves all the success it has enjoyed. It was also an amazing overclocker, so its performance profile is hard to pin down and it's a moving target from a marketing perspective.
It's hard to say that the GTX 560 Ti represents what the GTX 460 should have been at its launch, because the GTX 460 was such a success. The key to this achievement was largely pricing, though. At a price point that significantly undercut the Radeon HD 5850, it offered similar performance on older titles and crushed it in any wrestling match that involved heavy tessellation. The GTX 560 Ti does the same thing to the new crop of Radeon cards, slotting in at the HD 6870 price level, but offering better performance. MSI is also repeating the same steps they used with the GTX 460 to capture the interest of graphics overclocking enthusiasts. Their Twin Frozr II design offered a massive upgrade in performance compared to the stock cooling scheme, and it helped achieve a world record of 1.0 GHz on air cooling for the GTX 460. Fast forward to this week and MSI has launched an upgraded GTX 560 Ti video card at the same time that the reference design is hitting the market. The MSI N560GTX-Ti Twin Frozr II/OC model offers up a modest 7% factory overclock, but I'm guessing there's more where that came from. Benchmark Reviews takes full advantage of MSI's hardware upgrade, as we explore the full potential of NVIDIA's latest midrange marvel on our test bed.
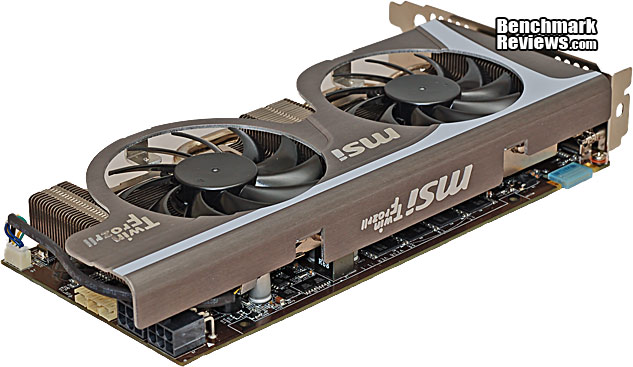
Manufacturer: Micro-Star Int'l Co., Ltd (MSI) Full Disclosure: The product sample used in this article has been provided by MSI. Closer Look: MSI N560GTX-Ti Twin Frozr II/OCThe MSI N560GTX-Ti Twin Frozr II/OC follows the same design spec of the original N460GTX Hawk video card that we reviewed back in September. The Twin Frozr II cooling system is a well proven package that kept the GF104 GPU quite cool, even during stress testing. It's quiet, it looks good, and it offers top-tier performance; MSI would have to be crazy to not capitalize on their prior good work here. It's probably overkill for the GF104/114 class of GPU, but when it comes to cooling, I genuinely like overkill. On my test rig, I run a 38mm Delta AFB1212SHE fan on a Prolimatech Megahalems, which should tell you everything....
The fan shroud is a very open design; there is not much chance that a big portion of the airflow is being directed to the rear outlet. After the air passes through the fin assembly, it hits the components mounted on the face of the card, at the two ends. The center section is taken up by a large copper mounting plate, and the four heat pipes. The two fans are identical, 80mm four-wire PWM types, and have an indicated maximum operating speed of 4400 RPM.
With high-end video cards, the cooling system is an integral part of the performance envelope for the card. Make it run cooler, and you can make it run faster has been the byword for achieving gaming-class performance with all the latest and greatest GPUs. The MSI N560GTX-Ti Twin Frozr II/OC has a massive cooler device, compared to the reference design; the fin assembly is nearly the same size as the board itself. Although the NVIDIA design now offers three copper heatpipes, instead of only two on the GTX 460, two of the four heatpipes on the MSI Twin Frozr II are 8mm diameter, compared to the standard 6mm pipes on a lot of coolers. One feature that this card does without is the extended baseplate that acts as a heatsink/spreader on the reference design and covers all of the power circuitry and memory modules.
The layout of the various elements of the cooler design is a little easier to see in this straightforward view from the GPU's perspective. All GPUs produce a fair amount of heat, so make sure your chassis has plenty of airflow in the right direction, in order to move hot air out of the case. This cooler design is not particularly suited to multi-card SLI applications, but as the MSI Cyclone versions have shown, getting the heat out of the GPU and transferring it to the air is really the most important part of the job. Where that heat goes is something you definitely need to look at, as some PC gaming cases are much better at moving air through the VGA Zone than others.
The two 6mm and two 8mm diameter heatpipes are clamped between the thick nickel-plated copper mounting plate and the aluminum fin assembly, passing directly over the wider dimension of the GPU heat spreader. Once they exit from there, they spread to the outer reaches of the long aluminum fin assemblies. Considering the power density of modern GPU devices, it makes sense to contact every square millimeter of the top surface with the heatsink if you can. The GF114 chip, like most NVIDIA GPU packages has a very large heat spreader mounted to it, and the copper mounting plate covers it completely. The threaded standoffs are indirectly mounted to the plate, via brackets on each side, and they seemed very solid. The thermal interface material (TIM) was very evenly distributed by the factory, but was applied slightly thicker than necessary. One day, anxious manufacturing engineers are going to figure out that too little TIM is better than too much. For the rest of us who pay attention to these things, a thorough discussion of best practices for applying TIM is available here.
The power for the MSI N560GTX-Ti enters into two 6-pin PCI Express connector at the far end of the board, with the connectors facing out the back. This is not the preferred orientation for those trying to squeeze a powerful graphics card into a small chassis, but in a typical gaming case I like the cable routing better with this arrangement. On the back side of the board at this end, are six LEDs that show you the amount of power being drawn by the card. The main PWM controller for the GPU Voltage Regulator Modules (VRM) provides the signal to drive the LEDs. In the next section, let's take a more detailed look at some of the components on this decidedly non-reference board. I did a quick tear-down, so we could see the highlights... MSI N560GTX-Ti Twin Frozr II/OC Detailed FeaturesThe memory choice for the MSI N560GTX-Ti Twin Frozr II/OC is consistent with the NVIDIA reference designs. The basic GTX 560 specs only require 1,000 MHz chips for the memory, but many cards have been using these Samsung K4G10325FE-HC04 GDDR5 parts, which are designed for up to 1250 MHz. The GTX 460 cards have shown some gains in gaming performance with increases in memory speed, much more so that the ATI HD 5xxx series has. These 1250 MHz versions of this chip have also been mediocre overclockers on the Radeon platform; we'll have to see if they are a little more willing to run wide open with a GeForce GPU in the saddle.
The layout on the front and back of the printed circuit board is very typical for a high-end video card. The major power supply components are mounted towards the back end of the board, close to the PCI Express power connectors, and they get excellent cooling directly from the rear fan. The lack of any heatsinks on the 12 power MOSFETs in the VRM section is a question mark, but the fact that there are so many of them, means there is more surface area to dissipate heat.
The main power supply controller chip used on the MSI N560GTX-Ti is a uP6213A chip from UPI Semiconductor. It is a 3/4 Phase PWM control IC that does not support I2C software voltage control, however the BIOS provides its own software control that interfaces with the controller at the hardware level. The VRM section uses 3 of the phases from this controller, and then splits each phase in two, to get a total of six phases for powering the GPU alone. Most of the boards on the market are getting by with the four phases provided by the reference design, and they seem to work well, even with some fairly serious overclocking. All else being equal, doubling up on the phases does give cleaner power to the GPU, and MSI was intent on getting all the performance they could from this little GF114 powerhouse.
The N560GTX-Ti uses standard discrete packaging for the N-Channel MOSFET power transistors in the VRM section. This discrete implementation gives up the opportunity to save a little space, but it does give the designer a broader choice in component selection, compared to a DrMOS design. MSI put the driver ICs on the back side of the board to free up some additional space here. The 4935N devices driving the GPU can each source a whopping 93A at an ambient temp of 25C, and are downgraded to 59A at 85C. We all know how hot video cards get, so it's a good idea to have plenty of reserve current capacity for these power devices.
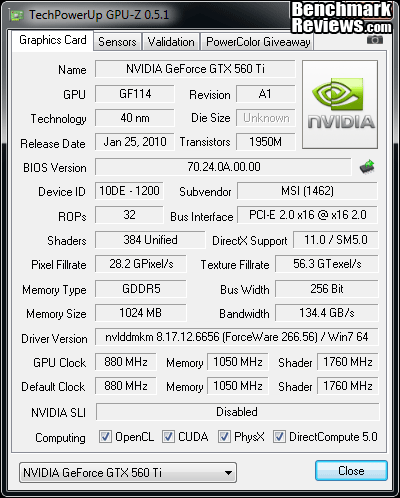
This non-reference card from MSI is more complex than the basic NVIDIA design; but it's still a very straight forward design, without any off-the-wall elements. As such, it has the benefit of all the prior work done on the GTX 460 versions to draw from, including reliability data. Based on the evolutionary nature of the design, the quality of the components, the performance of the Twin Frozr II cooler, and my experience with several recent MSI cards, I expect this card to be very reliable. Every added dollar that went into the redesign went towards making the card faster and more conducive to further overclocking by the customer. It's hard for me to argue with that approach; it's the one I'd be most inclined to take, given a choice. Before we move into the testing phase of the review, let's take a detailed look at the features and specifications for the new GF114 GPU. NVIDIA has supplied us with a ton of information, so let's go.... NVIDIA GeForce GTX 560 Ti GPU FeaturesNVIDIA's GeForce GTX 560 Ti introduces the new GF114 GPU that is largely based on the GF104 Fermi chip which drove the GTX 460 to great success. The differences are four fold: full utilization of the die (no disabled cores), architecture improvements, more widespread use of low-leakage transistors, and layout changes based on signal traffic analysis. While the GF104 enabled only seven out of eight possible Streaming Multiprocessors (SM), the GF114 is able to use that last SM to make even more cores available, a total of 384 compared to 336 in the GTX 460. Each SM still offers 48 CUDA cores, four dispatch units, and eight texture/special function units. The architecture improvements are the addition of full speed FP16 texture filtering and new tile formats that improve Z-cull efficiency. These enhancements alone offer performance improvements ranging from 5% on tessellation-heavy benchmarks like Heaven 2.1, to a whopping 14% gain in 3DMark Vantage, where it's all about shader power. The last two improvements go hand in hand to improve both the power usage and the maximum clock rates that the GPU can support. Low leakage transistors run cooler, use less power, and can be driven faster due to their lower gate capacitance. NVIDIA increased the usage of this more expensive device type, primarily to reduce power consumption, but also to gain some overclocking headroom. They also looked at signal flow across the various sections of the GPU and did some rearranging to shorten signal paths for the high traffic areas. It's not that the GTX 460 was particularly bad in this regard, but the luxury of a second chance yielded some improvements. Taken together, NVIDIA was able to increase the base clock on the core from 675 MHz to 822 MHz, a whopping 22% increase that supposedly doesn't eat into any overclocking headroom. We'll test that supposition later in the review. As for the rest of the capabilities of this very advanced graphics card, here is the complete list of GPU features, as supplied by NVIDIA: NVIDIA GeForce GTX 5xx GPU Feature Summary:3D Graphics
GPU Computing
|
||||||||||||||||||||||||||||||||||||||||||||||||||||||||||||||||||||||||||||||||||||||||||||||||||||||||||||||||||||||||||||||||||||||||||||||||||||||||||||||||||||||||||||||||||||||||||||||||||||||||||||||||||||||||||||||||||||||||||||||||||||||||||||||||||||||||||||||||||||||||||||||||||||||||||||||||||||||||||||||||||||||||||||||||||||||||||||||||||||||||||||||||||||||||||||||||||||||||||||||||||||||||||||||||||||||||||||||||||||||||||||||||||||||||||||||||||||||||||||||||||||||||||||||||||||||||||||||||||||||||||||||||||||||||||||||||||||||||||||||||||||||||||||||||||||||||||||||||||||||||||||||||||||||||||||||||||||||||||||||||||||||||||||||||||||||||||||||||||||||||||||||||||||||||||||||||||||||||||||||


|
Graphics Card |
Cores |
Core Clock |
Shader Clock |
Memory Clock |
Memory |
Interface |
| NVIDIA GeForce GTX 460 (Engineering Sample) |
336 |
675 |
1350 |
900 |
1.0 GB GDDR5 |
192-bit |
|
MSI GeForce GTX 460 (N460GTX Cyclone 1GD5/OC) |
336 |
725 |
1450 |
900 |
1.0 GB GDDR5 |
256-bit |
| MSI Radeon HD 6870 (R6870-2PM2D1GD5) |
1120 |
900 |
N/A |
1050 |
1.0 GB GDDR5 |
256-bit |
| MSI GeForce GTX 560 Ti (N560GTX-Ti Twin Frozr II/OC) |
384 |
880 |
1760 |
1050 |
1.0 GB GDDR5 |
256-bit |
|
PowerColor Radeon HD 5870 (PCS+ AX5870 1GBD5-PPDHG2) |
1600 |
875 |
N/A |
1250 |
1.0 GB GDDR5 |
256-bit |
| Gigabyte GeForce GTX 480 (GV-N480SO-15I Super Over Clock) |
480 |
820 |
1640 |
950 |
1536 MB GDDR5 |
384-bit |
-
NVIDIA GeForce GTX 460 (ENGR Sample - Forceware v266.58)
-
MSI GeForce GTX 460 (N460GTX Cyclone 1GD5/OC - Forceware v266.58)
- MSI Radeon HD 6870 (R6870-2PM2D1GD5 - Catalyst v8.820.2.0)
- MSI N560GTX-Ti Twin Frozr II/OC (912-V238-065 Forceware v266.56)
-
PowerColor Radeon HD 5870 (PCS+ AX5870 1GBD5-PPDHG2 - Catalyst v8.820.2.0)
-
Gigabyte GeForce GTX 480 (GV-N480SO-15I - Forceware v266.58)
Just a quick word on overclocking the GTX 560 Ti, and the MSI N560GTX-Ti Twin Frozr II/OC in particular. In the space of about 5 minutes I was able to bump up the operating frequency of the GPU core from 880 MHz to 975 MHz. I probably could have gotten higher, and I was tempted to push for the magical, mythical 1.0 GHz, but I was in a hurry to write the article. Sorry..... Another couple of hours proved that it could run any benchmark I threw at it without burning up or mis- calculating. Even Furmark just heated it up to 62C after half an hour of 3D furball gymnastics. NOW, I believe NVIDIA when they say that they were able to get genuine clock increases from the new transistor layout, without sacrificing the heroic overclocking ability that the GTX 460 exhibited to everyone who bought it or tested it. Way to go, Green Team! MSI did their part in all of this by providing cleaner power than the standard design allows for, and for using that marvelous Twin Frozr cooler design that first appeared on the N460GTX Hawk about six months ago. The combination provides a very supportive and encouraging environment for the GPU, and it shows in the results. If only our kids responded as well.
3DMark Vantage Performance Tests
3DMark Vantage is a computer benchmark by Futuremark (formerly named Mad Onion) to determine the DirectX 10 performance of 3D game performance with graphics cards. A 3DMark score is an overall measure of your system's 3D gaming capabilities, based on comprehensive real-time 3D graphics and processor tests. By comparing your score with those submitted by millions of other gamers you can see how your gaming rig performs, making it easier to choose the most effective upgrades or finding other ways to optimize your system.
There are two graphics tests in 3DMark Vantage: Jane Nash (Graphics Test 1) and New Calico (Graphics Test 2). The Jane Nash test scene represents a large indoor game scene with complex character rigs, physical GPU simulations, multiple dynamic lights, and complex surface lighting models. It uses several hierarchical rendering steps, including for water reflection and refraction, and physics simulation collision map rendering. The New Calico test scene represents a vast space scene with lots of moving but rigid objects and special content like a huge planet and a dense asteroid belt.
At Benchmark Reviews, we believe that synthetic benchmark tools are just as valuable as video games, but only so long as you're comparing apples to apples. Since the same test is applied in the same controlled method with each test run, 3DMark is a reliable tool for comparing graphic cards against one-another.
1680x1050 is rapidly becoming the new 1280x1024. More and more widescreen are being sold with new systems or as upgrades to existing ones. Even in tough economic times, the tide cannot be turned back; screen resolution and size will continue to creep up. Using this resolution as a starting point, the maximum settings were applied to 3DMark Vantage include 8x Anti-Aliasing, 16x Anisotropic Filtering, all quality levels at Extreme, and Post Processing Scale at 1:2.
3DMark Vantage GPU Test: Jane Nash

Our first test shows the MSI N460GTX-Ti right in the middle between a Radeon HD 6870 and an HD 5870. It leaves an MSI Cyclone version of the GTX 460, even with the factory OC of 725MHz, in the dust. In DX10 synthetics, the number of cores and the core clock are the main factors for performance, and the GTX 560Ti has both axes covered. It's easy to see the advantage the new GF114 GPU has over the first Fermi chips. Equally amazing is what this chip will do when you overclock like you mean it. With 975 MHz on the GTX 560Ti GPU core, it almost catches the highly overclocked Gigabyte SOC version of the GTX 480. We'll be looking at this more as we move on in our testing.

At 1920x1200 native resolution, the relative ranking stay exactly the same. It's hard to tell the 1920 and the 1680 charts apart, until you look at the actual FPS values. BTW, the order of the bars, from left to right is based on current cost of the products. Once again, the GTX 560Ti really puts a boot in it and jumps way up the performance ladder, compared to the GTX 460 cards.
Let's take a look at test #2 now, which has a lot more surfaces to render, with all those asteroids flying around the doomed planet New Calico.
3DMark Vantage GPU Test: New Calico

In the medium resolution New Calico test, the MSI N560GTX-Ti convincingly beats all comers in the price range. In this test, only the GTX 560Ti and the GTX 480 make it above 30FPS at 1680x1050, which shows how tough this medium resolution test really is. The Radeon HD 6870 really falls back here, coming up just short of the GTX 460. Overclocking the GTX 560Ti gets it close to GTX 480 levels, but not quite there. A GTX 480 on stock clocks would have been passed up by this 560 on steroids.

At the highest screen resolution of 1920x1200, the MSI N560GTX-Ti card, with its substantial factory OC, keeps its substantial lead over the GTX 460 and the two Radeon offerings. Raw Shader power is what drives this benchmark, and the GTX 560 Ti has quite an advantage there. This benchmark suite may have recently been replaced with DX11-based tests, but in the fading days of DX10 it is a reliable and challenging benchmark for high-end video cards.
We need to look at some actual gaming performance to verify these results, so let's take a look in the next section, at how these cards stack up in the standard bearer for DX10 gaming benchmarks, Crysis.
|
Graphics Card |
Cores |
Core Clock |
Shader Clock |
Memory Clock |
Memory |
Interface |
| NVIDIA GeForce GTX 460 (Engineering Sample) |
336 |
675 |
1350 |
900 |
1.0 GB GDDR5 |
192-bit |
|
MSI GeForce GTX 460 (N460GTX Cyclone 1GD5/OC) |
336 |
725 |
1450 |
900 |
1.0 GB GDDR5 |
256-bit |
| MSI Radeon HD 6870 (R6870-2PM2D1GD5) |
1120 |
900 |
N/A |
1050 |
1.0 GB GDDR5 |
256-bit |
| MSI GeForce GTX 560 Ti (N560GTX-Ti Twin Frozr II/OC) |
384 |
880 |
1760 |
1050 |
1.0 GB GDDR5 |
256-bit |
|
PowerColor Radeon HD 5870 (PCS+ AX5870 1GBD5-PPDHG2) |
1600 |
875 |
N/A |
1250 |
1.0 GB GDDR5 |
256-bit |
| Gigabyte GeForce GTX 480 (GV-N480SO-15I Super Over Clock) |
480 |
820 |
1640 |
950 |
1536 MB GDDR5 |
384-bit |
Crysis Performance Tests
Crysis uses a new graphics engine: the CryENGINE2, which is the successor to Far Cry's CryENGINE. CryENGINE2 is among the first engines to use the Direct3D 10 (DirectX 10) framework, but can also run using DirectX 9, on Vista, Windows XP and the new Windows 7. As we'll see, there are significant frame rate reductions when running Crysis in DX10. It's not an operating system issue, DX9 works fine in WIN7, but DX10 knocks the frame rates in half.
Roy Taylor, Vice President of Content Relations at NVIDIA, has spoken on the subject of the engine's complexity, stating that Crysis has over a million lines of code, 1GB of texture data, and 85,000 shaders. To get the most out of modern multicore processor architectures, CPU intensive subsystems of CryENGINE2 such as physics, networking and sound, have been re-written to support multi-threading.
Crysis offers an in-game benchmark tool, which is similar to World in Conflict. This short test does place some high amounts of stress on a graphics card, since there are so many landscape features rendered. For benchmarking purposes, Crysis can mean trouble as it places a high demand on both GPU and CPU resources. Benchmark Reviews uses the Crysis Benchmark Tool by Mad Boris to test frame rates in batches, which allows the results of many tests to be averaged. At the widescreen resolutions of 1680x1050 and 1900x1200, the performance differences between video cards under test are mostly down to the cards themselves, but there is still some influence by the rest of the system components.

With medium screen resolution and no MSAA dialed in, Crysis shows a completely different picture than 3DMark Vantage. Unlike many so-called TWIMTBP titles, Crysis has always run quite well on the ATI architecture, and the Radeon HD 5870 is able to vie for top honors in this benchmark against the more costly GTX 480. The GTX 560Ti is still competitive in this game, at current pricing; it just doesn't jump out as the performance v. price leader like it does elsewhere.
Crysis is one of those few games that stress the CPU almost as much as the GPU. As we increase the load on the graphics card, with higher resolution and AA processing, the situation may change. Remember all the test results in this article are with maximum allowable image quality settings, plus all the performance numbers in Crysis took a major hit when Benchmark Reviews switched over to the DirectX 10 API for all our testing. None of the cards are struggling at these low settings, though.

At 1900 x 1200 resolution, the relative rankings stay the same; the raw numbers just go down. Even with the increased load on the GPU, every card from the HD 6870 on up still gets over the 30FPS hump. Any of these high-end GPUs can muster up the muscle to play Crysis at high resolution with most of the bells and whistles turned on, much to everyone's relief. Can it play Crysis? Yes.

Now let's turn up the heat a bit on the ROP units, and add some Multi-Sample Anti-Aliasing. With 4x MSAA cranked in, the top cards lose about 5 FPS at 1680x1050 screen resolution but they manage to stay well above the 30 FPS line. In all these Crysis tests, the MSI R6870 video card has managed to do quite well, but the Radeon HD 5870 is still a great price/performance option for this game. The GTX 560Ti hangs in there with the HD 6870, but it's obvious that it's not optimized for the older graphics code in this classic benchmark.
This is one of our toughest tests, at 1900 x 1200, maximum quality levels, and 4x AA. In the $250-$300 price range, all the cards hover around the 30 FPS mark in this test, which is unbelievable when I think back to the first days of DirectX 10 testing with Crysis. In the middle ranges, the HD 6870 and GTX 560Ti are neck-and-neck, with the 975 MHZ overclock pulling only two FPS ahead of the MSI R6870. Even a massive overclock on the GTX 460 won't come up even with the midrange cards on this test. I ran the MSI GTX 460 HAWK at 950 MHz core clock a couple months ago, and it only got 26 FPS at these settings. On this, the toughest of the four benchmark configurations, the GTX 480 retains the overall lead and shows its thoroughbred pedigree when the tests get harder.
Our next test is a relatively new one for Benchmark Reviews. It's a DirectX 10 game with all the stops pulled out. Just Cause 2 uses a brand new game engine called Avalanche Engine 2.0, which enabled the developers to create games of epic scale and with great variation across genres and artistic styles, for the next generation of gaming experiences. Sounds like fun, let's take a look...
|
Graphics Card |
Cores |
Core Clock |
Shader Clock |
Memory Clock |
Memory |
Interface |
| NVIDIA GeForce GTX 460 (Engineering Sample) |
336 |
675 |
1350 |
900 |
1.0 GB GDDR5 |
192-bit |
|
MSI GeForce GTX 460 (N460GTX Cyclone 1GD5/OC) |
336 |
725 |
1450 |
900 |
1.0 GB GDDR5 |
256-bit |
| MSI Radeon HD 6870 (R6870-2PM2D1GD5) |
1120 |
900 |
N/A |
1050 |
1.0 GB GDDR5 |
256-bit |
| MSI GeForce GTX 560 Ti (N560GTX-Ti Twin Frozr II/OC) |
384 |
880 |
1760 |
1050 |
1.0 GB GDDR5 |
256-bit |
|
PowerColor Radeon HD 5870 (PCS+ AX5870 1GBD5-PPDHG2) |
1600 |
875 |
N/A |
1250 |
1.0 GB GDDR5 |
256-bit |
| Gigabyte GeForce GTX 480 (GV-N480SO-15I Super Over Clock) |
480 |
820 |
1640 |
950 |
1536 MB GDDR5 |
384-bit |
Just Cause 2 Performance Tests
"Just Cause 2 sets a new benchmark in free-roaming games with one of the most fun and entertaining sandboxes ever created," said Lee Singleton, General Manager of Square Enix London Studios. "It's the largest free-roaming action game yet with over 400 square miles of Panaun paradise to explore, and its 'go anywhere, do anything' attitude is unparalleled in the genre." In his interview with IGN, Peter Johansson, the lead designer on Just Cause 2 said, "The Avalanche Engine 2.0 is no longer held back by having to be compatible with last generation hardware. There are improvements all over - higher resolution textures, more detailed characters and vehicles, a new animation system and so on. Moving seamlessly between these different environments, without any delay for loading, is quite a unique feeling."

Just Cause 2 is one of those rare instances where the real game play looks even better than the benchmark scenes. It's amazing to me how well the graphics engine copes with the demands of an open world style of play. One minute you are diving through the jungles, the next you're diving off a cliff, hooking yourself to a passing airplane, and parasailing onto the roof of a hi-rise building. The ability of the Avalanche Engine 2.0 to respond seamlessly to these kinds of dramatic switches is quite impressive. It's not DX11 and there's no tessellation, but the scenery goes by so fast there's no chance to study it in much detail anyway.
Although we didn't use the feature in our testing, in order to equalize the graphics environment between NVIDIA and ATI, the GPU water simulation is a standout visual feature that rivals DirectX 11 techniques for realism. There's a lot of water in the environment, which is based around an imaginary Southeast Asian island nation, and it always looks right. The simulation routines use the CUDA functions in the Fermi architecture to calculate all the water displacements, and those functions are obviously not available when using an ATI-based video card. The same goes for the Bokeh setting, which is an obscure Japanese term for out-of-focus rendering. Neither of these techniques uses PhysX, but they do use specific computing functions that are only supported by NVIDIA's proprietary CUDA architecture.
There are three scenes available for the in-game benchmark, and I used the last one, "Concrete Jungle" because it was the toughest and it also produced the most consistent results. That combination made it an easy choice for the test environment. All Advanced Display Settings were set to their highest level, and Motion Blur was turned on, as well.

The results for the Just Cause 2 benchmark show one of two possible things, depending on your point of view. Either the GTX 560Ti is just a little better than the Radeon competition, or the modern Radeon architecture is just not suited for this game. Any way you look at it, NVIDIA has a definite edge in this benchmark.
Let's take a look at one more popular gaming benchmark, which was released recently with PhysX support, yet it relies on DirectX 9 features. It's a wonderful blend of modern graphics technology and classic crime scenes, called Mafia II.
|
Graphics Card |
Cores |
Core Clock |
Shader Clock |
Memory Clock |
Memory |
Interface |
| NVIDIA GeForce GTX 460 (Engineering Sample) |
336 |
675 |
1350 |
900 |
1.0 GB GDDR5 |
192-bit |
|
MSI GeForce GTX 460 (N460GTX Cyclone 1GD5/OC) |
336 |
725 |
1450 |
900 |
1.0 GB GDDR5 |
256-bit |
| MSI Radeon HD 6870 (R6870-2PM2D1GD5) |
1120 |
900 |
N/A |
1050 |
1.0 GB GDDR5 |
256-bit |
| MSI GeForce GTX 560 Ti (N560GTX-Ti Twin Frozr II/OC) |
384 |
880 |
1760 |
1050 |
1.0 GB GDDR5 |
256-bit |
|
PowerColor Radeon HD 5870 (PCS+ AX5870 1GBD5-PPDHG2) |
1600 |
875 |
N/A |
1250 |
1.0 GB GDDR5 |
256-bit |
| Gigabyte GeForce GTX 480 (GV-N480SO-15I Super Over Clock) |
480 |
820 |
1640 |
950 |
1536 MB GDDR5 |
384-bit |
Mafia II DX9+SSAO Benchmark Results
Mafia II is a single-player third-person action shooter developed by 2K Czech for 2K Games, and is the sequel to Mafia: The City of Lost Heaven released in 2002. Players assume the life of World War II veteran Vito Scaletta, the son of small Sicilian family who immigrates to Empire Bay. Growing up in the slums of Empire Bay teaches Vito about crime, and he's forced to join the Army in lieu of jail time. After sustaining wounds in the war, Vito returns home and quickly finds trouble as he again partners with his childhood friend and accomplice Joe Barbaro. Vito and Joe combine their passion for fame and riches to take on the city, and work their way to the top in Mafia II.
Mafia II is a DirectX 9 PC video game built on 2K Czech's proprietary Illusion game engine, which succeeds the LS3D game engine used in Mafia: The City of Lost Heaven. In our Mafia-II Video Game Performance article, Benchmark Reviews explored characters and gameplay while illustrating how well this game delivers APEX PhysX features on both AMD and NVIDIA products. Thanks to DirectX-11 APEX PhysX extensions that can be processed by the system's CPU, Mafia II offers gamers equal access to high-detail physics regardless of video card manufacturer. Equal access is not the same thing as equal performance, though.
With PhysX technology turned off, both AMD and NVIDIA are on a level playing field in this test. In contrast to many gaming scenes, where other-worldly characters and environments allow the designers to amp up the detail, Mafia II uses human beings wearing ordinary period-correct clothes and natural scenery. Just like how high end audio equipment is easiest to judge using that most familiar of sounds - the human voice, graphics hardware is really put to the test when rendering things that we have real experience with. The drape of a woolen overcoat is a deceptively simple construct; easy to understand and implement, but very difficult to get perfect.

This test shows the MSI N560GTX-Ti bullying the Radeon competition in close quarters again. Despite the lack of DX11 features in this test, particularly tessellation, the latest Fermi chip edges out the HD 6870 by 7 FPS in Mafia II. Overclocking the card pushes it decisively past an HD 5870. Given the fact that Mafia II makes excellent use of PhysX and 3D as described in our NVIDIA APEX PhysX Efficiency: CPU vs GPU article, both areas where NVIDIA has an edge, the GTX 560Ti looks like a real winner in this game. The PhysX features only "cost" a couple of FPS, so it's definitely worth it to get the added realism, IMHO.

At the higher screen resolution of 1920x1200, the GTX 560Ti starts to lose some ground relative to the ATI clan. For a game clearly developed using NVIDIA hardware, it surprises me a bit to see the Radeon series doing this much better at the higher resolution. Of course, I DO miss the PhysX features, which are always turned off during comparison testing. Since Mafia II can't rely on tessellation for enhancing realism, it leans heavily on PhysX. If tessellation were in the mix, the new and improved tessellation engines in the HD 6870 and the GTX 560 would be pushing those numbers up. Here is a game where brute force, meaning the speed and number of shader processors, pays off.
Our next benchmark of the series is not for the faint of heart. Lions and tiger - OK, fine. Guys with guns - I can deal with that. But those nasty little spiders......NOOOOOO! How did I get stuck in the middle of a deadly fight between Aliens vs. Predator anyway? Check out the results from one of our toughest new DirectX 11 benchmarks in the next section.
|
Graphics Card |
Cores |
Core Clock |
Shader Clock |
Memory Clock |
Memory |
Interface |
| NVIDIA GeForce GTX 460 (Engineering Sample) |
336 |
675 |
1350 |
900 |
1.0 GB GDDR5 |
192-bit |
|
MSI GeForce GTX 460 (N460GTX Cyclone 1GD5/OC) |
336 |
725 |
1450 |
900 |
1.0 GB GDDR5 |
256-bit |
| MSI Radeon HD 6870 (R6870-2PM2D1GD5) |
1120 |
900 |
N/A |
1050 |
1.0 GB GDDR5 |
256-bit |
| MSI GeForce GTX 560 Ti (N560GTX-Ti Twin Frozr II/OC) |
384 |
880 |
1760 |
1050 |
1.0 GB GDDR5 |
256-bit |
|
PowerColor Radeon HD 5870 (PCS+ AX5870 1GBD5-PPDHG2) |
1600 |
875 |
N/A |
1250 |
1.0 GB GDDR5 |
256-bit |
| Gigabyte GeForce GTX 480 (GV-N480SO-15I Super Over Clock) |
480 |
820 |
1640 |
950 |
1536 MB GDDR5 |
384-bit |
Aliens vs. Predator Test Results
Rebellion, SEGA and Twentieth Century FOX have released the Aliens vs. Predator DirectX 11 Benchmark to the public. As with many of the already released DirectX 11 benchmarks, the Aliens vs. Predator DirectX 11 benchmark leverages your DirectX 11 hardware to provide an immersive game play experience through the use of DirectX 11 Tessellation and DirectX 11 Advanced Shadow features.

In Aliens vs. Predator, DirectX 11 Geometry Tessellation is applied in an effective manner to enhance and more accurately depict HR Giger's famous Alien design. Through the use of a variety of adaptive schemes, applying tessellation when and where it is necessary, the perfect blend of performance and visual fidelity is achieved with at most a 4% change in performance.
DirectX 11 hardware also allows for higher quality, smoother and more natural looking shadows as well. DirectX 11 Advanced Shadows allow for the rendering of high-quality shadows, with smoother, artifact-free penumbra regions, which otherwise could not be realized, again providing for a higher quality, more immersive gaming experience.
Benchmark Reviews is committed to pushing the PC graphics envelope, and whenever possible we configure benchmark software to its maximum settings for our tests. In the case of Aliens vs. Predator, all cards were tested with the following settings: Texture Quality-Very High, Shadow Quality-High, HW Tessellation & Advanced Shadow Sampling-ON, Multi Sample Anti-Aliasing-4x, Anisotropic Filtering-16x, Screen Space Ambient Occlusion (SSAO)-ON. You will see that this is a challenging benchmark, with all the settings turned up and a screen resolution of 1920 x 1200, it takes an HD5870 card to achieve an average frame rate higher than 30FPS.

Now we get into the full DirectX 11 only benchmarks, so we're looking at the full potential for graphics rendering that's available on only the latest generation of video cards. AvP is a tough benchmark, but it has been a fair one so far, and it's very useful for testing the newest graphics hardware. To get much higher than the 30FPS range, it really takes the latest and greatest cards, or a couple of midrange cards paired up in SLI or CrossFireX.
The MSI N560GTX-Ti ends up tied with the Radeon HD 5870 in this test, and the modest factory overclock puts it a little more than 8% ahead of the MSI R6870 card. What amazes me is how much better the 560 is than the 460, which if you all remember, was no slouch when it was introduced. The consistency of the improvement is impressive, as well. This is not an example of "driver tuning" to sell the old stuff at new prices; the GTX 560Ti is always better.
In our next section, Benchmark Reviews looks at one of the newest and most popular games, Battlefield: Bad Company 2. The game lacks a dedicated benchmarking tool, so we'll be using FRAPS to measure frame rates within portions of the game itself.
|
Graphics Card |
Cores |
Core Clock |
Shader Clock |
Memory Clock |
Memory |
Interface |
| NVIDIA GeForce GTX 460 (Engineering Sample) |
336 |
675 |
1350 |
900 |
1.0 GB GDDR5 |
192-bit |
|
MSI GeForce GTX 460 (N460GTX Cyclone 1GD5/OC) |
336 |
725 |
1450 |
900 |
1.0 GB GDDR5 |
256-bit |
| MSI Radeon HD 6870 (R6870-2PM2D1GD5) |
1120 |
900 |
N/A |
1050 |
1.0 GB GDDR5 |
256-bit |
| MSI GeForce GTX 560 Ti (N560GTX-Ti Twin Frozr II/OC) |
384 |
880 |
1760 |
1050 |
1.0 GB GDDR5 |
256-bit |
|
PowerColor Radeon HD 5870 (PCS+ AX5870 1GBD5-PPDHG2) |
1600 |
875 |
N/A |
1250 |
1.0 GB GDDR5 |
256-bit |
| Gigabyte GeForce GTX 480 (GV-N480SO-15I Super Over Clock) |
480 |
820 |
1640 |
950 |
1536 MB GDDR5 |
384-bit |
Battlefield: Bad Company 2 Test Results
The Battlefield franchise has been known to demand a lot from PC graphics hardware. DICE (Digital Illusions CE) has incorporated their Frostbite-1.5 game engine with Destruction-2.0 feature set with Battlefield: Bad Company 2. Battlefield: Bad Company 2 features destructible environments using Frostbit Destruction-2.0, and adds gravitational bullet drop effects for projectiles shot from weapons at a long distance. The Frostbite-1.5 game engine used on Battlefield: Bad Company 2 consists of DirectX-10 primary graphics, with improved performance and softened dynamic shadows added for DirectX-11 users. At the time Battlefield: Bad Company 2 was published, DICE was also working on the Frostbite-2.0 game engine. This upcoming engine will include native support for DirectX-10.1 and DirectX-11, as well as parallelized processing support for 2-8 parallel threads. This will improve performance for users with an Intel Core-i7 processor.
In our benchmark tests of Battlefield: Bad Company 2, the first three minutes of action in the single-player raft night scene are captured with FRAPS. Relative to the online multiplayer action, these frame rate results are nearly identical to daytime maps with the same video settings.

The GTX 560Ti really stands above the crowd in this benchmark, unless you would rather say that the HD 6870 is doing poorly. Either way, the MSI N560GTX-Ti performs 30% better than the R6870 graphics card. That's not a modest difference, that's a game-winning difference. To be fair, it smokes the GTX 460 siblings as well. This is one title where the 768MB version of the GTX 460 does OK; some other tests push it over the edge with memory usage. In actual game play it's not always such a problem, but synthetic benchmarks like Heaven really punish it.
The little-documented feature in the basic game setup, which allows the application to choose which DirectX API it uses during the session, is not a factor here. All of the tested cards here are DX11-capable, and the game was running in DX11 mode for all the test results reported here. Even though this is primarily developed as a DX10 game, there are DX11 features incorporated in BF:BC2, like softened shadows. That one visual enhancement takes a small, but measureable toll on frame rates. It doesn't have as big an impact as aggressive use of tessellation would, either from the visuals standpoint or the computing perspective.
In the next section we use one of my favorite games, DiRT-2, to look at DX11 performance. Life isn't ALL about shooting aliens; sometimes you just need to get out of the city and drive...!
|
Graphics Card |
Cores |
Core Clock |
Shader Clock |
Memory Clock |
Memory |
Interface |
| NVIDIA GeForce GTX 460 (Engineering Sample) |
336 |
675 |
1350 |
900 |
1.0 GB GDDR5 |
192-bit |
|
MSI GeForce GTX 460 (N460GTX Cyclone 1GD5/OC) |
336 |
725 |
1450 |
900 |
1.0 GB GDDR5 |
256-bit |
| MSI Radeon HD 6870 (R6870-2PM2D1GD5) |
1120 |
900 |
N/A |
1050 |
1.0 GB GDDR5 |
256-bit |
| MSI GeForce GTX 560 Ti (N560GTX-Ti Twin Frozr II/OC) |
384 |
880 |
1760 |
1050 |
1.0 GB GDDR5 |
256-bit |
|
PowerColor Radeon HD 5870 (PCS+ AX5870 1GBD5-PPDHG2) |
1600 |
875 |
N/A |
1250 |
1.0 GB GDDR5 |
256-bit |
| Gigabyte GeForce GTX 480 (GV-N480SO-15I Super Over Clock) |
480 |
820 |
1640 |
950 |
1536 MB GDDR5 |
384-bit |
DiRT-2 Demo DX11 Benchmark Results
DiRT-2 features a roster of contemporary off-road events, taking players to diverse and challenging real-world environments. This World Tour has players competing in aggressive multi-car, and intense solo races at extraordinary new locations. Everything from canyon racing and jungle trails to city stadium-based events. Span the globe as players unlock tours in stunning locations spread across the face of the world. USA, Japan, Malaysia, Baja Mexico, Croatia, London, and more venues await, as players climb to the pinnacle of modern competitive off-road racing.

Multiple disciplines are featured; encompassing the very best that modern off-roading has to offer. Powered by the third generation of the EGOTM Engine's award-winning racing game technology, DiRT-2 benefits from tuned-up car-handling physics and new damaged engine effects. It showcases a spectacular new level of visual fidelity, with cars and tracks twice as detailed as those seen in GRID. The DiRT-2 garage houses a collection of officially licensed rally cars and off-road vehicles, specifically selected to deliver aggressive and fast paced racing. Covering seven vehicle classes, players are given the keys to powerful vehicles right away. In DiRT-2 the opening drive is the Group N Subaru, essentially making the ultimate car from the original game the starting point in the sequel, and the rides just get even more impressive as you rack up points.

The primary contribution that DirectX-11 makes to the DiRT-2 Demo benchmark is in the way water is displayed when a car is passing through it, and in the way cloth items are rendered. The water graphics are pretty obvious, and there are several places in the Moroccan race scene where cars are plowing through large and small puddles. Each one is unique, and they are all believable, especially when more than one car is in the scene. The cloth effects are not as obvious, except in the slower-moving menu screens; when there is a race on, there's precious little time to notice the realistic furls in a course-side flag. I should also note that the flags are much more noticeable in the actual game than in the demo, so they do add a little more to the realism there, that is absent from the benchmark.
On a side note, I appreciate the fact that the demo's built-in benchmark has variable game play. I know its lame, but I most always watch it intently, just to see how well "my" car is being driven. So far, my finest telekinetic efforts have yielded a best finish of second place!

The race winner is the GTX 560Ti again, at least from a price v. performance standpoint. For a title that was developed on AMD hardware, this is a somewhat surprising result, or it would be if I hadn't already seen the GTX 460 pick a fight with every high end card it encountered. The HD 6870 and HD 5870 results look pretty lackluster here, getting matched by the old GTX 460 and getting owned by the newer GTX 560Ti. Fortunately, every setup I tested with here did a great job rendering all of the various scenes. As I said above, this is one of my favorite games, and I can confirm that the results above are not far off from real game play. There has been some concern in the community about the veracity of the Demo Benchmark compared to the in-game one, and/or FRAPS results. Despite that, I like to use the Demo version because everyone has access to it, and can easily compare the results they obtain with their own hardware.
In the next section we'll take a look at one of the newest benchmarking tools, H.A.W.X. 2. It's a high flying aerial adventure filled with lots of tessellated terrain, blown-up airplane bits, and masses of blue sky as a background.
|
Graphics Card |
Cores |
Core Clock |
Shader Clock |
Memory Clock |
Memory |
Interface |
| NVIDIA GeForce GTX 460 (Engineering Sample) |
336 |
675 |
1350 |
900 |
1.0 GB GDDR5 |
192-bit |
|
MSI GeForce GTX 460 (N460GTX Cyclone 1GD5/OC) |
336 |
725 |
1450 |
900 |
1.0 GB GDDR5 |
256-bit |
| MSI Radeon HD 6870 (R6870-2PM2D1GD5) |
1120 |
900 |
N/A |
1050 |
1.0 GB GDDR5 |
256-bit |
| MSI GeForce GTX 560 Ti (N560GTX-Ti Twin Frozr II/OC) |
384 |
880 |
1760 |
1050 |
1.0 GB GDDR5 |
256-bit |
|
PowerColor Radeon HD 5870 (PCS+ AX5870 1GBD5-PPDHG2) |
1600 |
875 |
N/A |
1250 |
1.0 GB GDDR5 |
256-bit |
| Gigabyte GeForce GTX 480 (GV-N480SO-15I Super Over Clock) |
480 |
820 |
1640 |
950 |
1536 MB GDDR5 |
384-bit |
H.A.W.X. 2 DX11 Benchmark Results
H.A.W.X. 2 has been optimized for DX11 enabled GPUs and has a number of enhancements to not only improve performance with DX11 enabled GPUs but also greatly improve the visual experience while taking to the skies.
-
Level maps are 128 Km per dimension creating a level area of 16384 Km².
All of the terrain in this area is rendered using a powerful tessellation implementation. -
The game uses a hardware terrain tessellation method that allows a high number of detailed triangles to be rendered entirely on the GPU when near the terrain in question. This allows for a very low memory footprint and relies on the GPU power alone to expand the low res data to highly realistic detail.
-
Quad patches with multiple displacement maps aim to render 6-pixel-wide triangles typically creating 1.5 Million triangles per frame not including planes, trees, and buildings!
-
The game uses bi-cubic height filtering and fractal noise to give realistic detail at this grand scale. The wavelength and amplitude of the fractal noise is carefully tuned for maximum realism on each level working with the complex tessellation shaders to ensure highest level detail without cracks in the terrain surface.
-
These factors make H.A.W.X. 2 the perfect title for benchmarking the current and future generation of DX11 enabled GPUs.

The H.A.W.X.2 benchmark test is not quite the tessellation monster that Unigine Heaven is. It is supposed to represent an actual game, after all. However, the developers have taken full advantage of the DirectX 11 technology to pump up the realism in this new title. The scenery on the ground in particular is very detailed and vividly portrayed, and there's a lot of it that goes by the window of the F-22 Raptor that is your point of view. The blue sky, not so much....
The enhanced ability of the newest GPU designs to handle tessellation is quite evident here. The HD 5870 is a dog in this test, compared to the smaller, cheaper Radeon HD 6870. This benchmark was launched by NVIDIA, and AMD had limited access during development, so the early test results unfairly favored the Green Team. Fast forward to the latest driver release from AMD, and now the HD 6870 comes out to play with all its equipment on. The GTX 480 ends up on the top of the pile in this test by shear muscle mass, but the two new kids on the block do a decent job for less money.
Let's take a look at another DX11 benchmark, a fast-paced scenario on a Lost Planet called E.D.N. III. The dense vegetation in "Test A" is almost as challenging as it was in Crysis, and now we have tessellation and soft shadows thrown into the mix via DirectX 11.
|
Graphics Card |
Cores |
Core Clock |
Shader Clock |
Memory Clock |
Memory |
Interface |
| NVIDIA GeForce GTX 460 (Engineering Sample) |
336 |
675 |
1350 |
900 |
1.0 GB GDDR5 |
192-bit |
|
MSI GeForce GTX 460 (N460GTX Cyclone 1GD5/OC) |
336 |
725 |
1450 |
900 |
1.0 GB GDDR5 |
256-bit |
| MSI Radeon HD 6870 (R6870-2PM2D1GD5) |
1120 |
900 |
N/A |
1050 |
1.0 GB GDDR5 |
256-bit |
| MSI GeForce GTX 560 Ti (N560GTX-Ti Twin Frozr II/OC) |
384 |
880 |
1760 |
1050 |
1.0 GB GDDR5 |
256-bit |
|
PowerColor Radeon HD 5870 (PCS+ AX5870 1GBD5-PPDHG2) |
1600 |
875 |
N/A |
1250 |
1.0 GB GDDR5 |
256-bit |
| Gigabyte GeForce GTX 480 (GV-N480SO-15I Super Over Clock) |
480 |
820 |
1640 |
950 |
1536 MB GDDR5 |
384-bit |
Lost Planet 2 DX11 Benchmark Results
A decade has passed since the first game, and the face of E.D.N. III has changed dramatically. Terra forming efforts have been successful and the ice has begun to melt, giving way to lush tropical jungles and harsh unforgiving deserts. Players will enter this new environment and follow the exploits of their own customized snow pirate on their quest to seize control of the changing planet.
-
4-player co-op action: Team up to battle the giant Akrid in explosive 4 player co-operative play. Teamwork is the player's key to victory as the team is dependent on each to succeed and survive.
-
Single-player game evolves based on players decisions and actions
-
Deep level of character customization: Players will have hundreds of different ways to customize their look to truly help them define their character on the battlefield both on- and offline. Certain weapons can also be customized to suit individual player style.
-
Beautiful massive environments: Capcom's advanced graphics engine, MT Framework 2.0, will bring the game to life with the next step in 3D fidelity and performance.
-
Massive scale of enemies: Players skill on the battlefield and work as a team will be tested like never before against the giant Akrid. Players will utilize teamwork tactics, new weapons and a variety of vital suits (VS) to fight these larger-than-life bosses.
-
Rewards System- Players will receive rewards for assisting teammates and contributing to the team's success
-
Multiplayer modes and online ranking system
-
Exciting new VS features- Based on fan feedback, the team has implemented an unbelievable variety of Vital Suits and new ways to combat VS overall. The new VS sytem will have a powerful impact on the way the player takes to the war zone in Lost Planet 2
Test A:
The primary purpose of Test A is to give an indication of typical game play performance of the PC running Lost Planet 2 (i.e. if you can run Mode A smoothly, the game will be playable at a similar condition). In this test, the character's motion is randomized to give a slightly different outcome each time.

In Test A of Lost Planet 2, we see a familiar pattern. That is, the newest games are implementing the latest software technology and the newest graphics cards are optimized to handle exactly that. The HD 6870 does quite a bit better than the HD 5870, but both suffer from lower tessellation performance compared to the Fermi cards. MSI's N560GTX-Ti outperforms both the Radeon cards reliably here, as well as the GTX 460 variants.
I saw one or two "slowdowns" during the test with the AMD cards that didn't occur with the NVIDIA products. They remained during the second and third runs of the benchmark, so it wasn't a "map loading" issue. It occurred in scene two which is the most demanding, no matter what card is installed. In fact it's usually tougher than Test B. For the sake of consistency, we are reporting the average result, as calculated by the benchmark application. It is not an average of the individual scores reported for the three scenes.
I'm sure there will be further optimizations as time marches on, but right now we have an almost ideal gaming environment where the software and hardware are finally in sync. As long as you are happy with the story lines, characters, scoring systems, etc. of the new games, you can enjoy a level of realism and performance that was only hinted at with the first generation of DX11 software and hardware. I keep thinking of some of the early titles as "tweeners", as they were primarily developed using the DirectX 10 graphics API, and then some DX11 features were added right before the product was released. It was a nice glimpse into the technology, but the future is now.
Test B:
The primary purpose of Test B is to push the PC to its limits and to evaluate the maximum performance of the PC. It utilizes many functions of Direct X11 resulting in a very performance-orientated, very demanding benchmark mode.

Test B shows broadly similar ranking as Test A, but the HD 5870 make a bit of a comeback. The sea monster (I can't quite say "River Monster" for some reason...) is a prime candidate for tessellation, and given the fact that it is in the foreground for most of the scene, the full level of detail is usually being displayed. The water effects also contribute to the graphics load in this test, making it just a little bit tougher than Test A. For the money, the GTX 560Ti is the definite winner here, on this tessellation-heavy title.
In our next section, we are going to continue our DirectX 11 testing with a look at our most demanding DX11 benchmarks, straight from the depths of Moscow's underground rail system and the studios of 4A Games in Ukraine. Let's take a peek at what post-apocalyptic Moscow looks like in the year 2033.
|
Graphics Card |
Cores |
Core Clock |
Shader Clock |
Memory Clock |
Memory |
Interface |
| NVIDIA GeForce GTX 460 (Engineering Sample) |
336 |
675 |
1350 |
900 |
1.0 GB GDDR5 |
192-bit |
|
MSI GeForce GTX 460 (N460GTX Cyclone 1GD5/OC) |
336 |
725 |
1450 |
900 |
1.0 GB GDDR5 |
256-bit |
| MSI Radeon HD 6870 (R6870-2PM2D1GD5) |
1120 |
900 |
N/A |
1050 |
1.0 GB GDDR5 |
256-bit |
| MSI GeForce GTX 560 Ti (N560GTX-Ti Twin Frozr II/OC) |
384 |
880 |
1760 |
1050 |
1.0 GB GDDR5 |
256-bit |
|
PowerColor Radeon HD 5870 (PCS+ AX5870 1GBD5-PPDHG2) |
1600 |
875 |
N/A |
1250 |
1.0 GB GDDR5 |
256-bit |
| Gigabyte GeForce GTX 480 (GV-N480SO-15I Super Over Clock) |
480 |
820 |
1640 |
950 |
1536 MB GDDR5 |
384-bit |
METRO 2033 DX11 Benchmark Results
Metro 2033 is an action-oriented video game with a combination of survival horror, and first-person shooter elements. The game is based on the novel Metro 2033 by Russian author Dmitry Glukhovsky. It was developed by 4A Games in Ukraine and released in March 2010 for Microsoft Windows. Metro 2033 uses the 4A game engine, developed by 4A Games. The 4A Engine supports DirectX-9, 10, and 11, along with NVIDIA PhysX and GeForce 3D Vision.
The 4A engine is multi-threaded in that only PhysX has a dedicated thread, and it uses a task-model without any pre-conditioning or pre/post-synchronizing, thus allowing tasks to be done in parallel. The 4A game engine can utilize a deferred shading pipeline, and uses tessellation for greater performance, and also has HDR (complete with blue shift), real-time reflections, color correction, film grain and noise, and the engine also supports multi-core rendering.
Metro 2033 featured superior volumetric fog, double PhysX precision, object blur, sub-surface scattering for skin shaders, parallax mapping on all surfaces and greater geometric detail with a less aggressive LODs. Using PhysX, the engine uses many features such as destructible environments, and cloth and water simulations, and particles that can be fully affected by environmental factors.

NVIDIA has been diligently working to promote Metro 2033, and for good reason: it is the most demanding PC video game we've ever tested. When an overclocked GeForce GTX 480 struggles to produce 29 FPS, you know that only the strongest graphics processors will generate playable frame rates. All of my tests use the in-game benchmark that was added to the game as DLC earlier this year. Advanced Depth of Field and Tessellation effects are enabled, but the advanced PhysX option is disabled to provide equal load to both AMD and NVIDIA cards. All tests are run with 4x MSAA, which produces the highest load of the two anti-aliasing choices.

The GTX 480 SOC from Gigabyte gets the top spot again with an average frame rate of 29.0 FPS. That may sound low, but METRO 2033 is a punishing graphics load, and that's a very good result for a single card. The GTX 560Ti card puts in a respectable second place showing, beating the Radeon products, both new and old. Once again, PhysX is disabled for all testing, although it only extracted about a 2 FPS penalty when it was enabled. IMHO, the minor hit in frame rates is fully justified in terms of the additional realism that PhysX imparts to the gameplay. It adds a lot more than any amount of anti-aliasing, no matter what type...

At the higher screen resolution of 1920x1200, the N560GTX-Ti loses some of its advantage over the HD 6850 and HD 5870. The GTX 480 gains a bit, relative to the lower priced models and the 768MB version of the GTX 460 just collapses under the strain of this unearthly graphics load. These are barely playable frame rates; it takes a bigger card than we have in the mix today to play this game with all the stops pulled out.
In our next section, we are going to complete our DirectX 11 testing with a look at an unusual DX11 benchmarks, straight from mother Russia and the studios of Unigine. Their latest benchmark is called "Heaven", and it has some very interesting and non-typical graphics. So, let's take a peek at what Heaven v2.1 looks like.
|
Graphics Card |
Cores |
Core Clock |
Shader Clock |
Memory Clock |
Memory |
Interface |
| NVIDIA GeForce GTX 460 (Engineering Sample) |
336 |
675 |
1350 |
900 |
1.0 GB GDDR5 |
192-bit |
|
MSI GeForce GTX 460 (N460GTX Cyclone 1GD5/OC) |
336 |
725 |
1450 |
900 |
1.0 GB GDDR5 |
256-bit |
| MSI Radeon HD 6870 (R6870-2PM2D1GD5) |
1120 |
900 |
N/A |
1050 |
1.0 GB GDDR5 |
256-bit |
| MSI GeForce GTX 560 Ti (N560GTX-Ti Twin Frozr II/OC) |
384 |
880 |
1760 |
1050 |
1.0 GB GDDR5 |
256-bit |
|
PowerColor Radeon HD 5870 (PCS+ AX5870 1GBD5-PPDHG2) |
1600 |
875 |
N/A |
1250 |
1.0 GB GDDR5 |
256-bit |
| Gigabyte GeForce GTX 480 (GV-N480SO-15I Super Over Clock) |
480 |
820 |
1640 |
950 |
1536 MB GDDR5 |
384-bit |
Unigine Heaven 2.1 Benchmark Results
The Unigine "Heaven 2.1" benchmark is a free, publicly available, tool that grants the power to unleash the graphics capabilities in DirectX 11 for Windows 7 or updated Vista Operating Systems. It reveals the enchanting magic of floating islands with a tiny village hidden in the cloudy skies. With the interactive mode, emerging experience of exploring the intricate world is within reach. Through its advanced renderer, Unigine is one of the first to set precedence in showcasing the art assets with tessellation, bringing compelling visual finesse, utilizing the technology to the full extend and exhibiting the possibilities of enriching 3D gaming.
The distinguishing feature in the Unigine Heaven benchmark is a hardware tessellation that is a scalable technology aimed for automatic subdivision of polygons into smaller and finer pieces, so that developers can gain a more detailed look of their games almost free of charge in terms of performance. Thanks to this procedure, the elaboration of the rendered image finally approaches the boundary of veridical visual perception. The "Heaven" benchmark excels at the following key features:
- Native support of OpenGL, DirectX 9, DirectX-10 and DirectX-11
- Comprehensive use of tessellation technology
- Advanced SSAO (screen-space ambient occlusion)
- Volumetric cumulonimbus clouds generated by a physically accurate algorithm
- Dynamic simulation of changing environment with high physical fidelity
- Interactive experience with fly/walk-through modes
- ATI Eyefinity support

Starting off with a lighter load of 4x MSAA, we see the Gigabyte GTX 480 SOC taking the single GPU crown, but not by a large margin over the GTX 560Ti. Even in the "normal" tessellation mode, this is a graphics test that really shows off the full impact of this DirectX 11 technology. The Fermi architecture has so much more computing power designated and available for tessellation, that it's no small surprise to see both of these cards doing so well here. The HD 6870, even with its revamped tessellation engine, has to hang out with the GTX 460 crowd, plus the older HD 5870. I'm amazed that the HD 6870 performs as well as it does with only the same number of shaders as the Radeon HD 5830; that card used to die a slow death in this benchmark. There is no jerkiness to the display with either the GTX 560Ti or the GTX 480 at this resolution; now that I've seen the landscape go by for a couple hundred times, I can spot the small stutters pretty easily. This test was run with 4x anti-aliasing; let's see how the cards stack up when we increase MSAA to the maximum level of 8x.

Increasing the anti-aliasing leveled out the playing field just a bit, with the exception of the GTX 460 with 768 MB of memory; it pretty much crashed in this test. There's no denying that the Fermi chip, in all its versions, is a killer when called upon for tessellation duty. The poor results for the GTX 460/768 are strictly due to the memory limitations of that card, not the GPU. Besides the most obvious trend of the GTX 560Ti grabbing pride of place for price v. performance more often than not, the other thing I've noticed is a consistent improvement by the GTX 480 when the going gets tough.
In our next section, we investigate the thermal performance of the MSI N560GTX-Ti Twin Frozr II/OCock Video Card, and see how well this upgraded cooler works on the brand new GF114 Fermi GPU.
|
Graphics Card |
Cores |
Core Clock |
Shader Clock |
Memory Clock |
Memory |
Interface |
| NVIDIA GeForce GTX 460 (Engineering Sample) |
336 |
675 |
1350 |
900 |
1.0 GB GDDR5 |
192-bit |
|
MSI GeForce GTX 460 (N460GTX Cyclone 1GD5/OC) |
336 |
725 |
1450 |
900 |
1.0 GB GDDR5 |
256-bit |
| MSI Radeon HD 6870 (R6870-2PM2D1GD5) |
1120 |
900 |
N/A |
1050 |
1.0 GB GDDR5 |
256-bit |
| MSI GeForce GTX 560 Ti (N560GTX-Ti Twin Frozr II/OC) |
384 |
880 |
1760 |
1050 |
1.0 GB GDDR5 |
256-bit |
|
PowerColor Radeon HD 5870 (PCS+ AX5870 1GBD5-PPDHG2) |
1600 |
875 |
N/A |
1250 |
1.0 GB GDDR5 |
256-bit |
| Gigabyte GeForce GTX 480 (GV-N480SO-15I Super Over Clock) |
480 |
820 |
1640 |
950 |
1536 MB GDDR5 |
384-bit |
MSI N560GTX-Ti Twin Frozr II/OC Temperatures
It's hard to know exactly when the first video card got overclocked, and by whom. What we do know is that it's hard to imagine a computer enthusiast or gamer today that doesn't overclock their hardware. Of course, not every video card has the head room. Some products run so hot that they can't suffer any higher temperatures than they generate straight from the factory. This is why we measure the operating temperature of the video card products we test.
To begin testing, I use GPU-Z to measure the temperature at idle as reported by the GPU. Next I use FurMark 1.8.2 to generate maximum thermal load and record GPU temperatures at high-power 3D mode. The ambient room temperature remained stable at 25C throughout testing. I have a ton of airflow into the video card section of my benchmarking case, with a 200mm side fan blowing directly inward, so that helps alleviate any high ambient temps.
The MSI N560GTX-Ti Twin Frozr II/OC video card recorded 29C in idle mode, and increased to 58C after 30 minutes of stability testing in full 3D mode, at 1920x1200 resolution, and the maximum MSAA setting of 8X. With the fan set on Automatic, the speed rose to 54% under full load. The idle fan speed is a relatively high 40%, which is fine because the two fans are pretty much inaudible at that setting. I then did a run with manual fan control and 100% fan speed. I was rewarded by a modest increase in fan noise and a reduced load temperature of 53C.
|
Load |
Fan Speed |
GPU Temperature |
|
Idle |
40% - AUTO (1590 RPM) |
29C |
|
Furmark |
54% - AUTO (2790 RPM) |
58C |
|
Furmark |
100% - Manual (4440 RPM) |
53C |
58C is a good result for temperature stress testing, especially with such a powerful GPU, stock fan settings, a moderately high ambient of 25C, and fan speeds controlled by the card. I'm used to seeing video card manufacturers keeping the fan speeds low and letting GPU temps get into higher temperature regions. In this case, the fan controller ramped up nicely to the 54% mark when running on auto. With high quality PWM-controlled fans that run fairly quiet, I didn't notice a major shift in fan noise, either. There is definitely some benefit to running the fan harder, as you can see from the 100% fan results above where the temperature was lowered by 5C. Most users will not have to make custom software profiles to optimize the fan speeds on this non-reference design.On the flip side, unless you've got the luxury and the maniacal streak needed to play video games 24 hours a day, your graphics card spends a lot of time idling while you're at work. With this card, the fan controller keeps the idle speed up to 40% and your card stays cool during the off-hours.

Load temps got up to a maximum of 61C when the GPU was overclocked to 975 MHZ, and I was running continuous gaming benchmarks. That may seem high, but the GPU ws running on the brink of 1 GHz and, I had increased the voltage to (a probably too high level of) 1.100 V. I was in a hurry....
FurMark is an OpenGL benchmark that heavily stresses and overheats the graphics card with fur rendering. The benchmark offers several options allowing the user to tweak the rendering: fullscreen / windowed mode, MSAA selection, window size, duration. The benchmark also includes a GPU Burner mode (stability test). FurMark requires an OpenGL 2.0 compliant graphics card with lot of GPU power!

FurMark does do two things extremely well: drive the thermal output of any graphics processor higher than any other application or video game, and it does so with consistency every time. While FurMark is not a true benchmark tool for comparing different video cards, it still works well to compare one product against itself using different drivers or clock speeds, or testing the stability of a GPU, as it raises the temperatures higher than any program. But in the end, it's a rather limited tool.
In our next section, we discuss electrical power consumption and learn how well (or poorly) each video card will impact your utility bill...
VGA Power Consumption
Life is not as affordable as it used to be, and items such as gasoline, natural gas, and electricity all top the list of resources which have exploded in price over the past few years. Add to this the limit of non-renewable resources compared to current demands, and you can see that the prices are only going to get worse. Planet Earth is needs our help, and needs it badly. With forests becoming barren of vegetation and snow capped poles quickly turning brown, the technology industry has a new attitude towards turning "green". I'll spare you the powerful marketing hype that gets sent from various manufacturers every day, and get right to the point: your computer hasn't been doing much to help save energy... at least up until now. Take a look at the idle clock rates that NVIDIA programmed into the BIOS for this GPU; no special power-saving software utilities are required. With the GPU core running at 50.6 MHz, and the memory at 67.5 MHz, not a lot of power is required to keep things percolating. This is miles ahead of what the industry was doing 1-2 years ago, in terms of speed throttling to save energy.

To measure isolated video card power consumption, I used the Kill-A-Watt EZ (model P4460) power meter made by P3 International. A baseline test is taken without a video card installed inside our computer system, which is allowed to boot into Windows and rest idle at the login screen before power consumption is recorded. Once the baseline reading has been taken, the graphics card is installed and the system is again booted into Windows and left idle at the login screen. Our final loaded power consumption reading is taken with the video card running a stress test using FurMark. Below is a chart with the isolated video card power consumption (not system total) displayed in Watts for each specified test product:
VGA Product Description(sorted by combined total power) |
Idle Power |
Loaded Power |
|---|---|---|
NVIDIA GeForce GTX 480 SLI Set |
82 W |
655 W |
NVIDIA GeForce GTX 590 Reference Design |
53 W |
396 W |
ATI Radeon HD 4870 X2 Reference Design |
100 W |
320 W |
AMD Radeon HD 6990 Reference Design |
46 W |
350 W |
NVIDIA GeForce GTX 295 Reference Design |
74 W |
302 W |
ASUS GeForce GTX 480 Reference Design |
39 W |
315 W |
ATI Radeon HD 5970 Reference Design |
48 W |
299 W |
NVIDIA GeForce GTX 690 Reference Design |
25 W |
321 W |
ATI Radeon HD 4850 CrossFireX Set |
123 W |
210 W |
ATI Radeon HD 4890 Reference Design |
65 W |
268 W |
AMD Radeon HD 7970 Reference Design |
21 W |
311 W |
NVIDIA GeForce GTX 470 Reference Design |
42 W |
278 W |
NVIDIA GeForce GTX 580 Reference Design |
31 W |
246 W |
NVIDIA GeForce GTX 570 Reference Design |
31 W |
241 W |
ATI Radeon HD 5870 Reference Design |
25 W |
240 W |
ATI Radeon HD 6970 Reference Design |
24 W |
233 W |
NVIDIA GeForce GTX 465 Reference Design |
36 W |
219 W |
NVIDIA GeForce GTX 680 Reference Design |
14 W |
243 W |
Sapphire Radeon HD 4850 X2 11139-00-40R |
73 W |
180 W |
NVIDIA GeForce 9800 GX2 Reference Design |
85 W |
186 W |
NVIDIA GeForce GTX 780 Reference Design |
10 W |
275 W |
NVIDIA GeForce GTX 770 Reference Design |
9 W |
256 W |
NVIDIA GeForce GTX 280 Reference Design |
35 W |
225 W |
NVIDIA GeForce GTX 260 (216) Reference Design |
42 W |
203 W |
ATI Radeon HD 4870 Reference Design |
58 W |
166 W |
NVIDIA GeForce GTX 560 Ti Reference Design |
17 W |
199 W |
NVIDIA GeForce GTX 460 Reference Design |
18 W |
167 W |
AMD Radeon HD 6870 Reference Design |
20 W |
162 W |
NVIDIA GeForce GTX 670 Reference Design |
14 W |
167 W |
ATI Radeon HD 5850 Reference Design |
24 W |
157 W |
NVIDIA GeForce GTX 650 Ti BOOST Reference Design |
8 W |
164 W |
AMD Radeon HD 6850 Reference Design |
20 W |
139 W |
NVIDIA GeForce 8800 GT Reference Design |
31 W |
133 W |
ATI Radeon HD 4770 RV740 GDDR5 Reference Design |
37 W |
120 W |
ATI Radeon HD 5770 Reference Design |
16 W |
122 W |
NVIDIA GeForce GTS 450 Reference Design |
22 W |
115 W |
NVIDIA GeForce GTX 650 Ti Reference Design |
12 W |
112 W |
ATI Radeon HD 4670 Reference Design |
9 W |
70 W |
The MSI N560GTX-Ti Twin Frozr II/OC Video Card pulled 16 (138-122) watts at idle and 198 (320-122) watts when running full out, using the test method outlined above. The GTX560Ti is more frugal than the first generation of full-sized Fermi cards, and within the same range as later cards from major board partners. Part of the increased efficiency comes from running cooler than most GTX 560 Ti cards. I've consistently seen power usage climb right along with temps while stress testing a variety of graphics cards. We've all become used to the low power ways of the newest processors, and there's no turning back.
BTW, just because you asked... GPU-Z reported a GPU voltage of 0.950V at idle, 0.950V in 2D graphics mode, and 0.987V in full 3D mode. Next, I'll offer you my conclusions. On to the next page...
MSI N560GTX-Ti Twin Frozr II/OC Conclusion
IMPORTANT: Although the rating and final score mentioned in this conclusion are made to be as objective as possible, please be advised that every author perceives these factors differently at various points in time. While we each do our best to ensure that all aspects of the product are considered, there are often times unforeseen market conditions and manufacturer changes which occur after publication that could render our rating obsolete. Please do not base any purchase solely on our conclusion, as it represents our product rating specifically for the product tested which may differ from future versions. Benchmark Reviews begins our conclusion with a short summary for each of the areas that we rate.
From a performance standpoint, the GTX 560 Ti exceeded my expectations. I'm a little jaded I guess about manufacturer's claims, but NVIDIA didn't pull any punches with this update. The GTX460 is already a widely accepted success in the marketplace, and this new collection of two billion transistors is just as much a revelation for the upper middle class of graphics cards as the original was. I'm also thrilled with the Twin Frozr II cooling solution, due to the low noise, the aggressive fan profile, and the lower operating temperatures. Power requirements are very modest, as NVIDIA recommends a 500W PSU, which is actually below the minimum I would personally consider for any modern gaming rig.
The appearance of the MSI N560GTX-Ti Twin Frozr II/OC video card is very attractive; the stylish fan shroud gives it a very modern look. The decorative touches are subtle and refined, and the anodized aluminum does a good job of avoiding fingerprints without being a dull expanse of grey metal. MSI did a nice job producing a subtle design that is business-like, yet manages to show off its muscles at the same time. They have definitely improved on the earlier version of the Twin Frozr cooler in terms of visual design, and I certainly don't mind seeing a repeat of the Twin Frozr II design from the GTX 460 cards.

The build quality of the MSI N560GTX-Ti card was quite good. Everything is assembled well, everything fit when I put it back together, and the overall impression of the card was very solid. The densely packed cooler adds a certain heft to the card and also lends a good deal of rigidity to the package. The packaging was of the highest quality and very informative. The front panel lifts up to showcase a large display of all the many features this card incorporates. The upgraded power supply arrangement used all high quality parts, and was clearly intended to be a class leading design. I pushed this card to the wall repeatedly, and it never stumbled or complained once.
I also have to give top marks to the MSI Afterburner software, as this monitoring tool is one of my favorites. I especially like the fact that you can "detach" the monitor window, and then minimize the controller window separately. Each of the graphs has a scalable vertical axis, and hovering over the line graph with the mouse produces a top-to-bottom listing of values at that time slice. The overall interface of this product is one of the best available, at least for my purposes. I like to keep things simple when I can; MSI Afterburner combines the features I need into one interface, plus offers capabilities that others can't match.
The basic features of the MSI N560GTX-Ti are fully comparable with the latest offerings from both camps. It has: Microsoft DirectX 11 Support, PhysX Technology, is 3D Vision Ready, also 3D Vision Surround Ready, CUDA Technology, SLI, 32x Anti-aliasing, PureVideo HD, and HDMI 1.4a support. If PhysX and 3D Vision Surround matter to you, then you are already firmly anchored in the NVIDIA camp, and the 560Ti is just icing on the cake. All the other features I could talk about here are directly related to extracting the full raw computing power from this latest NVIDIA GPU, and they're covered elsewhere on this page.
As of late January 2011, the price for the MSI N560GTX-Ti is $249.99 at Newegg. There are currently no rebates available and MSI is not giving away free STEAM codes for any popular games at the moment, so consider that in your purchasing decisions. The price-to-performance ratio of this GPU is so good, there's not a lot of downside anywhere. This particular model offers one of the very best cooling subsystems available for the GF114 GPU and arguably the best power section as well, and the price adder for all that is pretty much non-existent. I rate it as a real bargain for that reason. AMD just issued their challenge, in the form of new 1GB versions of the HD 6950 that are priced very aggressively, and I look forward to comparing that new competitor in the near future.
Almost any GTX 560 Ti card is going to get high marks at this stage of the game. NVIDIA has brought some pretty amazing performance improvements to a graphics platform that was already very competitive. AMD has responded with some serious price cuts on the HD 6870 and released a value version of the HD 6950 that will bracket the GTX560Ti in price, but as of today I think this is the card to beat in the $250 price range. One reason for that is the continued presence of serious overclocking headroom for this upgraded GPU. I got 975 MHz on the core clock with very little effort, and the Twin Frozr II cooler kept the temperatures below 61C no matter how hard I stressed the card with continuous benchmarking.
I had to work hard to come up with some Cons for this card, and none of them would probably influence my buying decision. This is a video card I can recommend without reservation.
Pros:
+ Very quiet cooling system with performance-oriented fan profile
+ Much lower temps than reference designs
+ Performance improvement over GTX 460 is impressive
+ Overclocking headroom is similar to the GTX 460
+ PhysX capability is great feature with minimal FPS impact
+ Upgraded power supply design with high quality components
+ Low price penalty for enhanced performance and features
+ Manufacturing quality is close to the very top
+ Industry leading 3D support by NVIDIA
Cons:
- $250+ is still a lot of money for casual gamers to spend
- Hot air from GPU cooler stays inside case
- GTX 560 SE is probably in the works, and might offer more value
Ratings:
- Performance: 9.50
- Appearance: 9.25
- Construction: 9.25
- Functionality: 9.50
- Value: 9.00
Final Score: 9.30 out of 10.
Excellence Achievement: Benchmark Reviews Golden Tachometer Award.
Questions? Comments? Benchmark Reviews really wants your feedback. We invite you to leave your remarks in our Discussion Forum.
Related Articles:
- Cooler Master Sniper CM Storm Case
- Corsair Obsidian 350D Micro ATX Computer Case
- QNAP TS-509 Pro Gigabit 5-Bay SATA NAS Server
- Antec Twelve Hundred Gaming Case
- OWC Mercury Extreme Pro 6G SSD
- ASUS M4A79T Deluxe AMD 790FX AM3 Motherboard
- 120GB OCZ Vertex 3.20 Solid State Drive
- Corsair Vengeance K60 Mechanical Gaming Keyboard
- PowerColor Radeon HD 6870 PCS+ Video Card
- Cooler Master NotePal X2 Laptop Cooler

Comments
Would like to know if the Twin Frozr II kind of cooling system will work fine in upright position in the Raven-2 case?
Thank you.
The biggest difference will be the internal ambient case temperature, which will be slightly higher with this type of video card cooler.
Thanks for the advise. Yeah, I know that Raven-2 design is more for the radial blower type of cards and there are very limited models from where I am, sigh. I am upgrading to SLI cards and I am looking for other options on optimum air cooling, price & performance.
Thanks guys.
I suggest preferences for the MSI GTX 560 Ti HAWK (950Mhz - Twin frozer III )
for some euros more you ve got a really good board !
I bought it on summer 2O11 when it was hot days, i never go more than 71° after 1 hour full load ! Now it run a 35° idle and 50° full game running ( warhammer spacemarine or X3 terran conflict for exemple or Wolfenstein E.T. using 32x and high resolution setting.
I run it under W7 and Fedora 16, pure happy time :)
Choose well and have fun :)
ARIKO