| Intel Core i5-655K Processor BX80616I5655K |
| Reviews - Featured Reviews: Processors | |||||||||||||||||||||||||||||||||||||||||||||||||||||||||||||||||||||||||
| Written by Servando Silva | |||||||||||||||||||||||||||||||||||||||||||||||||||||||||||||||||||||||||
| Thursday, 29 July 2010 | |||||||||||||||||||||||||||||||||||||||||||||||||||||||||||||||||||||||||
Intel Core i5-655K Clarkdale Processor ReviewIntel is "striking back" with a pair of Unlocked (K) Processors. The first one is the Core i7 875K. This is a 4-cores/8-threads Lynnfield based CPU. Basically, it's identical to the Core i7 870, but came with a much-lower price tag which at the end obligated themselves to lower the prices to make the rest of the CPUs still competitive. The second product (which we're reviewing today) is the Core i5 655K. This processor is based on Clarkdale's architecture, and so it comes with an iGPU based on Intel HD graphics with a 733MHz clock, and the CPU works with 2-cores/4-threads making it a sweet deal, especially because of the low power consumption and overclocking capabilities. At the moment of launch, the Core i7 870 had a price tag of $562 which was way higher than the Core i7 875K with a price tag of $342. Of course, it was only matter of time for Intel to re-arrange their prices and now the Core i7 870 can be found at the interesting price of $294 (that's a 48% drop!). However, the Core i5 655K is placed at a confusing price-level because while the Core i5 650 retails at $179, the 655K costs $209. This wouldn't be a difficult choice if Intel didn't have their 4-cores/4-threads Core i5 750, which is being replaced for the 4-cores/4-threads Core i5 760 running at 2.8GHz for $205 "only".
And so our first question for this review is: What do you need more? Do you need 2 cores and more GHz? Or 4 cores with less GHz? Because that basically answers your question on which CPU (at this price levels) should you buy. With the Intel Core i5 655K you receive some extra features though, thus making overclock easier. But is the BX80616I5655K worth its value? Benchmarks reviews will analyze and test the Core i5 655K against many other CPUs in this article to answer those questions. Additionally, I'll add some extensive overclocking tests, including a subzero session in which I'll report the results and experiences obtained from this sample. Again, the only point about releasing a CPU with an unlocked multiplier is to make overclocking easier. In a simple case, brands and PC builders could offer a solution overclocked by default, without doing so much and without thinking about other components stability. The second user would be that without access to a mid/high-end motherboard or RAM. That user wouldn't be limited by overclocking the BCLK and then, the only necessary option would be CPU vCore voltage. Finally, there's always a user (like me) that just wants to overclock the max just for fun. I'll cover all these paradigms on my tests. Said enough, read and enjoy the article!
Manufacturer: Intel Corporation
Product Name: Intel Core i5 655K Model Number: BX80616I5655K
Price As Tested: $209.99
Full Disclosure: The product sample used in this article has been provided by Intel. Intel Core i5 655K Features
|
|||||||||||||||||||||||||||||||||||||||||||||||||||||||||||||||||||||||||


|
Brand Name & Processor Number |
Base Clock Speed (GHz) |
Unlocked |
Turbo Frequency (GHz) |
Cores/Threads | Cache | Memory Support | TDP |
Pricing (1Ku) |
| Intel Core i7 980X | 3.33 | Core, DDR3, Power |
Up to 3.6 | 6/12 | 12MB | 3 channels DDR3-1333 | 130W | $999 |
| Intel Core i7 875K |
2.93 | Core, DDR3, Power |
Up to 3.6 |
4/8 | 8MB | 2 channels DDR3-1333 |
95W | $342 |
| Intel Core i7 860 | 2.8 | DDR3 Only |
Up to 3.46 |
4/8 | 8MB | 2 channels DDR3-1333 |
95W | $284 |
| Intel Core i5 760 |
2.8 | DDR3 Only |
Up to 3.33 | 4/4 | 8MB | 2 channels DDR3-1333 |
95W | $205 |
| Intel Core i5 655K |
3.2 | Core, DDR3, Power |
Up to 3.46 | 2/4 | 4MB | 2 channels DDR3-1333 |
73W | $216 |
| Intel Core i5 650 |
3.2 | DDR3 Only |
Up to 3.46 |
2/4 | 4MB | 2 channels DDR3-1333 |
73W | $176 |
| Intel Core i3 540 | 3.06 | DDR3 Only |
N/A | 2/4 | 4MB | 2 channels DDR3-1333 | 73W | $117 |
Closer Look: Core i5 655K Unlocked
Let's get a closer look at the Intel Core i5 655K CPU. This processor comes with an unlocked multiplier making overclock easier for everyone. This basically means that you won't ever need to raise the universal BCLK (and thus, the memory clock) in order to achieve high clocks with your CPU. That also means you won't need to raise any voltages other than CPU vCore. This feature can be very tempting for people beginning at the overclocking scene. They will care about CPU stability and voltage instead of taking extra care of all other parameters to reach high clocks. Also, if you have a non-expensive motherboard which won't overclock the BCLK or RAM as good as you thought, you won't be limited to it, and since 99% of the motherboards sold in the market allow you to increase CPU voltage (at least), it's almost safe to say you'll be able to overclock your CPU way higher than with a locked multiplier. Have a closer look at CPU-Z v1.55 which now correctly recognizes this processor:
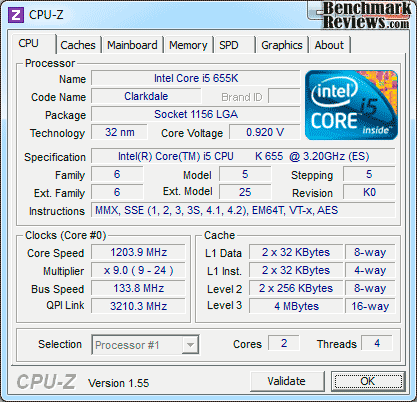
Intel Core i5 655K with Speedstep and EIST enabled.
Please don't be scared of CPU frequency since EIST and Speedstep are enabled on that image. While idling, the Core i5 655K lowers its CPU multiplier down to 9x and CPU voltage goes somewhere around 900mV. Even CPU-Z says the multiplier can be increased to 24x, that's not true as the CPU allows you raise this number up to more than 50x (completely unnecessary). If you're lucky enough, your CPU will have a VID around 1.2v or lower. In our case, the CPU VID was 1.2v, but because of vDroop CPU-Z actually showed something around 1.16v at full Load.
The Core i5 655K comes with unlocked memory multipliers, and so you can choose 1066MHz, 1333MHz, 1600MHz, 1866MHz and up to 2133MHz without raising the BCLK. That allows you to run high-frequency RAM without the needs of overclocking your setup. What other reviews didn't mention about the features of this CPU is that not only the multiplier comes unlocked, but actually, there's some kind of enhanced Turbo Boost technology included with it. For those who have been out of the game for a while, Turbo Boost technology allows the CPU to increase the frequency (raising CPU multiplier) at Load. For example, this feature was seen at Nehalem's launch in 2008. While the Core i7 920 worked with a 20x multiplier (2.66GHz), it could increase it to 21x at load, and even 22x if the load was targeted at 1 core, resulting into 2.93GHz at the end. Of course, this doesn't mean in wouldn't decrease voltage and speed at idle mode. Somehow, this was an interesting way of increasing the CPU efficiency only when it was needed.
Clarkdale CPUs have a very similar Turbo-Boost technology, so when 2 cores are at full load, the CPU increases multiplier by +1, but if only core is at load, it can be increased by +2. Lynnfield based CPUs on the other hand, have an improved technology which increase from 1 to 4 multipliers depending on how many cores are loaded. So, if the original multiplier was 20 running at 2.66GHz, it could rise up to 24 resulting into 3.19GHz with 1 core loaded. The Core i5 655K allows you to set the Turbo-Boost multiplier just where you want it to be. If you properly flash your motherboard to add support for this CPU, you'll be able to set your multiplier starting with +1 and up to +15 multipliers.
In our tests, we used the ASUS Maximus III Formula motherboard and it took us 2 minutes to update our BIOS and start using this new feature which ASUS calls Turbo-Unlocker. Somehow, the max Turbo-Boost setup you'll be able to achieve will be the same as the overclocked setup, but it also means your CPU will start at stock speed, lowering to 9x multiplier when idling, and increasing the multiplier depending on your Turbo Boost-ratio. Of course, if you set a +15 turbo-ratio, you'll end with a 5.18GHz setup which obviously won't boot, but if you make an approach to something much more tested, you could add 4-5 multipliers without adding extra voltage reaching up to 3.85GHz with Turbo-Boost when needed. At the end, that's better than the +4 multiplier allowed by Lynnfield CPUs, but this time in a Clarkdale-based processor.
Core i5 655K Stock Voltage Overclocking
It would be foolish if Benchmark Reviews didn't test this CPU at overclocked settings. The unlocked multiplier is just screaming for some extra GHz and we're pleasing him. As it's our methodology, I'll start overclocking the Core i5 655K with stock voltage. Again, default's VID for the processor was 1.2v, but you're watching 1.168v at full load because I disabled Load-line calibration (or enabling vDroop, in other words) in order to keep the CPU safe at high voltages. Stock-voltage overclocking is one of my favorite tests because it means CPU power consumption will remain almost the same while increasing CPU frequency. This results at a higher efficiency and normally can be the sweet point to keep safe temperatures while receiving some extra performance. Also, it can be done with stock heatsink without risking the CPU. Have a look at the next picture:

Can you overclock to 4GHz with stock voltage? Sure, no problem!
And so I was able to reach 4GHz with stock voltage and the CPU still passed all our tests and many hours of OCCT CPU Linpack. While I'm a little impressed with this sample there's no reason to think the unlocked multiplier helped to manage those settings. With a BCLK of 170MHz and the 24x multiplier, I should have done the same, and that can be done with many motherboards nowadays. But to make things easier, I just raised the CPU multiplier up to 30 and that was enough to keep the CPU 100% stable. Please, keep in mind that I was using the Noctua's NH-D14 heatsink and if you're using something less powerful like the stock heatsink, you might not be able to reach those frequencies at stock voltage. But, who buys an unlocked CPU to use it with stock heatsink anyway?
Core i5 655K Max Stable Frequency
My next target was to find the maximum stable frequency at "safe-voltage" conditions. I set 1.4v as the maximum I should use in a 32nm CPU at full load. I would actually think it's a lot of voltage, but with vDroop enabled, the CPU actually loaded at 1.384v. Here I managed to get 4.55GHz completely stable with temperatures around 60 degrees at Load (Prime95 blend). That said, those temperatures aren't that bad. Considering a full loaded Quad Core CPU could easily reach 80C at 4GHz, this Dual-Core CPU was working just right.

Maximum stable frequency on Air-cooling was 4.55GHz.
If I wanted to shave some milli-volts, I would just have to decrease the frequency to 4.4-4.5GHz and lower the voltage somewhere around 1.35v, but having the right cooler helps a lot in these conditions, so I wasn't scared of running it with higher voltage. For our tests, we used both overclocked setups (4GHz and 4.55GHz) to run the benchmarks. As I've said before, it would be silly if Benchmark Reviews didn't test this CPU at overclocked settings. Otherwise, it would perform just as a Core i5 650, nothing more.
Core i5 655K Max Frequency on Air Cooling
Last but not least, I fired some extra voltage to this CPU to find out the maximum frequency it would reach on air-cooling. Please remember I'm using one of the best coolers out there (Noctua NH-D14) and a high-end P55 motherboard (ASUS Maximus III Formula). This time, I decided I wouldn't go over 1.55v and reached 4.95GHz on plain air-cooling! I was very satisfied with the results obtained on air, especially because you don't find a 4.5GHz stable CPU for 24/7 just around the corner. Considering CPU frequency has more importance than the number of cores on daily applications and games, I consider this to be a better option than the Core i5 760 at the moment unless you're doing some heavy-multitasking, video conversion or whatever takes 4 cores at full load (gaming is not included, yet).

The Core i5 655K did 4.95GHz on air-cooling. Not bad!
I really don't recommend trying your CPU at 1.55v. In fact, anything above 1.4v for Clarkdale CPUs could be very dangerous if not managed with the right motherboard, PSU and cooling. We're not including tests at 4.95GHz and neither persuading you to try these voltages within extreme conditions. Benchmark Reviews won't be responsible for any badly-overclocked CPUs after reading this article, so please, keep your levels at safe conditions. However, the Core i5 655K Unlocked processor provided for this review still works and overclocks stable as a rock after the tests.
CPU Testing Methodology
For those who didn't read the previous page, I will test this CPU at 3 different conditions. Of course, the first condition is running it at stock voltages with stock frequencies, and this setup should perform exactly as the Core i5 650 CPU. The second setup consists on the same CPU but this time overclocked to 4GHz with 30x multiplier. This configuration should outperform the Intel Core i5 680 as the final frequency is higher than the biggest of the Clarkdale's brothers. Finally, the same CPU will be overclocked at 4.55GHz and proven to be 100% stable, I'll run our benchmarks suite in order to obtain some highly-overclocked results. All the results are done with the Noctua NH-D14 Air-cooler and a high-end P55 motherboard. For more details, have a look at the systems described below.

While we normally have to struggle between overclocked setups to keep results as objective as possible, this CPU made tests easier. At Benchmark Reviews, we normally find out a CPU multiplier + BCLK frequency combination in order to prevent memory from overclocking along the CPU. That's the only way we can ensure our tests won't be affected by other parameters. However, since the Core i5 655K comes with an unlocked multiplier, we just had to raise it alone without increasing BCLK, and thus, memory and QPI frequencies. Speed-step and Turbo-Boost are awesome features but they were disabled in order to keep results as precise as possible.
In this review, we will be comparing performance with the recently reviewed AMD Athlon II X2, X3 and X4 CPUs. I also tested in the same platform the Intel Core i5 680 (bigger brother) and the Core i5 750 as it turns to be its direct competition at lower frequency but with 4 cores. For comparison, we also tested the Core i7 860 4-cores/8-threads CPU and the Intel Core i7 920 was added to the results. Gaming benchmarks along with power consumption tests are not comparable between platforms because of the differences between the systems and so those results are limited to P55-platform results, but for CPU benchmarks you'll find all the CPUs mentioned below:
Intel X58 Test Platform
-
Processor: 2.66GHz Intel Core i7 920 Bloomfield/Nehalem BX80601920
-
Motherboard: MSI X58 Pro LGA1366 Intel X58 ATX
-
System Memory: Kingston 6GB (3 x 2GB) KVR1333D3K3/6GR DDR3 1333MHz (PC3 10666) (CL7-7-7-20)
-
Video: MSI N285GTX-T2D1G-OC NVIDIA GTX 285 1GB
-
Disk Drive 1: OCZ Agility Series OCZSSD2-1AGT30G 30GB SSD
-
Disk Drive 2: SEAGATE Barracuda ST31500341AS 1.5TB SATA
-
PSU: Corsair CMPSU-850TX 850W
-
Operating System: Windows 7 Home Premium x64
AMD Socket AM3 Test System
-
Processor: 3.0GHz AMD Athlon-II X4-640 ADX640WFK42GM
-
Processor: 3.2GHz AMD Athlon-II X2-260 ADX260OCK23GM
-
Processor: 3.1GHz AMD Athlon-II X3-445 ADX445WFK32GM
-
Motherboard: ASUS M4A785TD-M EVO 785G Motherboard with 128MB Sideport Memory
-
System Memory: 2x2GB Patriot Gamer Series DDR3 (1333MHz@7-7-7-21)
-
Video: MSI N285GTX-T2D1G-OC NVIDIA GTX 285 1GB; Onboard ATI Radeon HD 4290
- Disk Drive 1: OCZ Agility Series OCZSSD2-1AGT30G 30GB SSD
- Disk Drive 2: SEAGATE Barracuda ST31500341AS 1.5TB SATA
- PSU: Corsair CMPSU-850TX 850W
- Operating System: Windows 7 Home Premium x64
Intel P55 Test Platform
- Processor: 3.2GHz Intel Core i5 655K Unlocked CPU / Stock frequency / Overclocked to 4.0GHz / Overclocked to 4.55GHz
- Processor: 3.6GHz Intel Core i5 680 CPU
- Processor: 2.66GHz Intel Core i5 750 CPU
- Processor: 2.8GHz Intel Core i7 860 CPU
- Motherboard: ASUS Maximus III Formula P55 Motherboard
- System Memory: 2x2GB G.Skill ECO Series DDR3 (1333MHz @ 7-7-7-20)
- Video: Powercolor ATI Radeon HD 5850 1GB
- Disk Drive 1: OCZ Agility Series OCZSSD2-1AGT60G 60GB SSD
- Disk Drive 2: SEAGATE Barracuda 1TB SATA
- PSU: Antec Signature 850W
- Operating System: Windows 7 Ultimate x64
Benchmark Applications
-
EVEREST Ultimate Edition v5.50 by Lavalys
-
Passmark Performance Test v7.0 x64
-
PCMark Vantage v1.0.2.0 64-bit by Futuremark Corporation
-
SiSoft Sandra 2010.1.16.26
-
Cinebench R11.5
-
STALKER Call of Pripyat Benchmark
- Unigine Heaven 2.1 DX11 Benchmark
- Final Fantasy XIV Benchmark 1080p
EVEREST Benchmark Tests
Lavalys EVEREST is an industry leading system diagnostics and benchmarking solution for enthusiasts PC users, based on the award-winning EVEREST Technology. During system optimizations and tweaking it provides essential system and overclock information, advanced hardware monitoring and diagnostics capabilities to check the effects of the applied settings. CPU, FPU and memory benchmarks are available to measure the actual system performance and compare it to previous states or other systems. Furthermore, complete software, operating system and security information makes EVEREST a comprehensive system diagnostics tool that offers a total of 100 pages of information about your PC.
All of the benchmarks used in our test bed rely on basic x86 instructions and consume very low system memory while also being aware of Hyper Threading, multi-processors, and multi-core processors. While the EVEREST CPU tests really only compare the processor performance more than it measures platforms, it still offers a glimpse into what kind of power each platform possesses.
Queen and Photoworxx tests are synthetic benchmarks that operate the function many times and over-exaggerate by several magnitudes what the real-world performance would be like. The Queen benchmark focuses on the branch prediction capabilities and misprediction penalties of the CPU. It does this by finding possible solutions to the classic queen problem on a chessboard. At the same clock speed theoretically the processor with the shorter pipeline and smaller misprediction penalties will attain higher benchmark scores.

Like the Queen benchmark, the Photoworxx tests for penalties against pipeline architecture. The synthetic Photoworxx benchmark stresses the integer arithmetic and multiplication execution units of the CPU and also the memory subsystem. Due to the fact that this test performs high memory read/write traffic, it cannot effectively scale in situations where more than two processing threads are used. The EVEREST Photoworxx benchmark performs the following tasks on a very large RGB image:
- Fill
- Flip
- Rotate90R (rotate 90 degrees CW)
- Rotate90L (rotate 90 degrees CCW)
- Random (fill the image with random colored pixels)
- RGB2BW (color to black & white conversion)
- Difference
- Crop
In Photoworxx test, more cores offer more performance. That's easy to read when you see the Core i7 860 and i7 920 at the top of the chart. The Athlon II X4 follows behind. The Core i5 655K performed just between the Athlon II X3 and Athlon II X2. When overclocked to 4 Ghz, it left the Athlon II X3 behind, but it didn't reach the Athlon II X4 even at 4.55GHz. In conclusion, in this kind of tests, more cores really give higher advantage, but still, it's nice to see that overclocking the Core i5 655K was enough to overtake the performance of an X3 processor, especially because the Core i5 series are more expensive than the X3 Athlon II. However, in CPU Queen tests, the Core i5 with Hyper-Threading enabled is more than enough to reach the Athlon II X4, and if overclocked it outperforms the Core i7 920, which demonstrates that there are some cases where more GHz are just as good as more cores.
The Zip Library test measures combined CPU and memory subsystem performance through the public ZLib compression library. ZLib is designed as a free lossless data compression library for use on virtually any computer hardware and operating system. The ZLib data format is itself portable across platforms and has a footprint independent of input data that can be reduced at some cost in compression.

As far as file compression performance is concerned, the Core i5 655K performs better than the Athlon II X2 & X3 processors. Overclocking to 4GHz reaches the Core i5 750 and overclocking to 4.5GHz helps reaching the Athlon II X4. Still, it can't really compete against the Core i7 920 or Core i7 860 in this benchmark.
The AES integer benchmark measures CPU performance using AES data encryption. It utilizes Vincent Rijmen, Antoon Bosselaers and Paulo Barreto's public domain C code in ECB mode and consumes 48 MB of memory. The latest Core i5 CPUs have updated AES instructions which makes them impossible to reach even for the Athlon II X4 or the Core i7 920. Basically, the boost obtained by this update multiply the final results by 10 (at least). For example, while the Core i7 920 was the fastest CPU in the AES benchmark without updated instructions, it scored a "poor" 22,368 rank. The Core i5 655K without overclock reached 211,634 points. In conclusion, if you're looking a new CPU to work with AES instructions, there's no doubt the Core i5 series will fit to your needs.

FPU benchmarks report a similar pattern between them. Basically, what you see on FPU Julia gets repeated at FPU mandel or FPU SinJulia results, just at different levels. For FPU tests, AMD CPUs are slower than Intel's. The Core i5 655K easily tops the Athlon II X4 and when overclocked, it passes the Core i5 680. Unluckily, the Core i7 920 and the Core i7 860 are still ahead by at least 20% of an overclocked Core i5 655K, but hey, you already passed the Core i5 750 there.
Passmark Performance Test
PassMark Performance Test is a PC hardware benchmark utility that allows a user to quickly assess the performance of their computer and compare it to a number of standard 'baseline' computer systems. The Passmark Performance Test CPU tests all benchmark the mathematical operations, compression, encryption, SSE, and 3DNow! instructions of modern processors.
In our tests there were several areas of concentration for each benchmark, which are combined into one compound score. This score is referred to as the CPU Mark, and is a composite of the following tests: Integer Math, Floating Point Math, Find Prime Numbers, SSE/3DNow!, Compression, Encryption, Image Rotation, and String Sorting. For this review, we've also decided to run the memory benchmark, which results in a composite score based on the following tests: small block allocation, cached read, uncached read, write performance, and large block allocation.

The Passmark performance tests reveal different results than Everest. In the CPU mark score, the Core i5 655K almost doubles the performance gotten by the Athlon II X4 CPU. Overclocked to 4.0GHz lets it surpass the Core i5 680 (as it becomes obvious), and overclocked to 4.55GHz, the Core i5 655K positions itself above the Core i5 750 but a little bit below the Core i7 920 processor.

Again, when it comes to memory bandwidth, Intel is still ahead AMD in every benchmark. The results were pretty much similar to the CPU scores against AMD, but more interesting is that the Core i5 655K overclocked scored higher memory mark results than every other processor. Even if the CPU was overclocked, remember we only raised the CPU multiplier, and that means the memory and QPI frequency are still the same as with the stock frequency results. It was weird to see the Core i5 655K passing the Core i7 920 and Core i7 860 without problems even at stock frequencies.
PCMark Vantage Benchmark Tests
PCMark Vantage is an objective hardware performance benchmark tool for PCs running 32- and 64-bit versions of Microsoft Windows Vista or Windows 7. PCMark Vantage is well suited for benchmarking any type of Microsoft Windows Vista/7 PC: from multimedia home entertainment systems and laptops, to dedicated workstations and high-end gaming rigs. Benchmark Reviews has decided to use a few select tests from the suite to demonstrate simulated real-world processor usage in this article. Our tests were conducted on 64-bit Windows 7, with results displayed in the chart below.
TV and Movies Suite
- TV and Movies 1 (CPU=50%, RAM=2%, GPU=45%, SSD=3%)
- Two simultaneous threads
- Video transcoding: HD DVD to media server archive
- Video playback: HD DVD w/ additional lower bitrate HD content from HDD, as downloaded from net
- TV and Movies 2 (CPU=50%, RAM=2%, GPU=45%, SSD=3%)
- Two simultaneous threads
- Video transcoding: HD DVD to media server archive
- Video playback, HD MPEG-2: 19.39 Mbps terrestrial HDTV playback
- TV and Movies 3 (SSD=100%)
- HDD Media Center
- TV and Movies 4 (CPU=50%, RAM=2%, GPU=45%, SSD=3%)
- Video transcoding: media server archive to portable device
- Video playback, HD MPEG-2: 48 Mbps Blu-ray playback
Gaming Suite*
- Gaming 1 (CPU=30%, GPU=70%)
- GPU game test
- Gaming 2 (SSD=100%)
- HDD: game HDD
- Gaming 3 (CPU=75%, RAM=5%, SSD=20%)
- Two simultaneous threads
- CPU game test
- Data decompression: level loading
- Gaming 4 (CPU=42%, RAM=1%, GPU=24%, SSD=33%)
- Three simultaneous threads
- GPU game test
- CPU game test
- HDD: game HDD
Music Suite
- Music 1 (CPU=50%, RAM=3%, GPU=13%, SSD=34%)
- Three simultaneous threads
- Web page rendering - w/ music shop content
- Audio transcoding: WAV -> WMA lossless
- HDD: Adding music to Windows Media Player
- Music 2 (CPU=100%)
- Audio transcoding: WAV -> WMA lossless
- Music 3 (CPU=100%)
- Audio transcoding: MP3 -> WMA
- Music 4 (CPU=50%, SSD=50%)
- Two simultaneous threads
- Audio transcoding: WMA -> WMA
- HDD: Adding music to Windows Media Player
* EDITOR'S NOTE: Hopefully our readers will carefully consider how relative PCMark Vantage is as "real-world" benchmark, since many of the tests rely on unrelated hardware components. For example, per the FutureMark PCMark Vantage White Paper document, Gaming test #2 weighs the storage device for 100% of the test score. In fact, according to PCMark Vantage the video card only impacts 23% of the total gaming score, but the CPU represents 37% of the final score. As our tests in this article (and many others) has already proven, gaming performance has a lot more to do with the GPU than the CPU, and especially more than the hard drive or SSD (which is worth 38% of the final gaming performance score).

TV & Movies Suite is a very balanced test where every component of the PC counts for the final result. Here, we had similar results on every system, being the Athlon II X2 & X3 processors the slowest of all. In fact, even if the Core i5 655K performs slower than all the other P55-based CPUs, it was enough to reach the performance of the Athlon II X4. The Core i5 750 is still around 15% higher and the Core i7 860 gets the highest score being almost 25% faster.
The gaming suite also relies on CPU and SSD in some cases. That's not really happening at real-world games, where the GPU seems to be determining 99% of the overall performance. Here, the Core i5 655K scored a higher score than the Athlon II X4 by a small amount. Raising CPU frequency or CPU cores quickly enhances the final score of this benchmark. For example, while the Core i5 750 and the Core i7 CPUs were 30%-40% faster than the Core i5 655K, once you start overclocking, the results can get pretty close. At 4.55GHz, it almost reached the faster Core i7 860 leaving the Core i7 920 and Core i5 750 behind by a good percentage.
The PCMark music suite tests not only audio transcoding, but also webpage rendering using popular web-based music store formats. These tests rely heavily on the CPU and it appears that clock speed takes the advantage here. At stock frequencies, the Core i5 655K already performed better than the Core i7 860. Hence, when overclocked to 4.0 GHz it only got better and reached the top of the charts. Raising it to 4.55GHz only got it better. So, the pattern is very simple to read. If you have more GHz, you score better for music benchmarks, and perhaps this is kind of true considering many audio transcoding programs rely a lot in GHz using 1 core-only while working.
SiSoftware Sandra CPU Arithmetic Benchmark
SiSoftware Sandra (the System ANalyser, Diagnostic and Reporting Assistant) is an information & diagnostic utility. It should provide most of the information (including undocumented) you need to know about your hardware, software and other devices whether hardware or software.
It works along the lines of other Windows utilities, however it tries to go beyond them and show you more of what's really going on. Giving the user the ability to draw comparisons at both high and low-level. You can get information about the CPU, chipset, video adapter, ports, printers, sound card, memory, network, Windows internals, AGP, PCI, PCI-X, PCIe (PCI Express), database, USB, USB2, 1394/Firewire, etc.
The SANDRA DhryStone and Whetstone tests are CPU tests that run completely within the CPU + cache memory itself. These tests are perfect for seeing general efficiency per processing core. Dhrystone is basically a suite of arithmetic and string manipulating programs and is an older CPU tests. Even so, it remains a simple and accurate way to show RAW CPU processing performance. The whetstone benchmark primarily measures floating-point arithmetic performance.

The tests reveal the difference gained by adding cores, especially on AMD results. However, AMD is still behind Intel on these tests as the Core i5 655K performs a little bit better than the Athlon II X4. Once overclocked to 4GHz, it performs better than the Core i5 680 but still lacks of performance to reach the Core i5 750 on both tests. Going up to 4.55GHz gives a small advantage at Dhrystone benchmark, but a much bigger one in FPU/Whetstone tests. Still, there is no way the Core i5 can reach the i7s at this tests even overclocked since they're still above by 30%.
Cinebench R11.5 Benchmark
Maxon Cinebench is a real-world test suite that assesses the computer's performance capabilities. Cinebench is based on Maxon's award-winning animation software, Cinema 4D, which is used extensively by studios and production houses worldwide for 3D content creation. Maxon software has been used in blockbuster movies such as Spider-Man, Star Wars, The Chronicles of Narnia and many more. Cinebench Release 11.5 includes the ability to more accurately test the industry's latest hardware, including systems with up to 64 processor threads and the testing environment better reflects the expectations of today's production demands. A more streamlined interface makes testing systems and reading results incredibly straightforward.
The Cinebench R11.5 test scenario uses all of a system's processing power to render a photorealistic 3D scene, "No Keyframes" the viral animation by AixSponza. This scene makes use of various algorithms to stress all available processor cores. The OpenGL graphics card testing procedure uses a complex 3D scene depicting a car chase with which the performance of your graphics card in OpenGL mode is measured. During the benchmark tests the graphics card is evaluated by way of displaying an intricate scene that includes complex geometry, high-resolution textures, and a variety of effects to evaluate the performance across a variety of real-world scenarios.
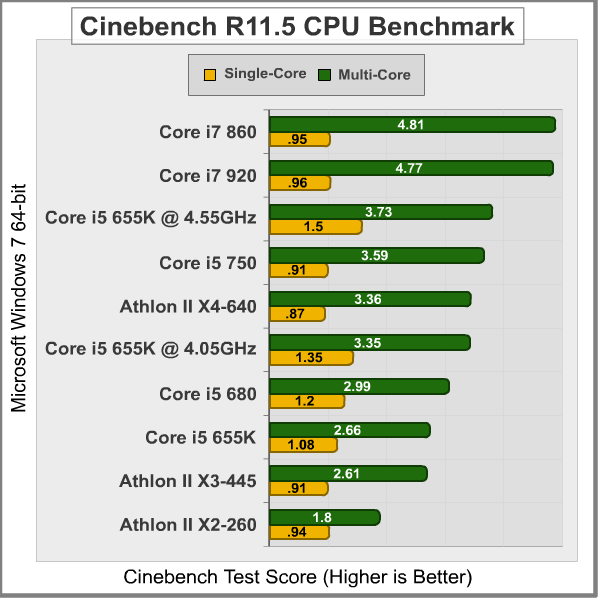
Cinebench quickly scales with more threads and more GHz. Take a look at single-core results, and you'll find out that the Core i5 655K outperforms every CPU running at lower speeds, not mattering if it's a single-core or hexa-core CPU. The results obtained with the Multi-core benchmark reveal that the Core i5 655K is faster than the Athlon II X3, but not faster than the Core i5 750, neither the Athlon II X4. Once you start overclocking you'll quickly enhance the performance up to somewhere above the Core i5 750, and that's pretty much all you're going to get, because even with a 5GHz overclock, it isn't possible to compete against 8 threads in this particular benchmark. These kind of benchmarks reveal us the right CPU if you're into computer animation, where you'll take full advantage of multi-cores and not only CPU GHz.
Video Game Benchmarks
PC-based video games can depend heavily on the CPU if the attached GPU (Graphics Processing Unit) is less powerful, or the graphics settings are configured so low that they create no strain on the video card and must rely purely on system processing speed; a phenomenon known as CPU-dependence. The opposite is true when the video game has a powerful video card installed, and can handle all graphical demands without receiving assistance from the CPU. Benchmark Reviews has proven consistently that, with a high end GPU in use, frame rates are not often noticeably impacted by changes in processor or RAM. Since it would be very common if someone bought a Corei3/i5 CPU and pair it with a mid/high end GPU to build a gaming machine, we considered to put the P55 platform to test with the ATI Radeon HD5850 and throw some games to it.
Our next test is the recently released Final Fantasy XIV benchmark. Final Fantasy games are legend between the fans of big games. While this title won't have the latest graphics as it's more like a port to the PC, it runs at 1080p resolution and it turns to have decent graphics. This benchmark won't be as slow as Crysis or Metro 2033, but they took care to build a ranking system where you won't be able to easily achieve superb results unless you got a pair of HD5970 and a Core i7 980X. As for the scores, according to Final Fantasy's webpage, anything between 3000 and 4500 points is capable of running the game on default settings... yes, that's how they consider the HD5850.

As you can actually confirm, the results show a very small difference between CPUs. The Core i5 655K is the slowest of them, but the Core i7 860 only performed 11% better and it's the fastest CPU in the charts. If the i5 655K gets overclocked it almost reaches the Core i5 750, but again, the difference is so small that it would better worth to pay for a better GPU solution instead of a better CPU. Actually, these are the biggest gaps you'll see on gaming benchmarks since most of them won't care about the CPU cores/frequency. Let's have a look at Unigine's Heaven 2.1 DX11 Benchmark. With tessellation enabled and running at 1080p resolutions with 4xAA and 16xAF those are the results obtained in our tests:
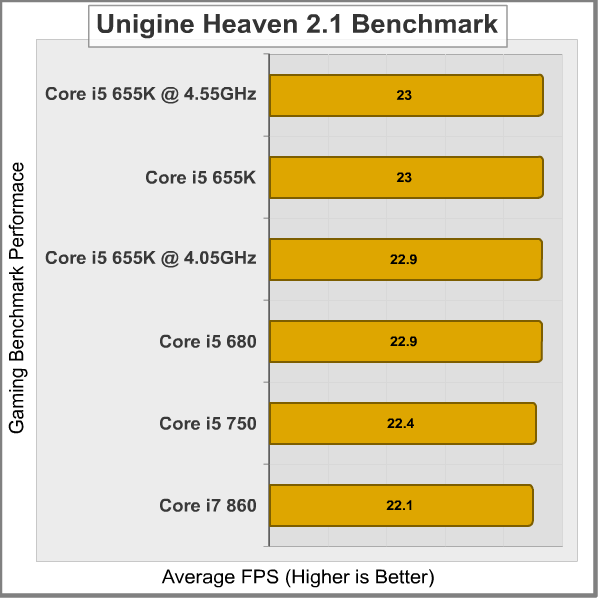
It's funny to see how the Core i7 860 performed slower than any other CPU in this benchmark. The biggest gap between those results is composed by 0.9 FPS, which is less than 1 FPS, and close to nothing. The Core i5 655K at 4.55GHz performed faster than any configuration, but the same CPU at stock speeds performed better than overclocked to 4GHz. That only means that the difference is so small that you can't even trust the results because of the margin error. Here, I'm only showing that CPU games/benchmarks won't really care about having a dual core vs. a quad core CPU, or 2.6GHz against 4.5GHz. At least, not until you decrease game's settings and resolution to make it more CPU-dependant.
Our last benchmark consists on running the newest STALKER: Call of Pripyat level at different weathers. The results shown are based on the daylight portion of the benchmark running at 1920x1080 resolutions with 4xMSAA and al details on high. Let's see how different CPUs perform with this game:

Again, the biggest gap between the results obtained barely passes 1 FPS. Why would you care about 1 FPS? Well, this only confirms CPU isn't that important for games nowadays, especially when you have the right GPU to play them. The Core i5 655K performed better at 4GHz than at 4.55GHz, which finally doesn't make sense, and it's attributed to the small error margin seen in all our tests.
Core i5 655K Power Consumption
No matter what people say, Intel is really a winner in the power consumption area thanks to the 32nm manufacture. In this section, we're testing the CPU at Idle and then at full load with Prime95 Blend's test to measure how much watts does the whole PC consumes. Even if Lynnfield CPUs process is done at 45nm, they really work well at idle mode performing very similar to Clarkdale CPUs (32nm). In these tests, I enabled Turbo Boost and Speedstep in order to ensure minimum and maximum power consumption as everyone should use it. The PSU efficiency has a clear effect on the overall results and we used the Antec's Signature 850 watts which is 80 Plus Bronze Certified. Using a Kill-a-watt P3 International power meter at the plug of the PSU, those were the results obtained:

The Core i5 655K has a power consumption of 97 watts at idle mode and 133 watts at full load. The interesting part here would be the full-loaded results. The Core i5 680 consumes 5-6 extra watts against its little brothers but keeps the idle mode at the same wattage. Once you overclock the Core i5 655K to 4GHz (stock voltage), there's a increase of 6 watts to reach the Core i5 680 power consumption at full load, and at idle it increases 4 watts which is close to nothing.
Things start to get interesting as I raise the CPU Core voltage by 150mV (from 1.2v to 1.35v), and that increases 6 watts at idle but 25 extra watts at full load. Anyway, it's still 15-20 watts less compared to the Core i5 750 and the Core i7 860 (which performs better than the i5 750 by the way). As you can see, there's a great difference (50 watts) between the Clarkdale and Lynnfield CPUs, but at idle mode, the results are close to identical. Intel has done a good job here, because 2 years before, a Core 2 Duo would consume around 200 watts at full load without hyper threading and performing slower. Right now, we're anxious to test the new "Sandy-Bridge" CPUs from Intel, as we expect to shave some extra watts for a high/mid/low-end platform. Only time will tell the truth about our speculations.
Intel Core i5 655K: Subzero Overclocking
But I hear you crying: won't there be any extreme overclocking tests? Yes, after testing the Core i5 655K and discovering that it overclocks very good on air, I had nothing else to do but to test it on extreme conditions. What I'm using today is what you guys name: Dry Ice. For those who are new to the overclocking scene, benching with dry ice means I'll put a CPU aluminum put over the IHS and make the proper insulation of the motherboard to avoid condensation. Basically, I use kneaded eraser and foam to achieve proper insulation, and then I mount the CPU pot and add some armaflex foam with lots of paper around it. You'll notice in the next image that I used a delta/sensflow fan to prevent from heating around the socket area.

After that, I pour some pure acetone on the pot to enhance heat conduction at the base and after that I'll start testing the motherboard to see if everything is alright. If nothing goes wrong, I'll start pouring Dry Ice inside the pot and add some acetone if needed and there I'll find if the CPU has a cold bug problem (that means it won't work at certains temperatures below some point). For my bad luck, the CPU or the motherboard had a problem booting below -68C, but it wasn't that difficult to avoid those temps since they're very close to the limit of the Dry Ice. At this point, I just had to remember the CPU was pretty good on air and that means (many times) that it won't be that good on subzero temperatures, but anyway, the session had started already and there was no way back.
As I started testing, my fear about having a bad CPU for subzero tests got bigger. At 1.4v I reached 4.9GHz without problems but 5GHz was getting impossible to reach in a stable way. I had to raise the voltage up to 1.5v to finally pass 5GHz and reach a maximum frequency of 5.2GHz as shown in the next picture. CPU-Z validation can be found here. I was able to run some Super Pi tests and anything that used no more than 1 core was run-able. I got a super-pi time of 7.9 seconds before my OS got corrupted and I couldn't bench for the next 2 hours.

Since I didn't know my OS was corrupted, I spent almost 2 hours trying different settings that would let me boot and enter to Windows 7 desktop. After several tries and finding out that the CPU wouldn't boot at stock speeds I feared the CPU would have burned or condensation was starting to appear below the motherboard. Lucky enough the problem was that the OS boot sector got corrupted after several BSODs and finally I decided to format the SSD and in 5 minutes (yes, that's what an SSD takes to install full OS) I was benching again.

At the end, no matter what I did, the CPU wasn't able to go above 5.2GHz. It seemed that anything above 1.55v for the vCore only made things worse and less stable. At the end, I was able to do some Super Pi 32M runs at 5.1GHz, but it wasn't as impressive as I expected (around 5.5GHz). The hypothesis about a CPU being good on air but bad at subzero temps was true. I tried changing Memory multipliers, lowering QPI/Uncore frequency and disabling as many chipsets on the motherboard as it allowed but everything was worthless. Having found the max frequency of this specific sample I proceeded to uninstall everything and start defrosting the CPU pot. That's how my subzero session ended...
I can't say if the CPU was really bad, or the motherboard isn't up to par it, but remember this is only 1 CPU. Even if I tested 3-5 different steppings I couldn't draw a conclusion about overclocking performance. Overclocking is like the lottery, sometimes you're lucky and get a nice chip, sometimes even if you were the best overclocker, you won't be able to reach anything interesting. That's how it works. But hey, the CPU overclocks very well on air-cooling, and considering 99% of the time it will be installed under an air-cooler, I think it's not that bad.
Intel Core i5 655K Final Thoughts
The final purpose of an unlocked CPU is normally overclocking. As I've commented before, brands could offer an overclocked solution with their builds by just raising the multiplier a little bit. We all know that every CPU is different, and so that means that the overclocking capabilities won't be the same between them, but at least, there's a point where most of the CPUs will work without problems. Take a look at our sample. Without increasing vCore, it managed to do 4GHz 100% stable. That's 25% extra performance with the same watts consumed, which increases overall efficiency. Now, let's say some Core i5 655Ks won't reach more than 3.8GHz and some others could do 4.1GHz on stock voltage. At least, I think it's safe to say that every Core i5 655K will do at least 3.6GHz 100% stable, and they won't even have to think on overclocking the BCLK or increasing RAM frequency. That, or they could increase the Turbo-Core multipliers by +2 and reach the performance of the Core i5 680.
Our sample did 4GHz on stock voltage consuming 6 extra watts at full load.
Of course, whether you choose this processor or not, it all depends on your necessities. In our Benchmarks, we demonstrated the Core i5 655K outperforms almost any other processor thanks to the higher frequency, which can be raised a lot more if needed. If you're thinking on a gaming PC, or if you use many singled/dual applications then this CPU will be your best option, as you easily get the performance of the Core i5 680 for a lower price. But if you're into some heavy multi-tasking and your applications take advantage of multi-cores, then your best bet at this price point would be the Core i5 760, the AMD Phenom II 965 which is $20 less expensive, or even the AMD Phenom II X6 1055T at $199.
Intel's policy of competing against AMD with dual cores is somehow silly as AMD offers an X3/X4 CPU against a 2-cores/4-threads CPU offered by Intel. Intel is betting with CPU Gigahertz and performance, and it's actually making it interesting. If you go with AMD, you pay less and get more cores, but somehow, Intel matches performance with fewer cores unless the application is heavily multi-threaded. In many cases Intel will outperform AMD just by the GHz difference or the more efficient architecture.
Before moving to the next page, I'd like to say that if you're not into overclocking and you're not thinking on starting now, this CPU isn't for you. When used at stock values, the CPU will perform exactly the same as the Core i5 650, which costs $30 less. The Core i5 655K was made for overclockers and that's not going to change anywhere soon in the future. Even if you're doing some very light overclocking, that's something most CPUs will do with a low-end motherboard with poor BCLK overclocking capabilities, in which case, you'll be happier having 2 extra cores instead of more GHz.
Finally, I'd like to recall that overclocking by raising multiplier has no impact on the overall performance of the PC. That means you'll get the same performance by raising the multiplier to 30 than overclocking the BCLK to reach those 4 GHz. The difference is that when you raise the BCLK, you normally end raising memory/QPI/Uncore frequencies, and this gives a little boost you won't see by raising multiplier. In fact, that boost is so small that might be close to 1%, but if you really care of performance and overclocking, that 1% could be what you need to won the competition or set a new world record in a benchmark. But reality is a little different, because anyone who buys this CPU purely for benchmarking reasons will opt to raise the BCLK and the multiplier together to achieve some extra performance, and if you're really interested on it, that will probably mean you'll buy a high-end motherboard and RAM to match the CPU, where the stock CPU multiplier (24x) will be enough to maximize the frequency with a high (200+) BCLK. Therefore, for die-hard overclockers, this CPU kind of gets out of the game unless you want to try something new (which is normally fun for the vast majority).
BX80616I5655K Conclusion
The Core i5 655K performed decently against other CPUs. Thanks to features like Turbo Boost and Hyper-Threading, this sample was able to outperform the Athlon II X3 in nearly all the tests when they were targeted at multi-core solutions. Of course, if the benchmark measured pure raw Gigahertz, the Core i5 655K performed even better than 4-cores processors thanks to its higher frequency. The sample we received overclocked very well on air, but lacked of interest on subzero temperatures. Of course I know 99% of the time (if not more) the CPU will be working under air-coolers, but since it was targeted for overclockers, I would have loved to see some more MHz in our extreme tests. That said the Core i5 isn't as especial as you might think. Pair a good Core i5 660 CPU on a high-end motherboard and you could easily achieve 4GHz or similar on stock voltages, and somewhere near 4.5GHz adding some voltage, which means the only benefit of this CPU is that you don't need a high-complex BIOS & motherboard to achieve good frequencies. Again, if you're into overclocking, you probably have a decent setup, and you won't be limited by the motherboard. You'll also prefer to overclock by raising the BCLK to gain that small boost because of the higher QPI/Uncore/RAM frequency, so at some point, this CPU gets useless for "hardcore" overclockers.![]()
There's not really a lot to talk about the construction of a CPU. Intel is going forward with 32nm manufacture and this chip has very low power consumption but very decent performance. It also included Intel GMA HD graphics running at 733MHz, and the graphics unit overclocks a lot too. Since I haven't seen a CPU die in my hands at the middle of the tests or while being delivered to our labs, I think CPUs construction is just as it should be, and the same applies for AMD in almost all areas.
Functionality can be a very questionable point for unlocked CPUs. If you see it from the buyers view, the extra money you end paying for this CPU may not worth it unless you're looking for an overclocked setup and you don't use heavily threaded (multi-core) applications. Intel is doing some damage themselves as the 4-cores/4-threads Core i5 760 CPU can be bought by the same price and AMD is fighting with their Phenom II X6 CPU at the same price level. So, at the end, it all depends on what kind of applications you're daily using. In conclusion, if you need more GHz, go for the Core i5 655K, if you need something between GHz and multi-cores go for the Core i5 760. Finally, if you need more cores go for the AMD Phenom II X6. That, or take the Core i5 655K just because you find very fun to overclock your CPU to the max.
The Core i5 655K easily overclocks to 4GHz with the right components. It's a lot easier since you don't need a high-end motherboard and memory to reach those numbers. If you start adding voltage, you will find yourself with a stable CPU running somewhere between 4.4GHz or maybe up to 4.7GHz. Our sample did 4.55GHz and it could have been improved to 4.6GHz with the right parameters, but don't expect every CPU to perform the same way since each one is made different. Anyway, Intel's K processors are the response to AMD Black Edition CPUs which were taking the crown even at low-price levels. It's good to see some competition in the area because that helps the market to improve from both sides, and the users get the benefit of a wider range of products to choose from. Let's keep our fingers crossed to see something similar with the new Sandybridge architecture instead of fighting against locked features and overclocking in the next generations.
As of August 2010, Intel's Core i5 655K retails for $209.99 at NewEgg. With this price tag, it races against the Core i5 760 and the AMD Phenom II X6 1055T. While the competition doesn't have the unlocked features, they offer more cores for the same price, so, it's up to you to decide which CPU fits your necessities depending on the things analyzed on the article. The Core i5 650 is positioned at $179, being $30 cheaper than the unlocked CPU. Remember, if you're not planning on overclock this little baby, don't go for it. There are much better options at the same price point. But if you're into overclocking, you'll easily get the performance of the Core i5 680 ($309.99) or if you overclock it enough, you might even reach the Core i5 750 and a little bit more, depending on the applications you're running.
Pros:
+ Includes Intel GMA HD 45nm graphics unit
Cons:
Ratings:
-
Performance: 9.00
-
Construction: 9.50
-
Functionality: 8.50
-
Overclock: 9.50
-
Value: 8.50
Final Score: 9.00 out of 10.
Excellence Achievement: Benchmark Reviews Golden Tachometer Award.
Questions? Comments? Benchmark Reviews really wants your feedback. We invite you to leave your remarks in our Discussion Forum.
Related Articles:
- EVGA GeForce GTX560Ti FTW 448-Core
- World of Tanks 3D Vision Game Review
- Palit Radeon HD 4870 Sonic Dual Edition
- CyberPower UPS Battery Backup for PCs
- OCZ Reaper HPC PC2-9200 DDR2 1150MHz RAM Kit
- Razer DeathAdder 2013 Gaming Mouse
- ASUS VG236H 120Hz LCD Monitor 3D-Vision Set
- A4Tech Ultracore3 V7 Gun3 Gaming Mouse
- NZXT Phantom Full-Tower Case PHAN-001BK
- Diamond All-In-Wonder HD Premium AIW5000

Comments
This review was perfectly clear. Thank you, man