| Intel DP67BG P67-Express Motherboard |
| Reviews - Featured Reviews: Motherboards | |||||||||||||||||||||||||||||||||||||||||||||||||||||||||||||||||||||||||||||||||||||||||||||||||||||||||||||
| Written by David Ramsey | |||||||||||||||||||||||||||||||||||||||||||||||||||||||||||||||||||||||||||||||||||||||||||||||||||||||||||||
| Monday, 03 January 2011 | |||||||||||||||||||||||||||||||||||||||||||||||||||||||||||||||||||||||||||||||||||||||||||||||||||||||||||||
Intel DP67BG P67-Express Motherboard ReviewIntel processors are the favorites of many enthusiasts, but their motherboards have typically been relegated to OEM and business use since most of them did not offer the features enthusiasts wanted. Intel has accompanied the introduction of the new Sandy Bridge CPUs and their supporting Cougar Point chipsets with a slew of new motherboards, some of which are targeted at the same enthusiast market served by the likes of ASUS, MSI, Gigabyte, and others. Benchmarks Reviews tests Intel's top-of-the-line P67 motherboard, the Intel DP67BG "Burrage", to see if it has what it takes to compete in this arena. The P67 chipset is the "enthusiast" version of the Intel chipsets supporting the new Socket 1155 Sandy Bridge CPUs. (Intel is also introducing the H67, Q65, Q67, and B65 chipsets.) Since it's aimed at the enthusiast market, the P67 chipset does not support the integrated video features of the Sandy Bridge CPUs. 
In this review I'll be examining the features of the Intel Desktop Board DP67BG, and testing its overclocking performance against two ASUS P67-Express series motherboards.
Manufacturer: Intel The Intel P67 Express ChipsetThe Intel P67 Express chipset is the top-performing desktop version of a new range of "Cougar Point" mobile and desktop chipsets (10 in all). It's an evolutionary development of the P55 chipset, as this architecture diagram shows: 
If this diagram looks familiar, it's probably because it's pretty much identical to all the P55 architecture diagrams you saw when the P55 chipset was introduced last year. In fact, there seem to be only three differences between the P55 and P67 chipsets:
That's it as far as the functional changes go. For enthusiasts, the most significant feature is that the chipset PCIe lanes are now full 2.0 lanes with 5 Gb/s bandwidth instead of the older 1.0 lanes which were limited to 2.5Gb/s. Since PCIe lanes are used to support other subsystems than just the graphics card slots (USB 3.0 and SATA 6Gb/s, for example), having more, faster lanes is always better, especially if you plan to run other PCIe cards like RAID or sound cards (see our review of the ASUS P7H55D-M EVO motherboard for the difference PCIe 2.0 lanes can make in USB 3.0 performance). Combined with the 16 PCIe lanes on a Sandy Bridge processor, a Cougar Point-based system has a total of 24 PCIe lanes, which is far short of the 40 provided by an X58 system or the 42 on an AMD 890FX system. Enthusiasts should think carefully about their current and future system configurations and determine if the available PCIe lanes on a P67 system will be sufficient. The P67 Express chipset is one of four total desktop Cougar Point chipsets, the other three being the Q67, B65, and H67. The main difference between the P67 and the other desktop chipsets is that the others support the integrated video feature of Sandy Bridge CPUs, and add associated features such as content protection and on-chip 3D support. According to Intel, the P67 Express chipset is the only one that support processor core overclocking, so it's definitely the one you'll want to get. Intel's Sandy Bridge processor architecture replaces the aging Nehalem series introduced back on 3 November 2008 for the X58-Express platform, and extended to the P55 platform some months later. Housing a new LGA1155 socket, Intel P67-series motherboards are compatible with the following Sandy Bridge processors:
Fortunately, Intel did not change the CPU cooler mounting holes for the new Socket 1155; existing 1156 coolers will work fine. DP67BG Features
Intel P67 Motherboard Specifications
Enough of the specs. Let's take a look at this board. Closer Look: Intel DP67BGThe DP67BG motherboard, code-named "Burrage", is a standard ATX-sized motherboard with a conventional layout. Our review sample was received without its retail packaging, documentation, or accessory bundle (which according to Intel should include a back plate, UV SATA cables, board and back panel layout stickers, a Bluetooth/WiFi module, an NVIDIA SLI connector, documentation, and a driver CD), so I was limited to Intel's technically-brief press materials and what I could determine myself.
I was impressed by the slot layout of the board, a place where many other boards fall down. You can use two double-width video cards and still have one PCI slot and two PCIe x1 slots available. If you have only one graphics card, it'll get the full x16 bandwidth; if you use two cards, each will get x8. The small heatsinks on the power circuitry around the LGA1155 socket mean you won't have a problem with large CPU coolers, although large coolers may impinge on the first RAM slot. Thankfully, the CPU cooler mounting holes for Socket 1155 are the same as those for Socket 1156.
The battery is located conveniently near the front of the board. Separate power and reset buttons cater to those who run the board in an open chassis, and the integrated beeper and POST code display are directly above the buttons. The front fan header is one of four on the board, all molded in bright red plastic and PWM-capable, so you can adjust your fan speeds in the BIOS. 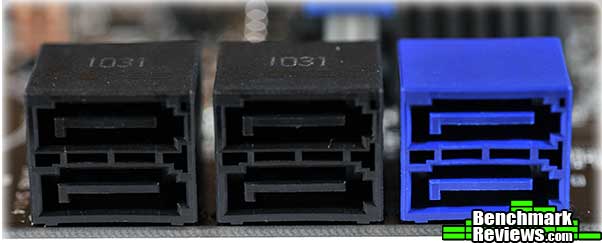
Six latching SATA ports, two of which are blue SATA 6Gb/s ports, are located at the front edge of the board. This should be an adequate number although competing boards typically have seven or eight SATA ports.
At the lower left of the board, near the SATA ports, is a silk-screened skull. Its LED eyes flash red with drive activity, and the area behind the skull on the back side of the motherboard sports blue LEDs for a backlighting effect, which you can see glowing from the edge of the motherboard in this image. Both of these features can be disabled in the BIOS. Just to the right of the skull are two white headers for the transmit and receive connectors for the Consumer Infrared (CIR) system.
While the Intel DP67BG motherboard cooling system doesn't use the elaborate heat-pipe solutions seen in other motherboards, the P67 chipset does have its own finned aluminum heat sink. A blue LED glows from the edges of this heat sink when the board is powered on. Intel Burrage Detailed FeaturesThe edge of the Intel DP67BG motherboard contains a standard assortment of headers. 
From right to left, there are three USB 2.0 headers, the IEEE 1394 FireWire header (in blue), the multicolored front panel connector, a red PWM fan connector, and, above it, a yellow S/PDIF audio connector. 
There's an interesting new feature between the red fan connector and the front panel connector: these LEDs light up in sequence, from right to left, as the board's various subsystems are initialized during the POST. This is a really handy feature if you're having trouble, since you can see exactly how far the POST got before something went wrong. 
The rear I/O panel includes (from left to right) a red e-SATA connector, two USB 2.0 ports and a FireWire port, the "Back to BIOS" push button, four more USB 2.0 ports, two USB 2.0 ports and the Ethernet port, two blue SuperSpeed USB 3.0 ports, and the audio ports. The "Back to BIOS" button is quite handy: similar buttons on other motherboards allow you to recover from a failed overclock by resetting your BIOS to its defaults, forcing you to re-enter all your settings. The Intel button reboots the system with the default BIOS settings, but somehow leaves your custom settings unaffected, allowing you to easily take up where you left off. 
The Burrage motherboard uses a number of third-party chips to support its various features. From left to right:
A completely "legacy-free" motherboard, the DP67BG has no floppy port, no PATA/IDE port, and no PS/2 mouse or keyboard ports. Intel P67 Motherboard BIOSThe Intel DP67BG motherboard BIOS isn't one of the fancy graphical BIOS implementations you'll see on other P67 motherboards. It's a pretty standard-appearing, Intel-sourced BIOS that still has some interesting features and gives you a great deal of control over various aspects of the motherboard. The Version 1596 supplied with this board was labeled as a "Beta". 
The main screen gives you a look at the overall status and settings of the board. The 105Mhz "Overridden Host Clock Frequency" you see in this shot wasn't even bootable, sad to say. 
The configuration section is where the "skull settings" are. The "Onboard Devices" section includes status and settings for the SATA ports, as well as the system monitoring section shown below: 
You can examine and set the system temperatures and fan control here. The "Fan Control & Real-Time Monitoring" section allows you to actually set the low and high duty cycles of the PWM fan controllers, and the component temperatures at which various duty cycles activate. You can even control how rapidly the fans will respond to temperature changes (i.e. whether the RPM of the fans will change quickly or slowly). 
The Performance section is where things get interesting. By drilling down into the various sections like Processor Overrides and Memory Overrides, you can exert very fine-grained control over the system. 
The Boot section allows you to define the devices you can boot from, and the order in which the BIOS tries to boot from them. In an age of large, inexpensive USB keys, the ability to preferentially boot a USB device first makes it easy to keep emergency recovery tools, or even a Windows DVD image, on a USB key. The "HyperBoot" feature skips various initialization checks to make boot time faster. Motherboard Testing MethodologyThe Intel "Cougar Point" P67 Express chipset and its Sandy Bridge processors are new on the scene, and eventually will replace the older P55 chipset. However, Intel promises much greater levels of performance from their new platform. For comparison with the Intel DP67BG motherboard, I used an AMD 890FX-based system with an AMD 1100T six-core CPU, an X58-based system with an Intel Core i7-950 processor (whose price is a rough match for the Core i7-2600K CPU used on the P67 systems), and two additional P67 motherboards from ASUS, the P8P67 and P8P67 EVO. Intel released a new BIOS for the DP67BG motherboard as I was partway through testing, but despite numerous attemps I was unable to flash the board to the new BIOS— the Windows-based update utility would report "Success" every time without actually updating the BIOS, and attempting to use the flash utility in the existing BIOS merely rebooted the motherboard, then shut it down after a few seconds. I was fortunate enough to have the fastest Sandy Bridge processor, the 3.4GHz, fully unlocked, Core i7-2600K, for use in the P67 motherboards. For each P67 motherboard, I tested at both stock settings as well as the highest overclock I could achieve. Overclocking a Cougar Point/Sandy Bridge system is different from what you're used to, as I'll detail in the "Overclocking" section after the test results. I tried for the maximum overclock I could achieve with all four processor cores running under load; the results for each P67 motherboard are summarized in this chart.
The labelling of the results in the charts may be slightly confusing: the first two columns are the 890FX/AMD 1100T and the X58/Intel Core i7-950 platforms; the next six columns are all the Intel Core i7-2600K processor, at stock and overclocked speeds in the Intel DP67BG, ASUS P8P67, and ASUS P8P67 EVO motherboards, respectively. Intel P67 Test Platforms
Intel X58 Test Platform
AMD 890FX Test Platform
Benchmark Applications
AIDA64 Extreme Edition TestsAIDA64 Extreme Edition is the evolution of Lavalys' "Everest Ultimate Edition". Hungarian developer FinalWire acquired the rights to Everest in late November 2010, and renamed the product "AIDA64". The Everest product was discontinued and FinalWire is offering 1-year license keys to those with active Everest keys. AIDA64 is a full 64-bit benchmark and test suite utilizing MMX, 3DNow! and SSE instruction set extensions, and will scale up to 32 processor cores. An enhanced 64-bit System Stability Test module is also available to stress the whole system to its limits. For legacy processors all benchmarks and the System Stability Test are available in 32-bit versions as well. Additionally, AIDA64 adds new hardware to its database, including 300 solid-state drives. On top of the usual ATA auto-detect information the new SSD database enables AIDA64 to display flash memory type, controller model, physical dimensions, and data transfer performance data. AIDA64 v1.00 also implements SSD-specific SMART disk health information for Indilinx, Intel, JMicron, Samsung, and SandForce controllers. All of the benchmarks used in this test— Queen, Photoworxx, ZLib, hash, and AES— rely on basic x86 instructions, and consume very little system memory while also being aware of Hyper-Threading, multi-processors, and multi-core processors. Of all the tests in this review, AIDA64 is the one that best isolates the processor's performance from the rest of the system. While this is useful in that it more directly compares processor performance, readers should remember that virtually no "real world" programs will mirror these results. 
The Queen and Photoworxx tests are synthetic benchmarks that iterate the function many times and over-exaggerate what the real-world performance would be like. The Queen benchmark focuses on the branch prediction capabilities and misprediction penalties of the CPU. It does this by finding possible solutions to the classic queen problem on a chessboard. At the same clock speed theoretically the processor with the shorter pipeline and smaller misprediction penalties will attain higher benchmark scores. Despite its comparable clock speed and two extra cores, the AMD 1100T falls well behind the Intel processors in the Queen test. Even the slower-clocked Core i7-950 beats it, and the Core i7-2600K, especially when overclocked, dominates the results. Here we see a pattern that will be similar throughout all these tests: at stock clock speeds, the Intel DP67BG motherboard and the two ASUS motherboards return virtually identical performances, while the higher overclocks the ASUS boards can reach provide greater performance than the relatively limited overclock the DP67BG was capable of. Like the Queen benchmark, the Photoworxx tests for penalties against pipeline architecture. The synthetic Photoworxx benchmark stresses the integer arithmetic and multiplication execution units of the CPU and also the memory subsystem. Due to the fact that this test performs high memory read/write traffic, it cannot effectively scale in situations where more than two processing threads are used, so quad-core processors with Hyper-Threading have no real advantage. The AIDIA64 Photoworxx benchmark performs the following tasks on a very large RGB image:
The Photoworxx test rankings are identical to the Queen test rankings, but the AMD 1100T drops even further behind the Intel results, which are clustered together with only a 16% difference separating the Core i7-950 from the overclocked 2600K. The overclocked 2600K results are much closer to the stock-clocked results than was the case with the Queen test. 
The Zip Library test measures combined CPU and memory subsystem performance through the public ZLib compression library. ZLib is designed as a free lossless data compression library for use on virtually any computer hardware and operating system. The ZLib data format is itself portable across platforms and has a data-independent footprint that can be reduced at some cost in compression. The AES integer benchmark measures CPU performance using AES data encryption. It utilizes Vincent Rijmen, Antoon Bosselaers and Paulo Barreto's public domain C code in ECB mode and consumes 48 MB of memory. Both of these tests are much more applicable to the "real world" than the previous tests. In the ZLib test, the AMD 1100T surges ahead of the Intel 950, posting scores less than 10% slower than the stock-clocked 2600K. Overclocking the 2600K on the top-performing ASUS P8P67 EVO motherboard improves its score by over 36%. The AES test isn't really a fair one: the Advanced Encryption Standard New Instructions (AES-NI) feature in the latest Intel processors dramatically accelerate AES code. Although the AMD 1100T returns a better score than the Intel 950, the stock-clocked Core i7-2600K is still 560% better. Oddly, overclocking the 2600K doesn't yield significantly better results in the AES test. 
Finally, a win for the 1100T. As we've seen in our review of the AMD 1100T Black Edition, AMD processors dominate in this particular benchmark. PCMark Vantage TestsPCMark Vantage is an objective hardware performance benchmark tool for PCs running 32- and 64-bit versions of Microsoft Windows Vista or Windows 7. It's well suited for benchmarking any type of Microsoft Windows Vista/7 PC: from multimedia home entertainment systems and laptops, to dedicated workstations and high-end gaming rigs. Benchmark Reviews has decided to use a few select tests from the suite to simulate real-world processor usage in this article. Our tests were conducted on 64-bit Windows 7, with results displayed in the chart below. TV and Movies Suite
Gaming Suite*
Music Suite
* EDITOR'S NOTE: Hopefully our readers will carefully consider how relevant PCMark Vantage is as a "real-world" benchmark, since many of the tests rely on unrelated hardware components. For example, per the FutureMark PCMark Vantage White Paper document, Gaming test #2 weighs the storage device for 100% of the test score. In fact, according to PCMark Vantage the video card only impacts 23% of the total gaming score, but the CPU represents 37% of the final score. As our tests in this article (and many others) have already proven, gaming performance has a lot more to do with the GPU than the CPU, and especially more than the hard drive or SSD (which is worth 38% of the final gaming performance score). 
The TV and Movies suite concentrates on video playback and transcoding, but only uses two threads at a maximum, so the Intel processor's Hyper-Threading and AMD 1100T's six cores shouldn't be an advantage. Still, the Intel processors are all faster than the 1100T, and the results seem to scale almost directly with clock speed, with the Sandy Bridge architecture providing little advantage. The Gaming benchmark relies on the hard disk and video card for over 50% of its score (see the Editor's Note above), and we're using the same HDD and video card for all platforms, so the Intel processor's decisive win in this test simply means that Vantage's gaming code is more optimized for Intel processors. Bear in mind, however, that most "real world" games will not show this difference; generally, in games, your video card matters most, followed by the clock speed (not number of cores) of your processor. The PCMark Vantage gaming test can use up to 16 threads, so Hyper-Threading gives the Intel CPUs a real advantage, but very few commercial games will take full advantage of multicore processors. Unlike the Gaming test, the Music test results have more real-world relevance, since multi-threading is much more common in music transcoding applications than it is in games. What's strange here is the exceptional performance of the Nehalem-based Core i7-950 proc, which beats the 2600K's stock results and comes close to its overclocked results. This is something you should be aware of: when Intel (or AMD) change a processor's instructions or architecture, it's not a given that existing code will take full, or any, advantage of it. This is the only benchmark I ran in which the Intel DP67BG motherboard with the stock-clocked 2500K CPU performed noticeably worse than the ASUS boards at stock clock speeds. Futuremark's weighing of the various system components in each test is the subject of some debate; and some of their choices (such as the Gaming test's use of a 1024x768 resolution with no anti-aliasing or texture filtering being "representative" of the "consumer experience") seem odd to me, but the TV and Movies and Music benchmarks are arguably reasonable predictors of overall system performance. CINEBENCH R11.5 BenchmarksMaxon CINEBENCH is a real-world test suite that assesses the computer's performance capabilities. CINEBENCH is based on Maxon's award-winning animation software, Cinema 4D, which is used extensively by studios and production houses worldwide for 3D content creation. Maxon software has been used in blockbuster movies such as Spider-Man, Star Wars, The Chronicles of Narnia, and many more. CINEBENCH Release 11.5 includes the ability to more accurately test the industry's latest hardware, including systems with up to 64 processor threads, and the testing environment better reflects the expectations of today's production demands. A more streamlined interface makes testing systems and reading results incredibly straightforward. The CINEBENCH R11.5 test scenario comprises three tests: an OpenGL-based test that models a simple car chase, and single-core and multi-core versions of a CPU-bound computation using all of a system's processing power to render a photo-realistic 3D scene, "No Keyframes", the viral animation by AixSponza. This scene makes use of various algorithms to stress all available processor cores, and all the rendering is performed by the CPU: the graphics card is not involved except as a display device. The multi-core version of the rendering benchmark uses as many cores as the processor has, including the "virtual cores" in processors that support Hyper-Threading. The resulting "CineMark" is a dimensionless number only useful for comparisons with results generated from the same version of CINEBENCH. First, let's look at the OpenGL results.
Although this test relies on the graphics card and its OpenGL driver, we still see the top-clocked ASUS P8P67 EVO/2600K combination returning 44% more frames per second than the bottom-scoring Core i7-950. It's a reminder that while your graphics card matters the most in games and tests like this, the processor still contributes a lot. 
The single-core rendering test results might seem very close, but that's an artifact of the scaling in this chart: the stock-clocked Intel Core i7-2600K is 33% faster than the Core i7-950, and that's a substantial difference any way you look at it. The difference (at stock clock speeds) drops to 24% with the multi-core rendering test, and the AMD 1100T's performance here is very impressive given that it can only render six tiles at once, rather than the 8 tiles the Hyper-Threaded Intel processors can manage. Remember: the "virtual cores" provided by Hyper-Threading are not the same as "real cores". CPU-Dependent 3D GamingBenchmark Reviews continually evaluates the various tests and benchmarks we use, and we have switched from Ubisoft's Far Cry 2 benchmark to CAPCOM's Street Fighter IV benchmark. Street Fighter IV uses a new, built-from-scratch graphics engine that enables CAPCOM to tune the visuals and performance to fit the needs of the game and run well on lower-end hardware. Although the engine is based on DX9 capabilities, it does add soft shadows, High Dynamic Range lighting, depth of field effects, and motion blur to enhance the game experience. The game is multi-threaded, with rendering, audio, and file I/O all running in different threads. The development team has also worked to maintain a relatively constant CPU load in all parts of the game so that on-screen performance does not change dramatically in different game scenarios.
I ran the Street Fighter IV benchmark at low-resolution, low settings as well as high-resolution, high settings. Low-resolution settings were 1024x768, no AA, with all other settings set to minimum; high resolution tests were run at 1920x1200 with 8xAA and all other settings maxed out. Low-resolution gaming tests make the video card less of a factor since any high-end video card like the NVIDIA GTX280 used in these tests can easily handle them; differences here are more biased towards processor horsepower. The AMD 1100T brings up the rear here, but the real surprise is that the 3.06Ghz, last-generation Core i7-950 performs identically with the spiffy new 3.4Ghz Core i7-2600K. Again, the latest new processor doesn't necessarily mean better performance. In the high-resolution tests, as expected, the results are all similar, since the performance of the graphics card becomes the primary factor. Still, the AMD 1100T beats the i7-950 and stock-clocked 2600K by about 7.5%. PassMark PerformanceTest 7.0The PassMark PerformanceTest allows you to objectively benchmark a PC using a variety of different speed tests and compare the results to other computers. PassMark comprises a complete suite of tests for your computer, including CPU tests, 2D and 3D graphics tests, disk tests, memory tests, and even tests to determine the speed of your system's optical drive. PassMark tests support Hyper-Threading and systems with multiple CPUs, and allow you to save benchmark results to disk (or to export them to HTML, text, GIF, and BMP formats). Knowledgeable users can use the Advanced Testing section to alter the parameters for the disk, network, graphics, multitasking, and memory tests, and created individual, customized testing suites. But for this review I used only the built-in CPU tests, which aren't configurable. PassMark computes a "CPU Marks" score based on the scores of the individual tests:
The Cougar Point/Sandy Bridge systems show a dramatic advantage over the older 890FX/X58 systems, with scores at least 40% higher. But this score is a composite of the scores returned by the other, individual tests...let's take a look at them.
Integer and floating point operations are the basic things modern CPUs do. Integer operations are everything except floating point; technically, even instructions like comparisons, branches, and bit rotates are integer instructions. Floating point instructions deal specifically with floating point math operations. For example, an integer division of 2 into 7 will return "3" as the result, whereas a floating point division of 2 into 7 will return "3.5" as the result. While most program code is comprised of integer instructions, floating point instructions are important in modelling and rendering applications Intel CPUs utterly dominate in the integer tests, with even the mid-range Core i7-950 beating the high-end AMD 1100T by more than 140%. On the floating point side of things, though, the order reverses, with the AMD processor beating even the overclocked Core i7-2600K. The excellent floating point results of the AMD CPUs help explain how AMD processors keep up in the rendering benchmarks. 
The Compress and String Sort benchmarks are both integer-based, and thus the Intel CPUs dominate here. Overclocking the 2600K provides more of a boost with compression than sorting, apparently. 
The AMD 1100T wins (barely) against stock-clocked Intel CPUs in the Encryption test, beating the 950 and matching the 2600K. This benchmark also responds particularly well to the overclocked 2600K, with almost 40% better performance at the highest level. Intel jumps back into the lead in the Physics test, though, with the 1100T falling behind every Intel processor. 
The Primes test shows all the processors clustering together at their stock clock speeds, with the 2600K showing about an 8% advantage, but this is another test where overclocking the 2600K yields dramatic results, with more than a 30% improvement in the scores. The P67 systems surge ahead in the matrix multiplication tests, with the stock-clocked Sandy Bridge CPUs more than twice as fast as the 950, and more than three times as fast when overclocked. Handbrake Media EncodingIt's a truism that consumer-level computer performance reached the "fast enough" point years ago, where increases in system performance don't make thing any faster for most people. Web browsing, e-mail, word processing, and even most games won't benefit dramatically from a super-fast CPU. There are some exceptions, though, and media encoding is one of them: transcoding video, especially high-definition video, can bring the strongest system to its knees. Fortunately, media transcoding is one of those things that (depending on the design of the code, of course) that scales really well with both clock speed and the number of cores, so the more you have of both, the better your results will be. The free and open-source Handbrake 0.94 video transcoder is an example of a program that makes full use of the computational resources available. For this test I used Handbrake 0.94 to transcode a standard-definition episode of Family Guy to the "iPhone & iPod Touch" presets, and recorded the total time (in seconds) it took to transcode the video.
As the only six-core CPU in the test, the AMD 1100T tries its best, but it can only beat the four-core i7-950 by about 7%, and is badly spanked by the Cougar Point/Sandy Bridge systems. Intel identified video transcoding as one of the prime targets for performance improvements with the Sandy Bridge processors, and although this version of Handbrake does not make use of the Intel Quick Sync Video Technology implemented in these CPUs, it's telling that the four-core 2600K matches the six-core i7-980X, which, although not shown in this chart, required 132 seconds to encode the same video. Upcoming encoders that do use this feature will show even greater performance. x264 HD Benchmark 3.19Tech ARP's x264 HD Benchmark comprises the Avisynth video scripting engine, an x264 encoder, a sample 720P video file, and a script file that actually runs the benchmark. The script invokes four two-pass encoding runs and reports the average frames per second encoded as a result. The script file is a simple batch file, so you could edit the encoding parameters if you were interested, although your results wouldn't then be comparable to others.
Again, the 2600K dominates, turning in 980X-matching performances (the 980X returned 89.6 and 89 frames per second on these two runs) for about a third the price. Overclocking the Sandy Bridge CPU returns performance increases that scale almost linearly with the increase in clock speed. 
Although the frames-per-second numbers are different, the results of runs 3 and 4 are virtually identical to the results of runs 1 and 2, when considered on a processor-to-processor comparison basis. There's no doubt about it: the Intel Core i7-2600K processor is a video transcoding monster. SPECviewperf 11 testsThe Standard Performance Evaluation Corporation is "...a non-profit corporation formed to establish, maintain and endorse a standardized set of relevant benchmarks that can be applied to the newest generation of high-performance computers." Their free SPECviewperf benchmark incorporates code and tests contributed by several other companies and is designed to stress computers in a reproducible way. SPECviewperf 11 was released in June 2010 and incorporates an expanded range of capabilities and tests. Note that results from previous versions of SPECviewperf cannot be compared with results from the latest version, as even benchmarks with the same name have been updated with new code and models. SPECviewperf comprises test code from several vendors of professional graphics modelling, rendering, and visualization software. Most of the tests emphasize the CPU over the graphics card, and have between 5 and 13 sub-sections. For this review I ran the Lightwave, Maya, and Seimens Teamcenter Visualization tests. Results are reported as abstract scores, with higher being better. LightwaveThe lightwave-01 viewset was created from traces of the graphics workloads generated by the SPECapc for Lightwave 9.6 benchmark. The models for this viewset range in size from 2.5 to 6 million vertices, with heavy use of vertex buffer objects (VBOs) mixed with immediate mode. GLSL shaders are used throughout the tests. Applications represented by the viewset include 3D character animation, architectural review, and industrial design. MayaThe maya-03 viewset was created from traces of the graphics workload generated by the SPECapc for Maya 2009 benchmark. The models used in the tests range in size from 6 to 66 million vertices, and are tested with and without vertex and fragment shaders. State changes such as those executed by the application— including matrix, material, light and line-stipple changes— are included throughout the rendering of the models. All state changes are derived from a trace of the running application. Siemens Teamcenter Visualization MockupThe tcvis-02 viewset is based on traces of the Siemens Teamcenter Visualization Mockup application (also known as VisMockup) used for visual simulation. Models range from 10 to 22 million vertices and incorporate vertex arrays and fixed-function lighting. State changes such as those executed by the application— including matrix, material, light and line-stipple changes— are included throughout the rendering of the model. All state changes are derived from a trace of the running application.
The SPECviewperf suite is a good example of a real-world test of applications that would normally be the province of a high-end workstation: the individual tests comprise code and models from real applications, running scripts that do real work. The Intel CPUs dominate the Lightwave and TCVIS tests, but it's the Maya test that's the real surprise: in previous testing, AMD processors have done better than Intel processors in the Maya test, with the AMD 1100T beating even the Core i7-980X Extreme Edition CPU, and we can see echoes of that here with the i7-950's lower score compared to the 1100T. But the P67/Sandy Bridge systems are much faster than anything else. This is another example where the 2600K scores are better than the 980x scores...in fact, they're about twice the score of the 980X in this same test. SPECapc LightwaveSPECapc (Application Performance Characterization) tests are fundamentally different from the SPECviewperf tests. While SPECviewperf tests incorporate code from the various test programs directly into the benchmark, the SPECapc tests are separate scripts and datasets that are run against a stand-alone installation of the program being benchmarked. SPECapc group members sponsor applications and work with end-users, user groups, publications and ISVs to select and refine workloads, which consist of data sets and benchmark script files. Workloads are determined by end-users and ISVs, not SPECapc group members. These workloads will evolve over time in conjunction with end-users' needs and the increasing functionality of PCs and workstations. For this test, I ran the SPECapc "Lightwave" benchmark against a trial installation of Newtek's Lightwave 3D product. The benchmark, developed in cooperation with NewTek, provides realistic workloads that simulate a typical LightWave 3D workflow. It contains 11 datasets ranging from 64,000 to 1.75 million polygons and representing such applications as 3D character animation, architectural review, and industrial design. Scores for individual workloads are composited under three categories: interactive, render and multitask. The benchmark puts special emphasis on processes that benefit from multi-threaded computing, such as animation, OpenGL playback, deformations, and high-end rendering that includes ray tracing, radiosity, complex textures and volumetric lighting. The test reports three scores: Animation (multitasking), Animation (interactive), and Rendering. The numeric scores represent the time it took to complete each section of the benchmark, in seconds, so lower scores are better. I've found the SPECapc Lightwave 3D test to be an excellent indicator of overclock stability. In many cases, overclocked systems that will make it through every other benchmark here will crash in this test. 
Although this test stresses system components other than the processor (the video card's OpenGL implementation, for example), it still shows obvious performance differences in the CPUs. The AMD 1100T ekes out a couple of very narrow victories over the Core i7-950 in two of the three tests, but it can't compete with the 2600K. In the Animation (Multitasking) section, we see a very nice performance scaling with frequency for the Intel processors, with results following clock speed almost perfectly. This pattern is repeated in the Animation (Interactive) and Rendering sections, although the differences are less notable. The 1100T's relatively poor showing here prove that six physical cores don't always beat four physical cores. OverclockingThe Intel P67 Express chipset brings major changes to the overclocking process. Here are the bullet points:
Overclocking by raising the motherboard's base clock is now all but impossible. Of the three P67-based motherboards I tried to overclock, the highest increase to the 100MHz base clock that I could get to run through stress testing was...103MHz. The Intel DP67BG motherboard wasn't stable above 102MHz, and couldn't run above 101MHz in stress testing. This limited overclocking ability is apparently because the P67's base clock is used to derive almost every other clock in the system, including the SATA and USB clocks. While having a single clock be the base for every other clock in the system probably means cheaper, more reliable motherboards, it removes an overclocking mechanism enthusiasts have used for many years. Intel compensates for this by giving all Sandy Bridge processors unlocked multipliers: K-series processors get "fully unlocked" multipliers with no limits, while non-K series processors are "limited unlocked" CPUs that can only have their multipliers increased by a maximum of 4. All Sandy Bridge processors have fully unlocked video cores, RAM multipliers, and power settings. 
Overclocking Sandy Bridge CPUs is different in another way, too. While everyone has their own overclocking techniques, I generally like to disable "turbo" features and run all processor cores as fast as I can under stress by raising the base multiplier. Well, you can't do this with the Intel Core i7-2600K: in fact, you can't increase the base multiplier at all! This was true in both the Intel DP67BG motherboard and ASUS motherboards I used, so I suspect this limitation is built into either the processor or the P67 chipset. Your only option is to increase the multiplier that will be used by Turbo Boost, and you can set individual multipliers to be used when 1, 2, 3, or all 4 cores are in use. Thus, if you disable Turbo Boost technology, you can't overclock the processor at all. 
This image shows the "Performance" tab of the Intel DP67BG BIOS. The "Maximum Non-Turbo Ratio" setting cannot be increased beyond the default of "34" (although it can be reduced); your only overclocking options are the multipliers used for the cores in Turbo Boost mode. One interesting thing here is that although the CPU's nominal TDP is 95 watts, it can use up to 120 watts for a "burst mode" of up to one second. This screen also allows you to up the processor voltage and disable V-droop, both of which I did for my overclocking experiments. With the Intel DP67BG motherboard, the best I was able to achieve was a base clock of 101Mhz with a four-core multiplier of 41, for a sustained 4.13GHz with all cores under load. Despite playing with higher voltages and the V-droop setting, increasing either the base clock or CPU multiplier by one would lead to crashes in stress testing. This low overclock is disappointing (the ASUS boards did much better), and probably due to the relatively immature BIOS. With further experimentation I probably could have tweaked the multipliers a little higher when fewer cores were running.
I did try Intel's Extreme Tuning Utility (XTU), which is supposed to provide an auto-tuning button on P67 platforms, but the version supplied did not display this button with this motherboard. XTU is very comprehensive, providing at least the level of detail that AMD's "Overdrive" does (and much more than ASUS' "Turbo V Evo" utility), but is apparently unable to apply any changes without forcing a reboot, so I found it more convenient to change settings in the BIOS. Intel provides a Turbo Monitor utility to graphically display the state of the processor's multipliers. 
The left image shows the processor in an idle, low-power state (as noted by the green leaf with the "Energy Saver" label). The right image shows the processor running in Turbo Boost mode, with the top of the dark blue area of the bar representing the stock 3.4Ghz frequency, and the lighter blue bar representing the Turbo Boost frequency. This is a fun utility but it would have been more interesting to show individual bars for each core. DP67BG Burrage Final ThoughtsI think of the P67 chipset as "P55 Plus". It's the top of the range of Intel's Cougar Point line, which comprises five mobile and four desktop chipsets. It adds significant new features such as native SATA 6Gb/s, support for automated performance tuning (when XTU catches up, anyway), and official support for DDR3-1600 memory. But there are some downsides, too: although the 8 PCIe lanes provided by the chipset (the Sandy Bridge processors supply 16 PCIe lanes) are now version 2.0, supporting 5GT/s bandwidth as opposed to the P55's 8 lanes of 2.5GT/s bandwidth, there are still only 24 PCIe lanes total on a P67 system, which pales in comparison to the 40 lanes available on an X58 system and the 42 lanes available on an AMD 890FX system. The DP67BG has the advantage of supporting NVIDIA SLI, which the AMD chipset does not, but not all P67 Express motherboards support it: for example, the ASUS P8P67 motherboard doesn't support SLI, while the ASUS P8P67 EVO does, so you should check your motherboard specifications carefully if you plan to run a P67/NVIDIA SLI system. But if you're a CrossFireX afficionado, the AMD system lets you run tri-CrossFireX, and even with three video cards, you don't have to worry about "stealing" PCIe lanes from your SATA 6Gb/s or SuperSpeed USB 3.0 ports. I suspect this PCIe limitation was a marketing decision: given the performance of a P67/2600K system, adding more PCIe lanes would make X58 systems almost irrelevant. Of course I expect to see high-end P67 systems adding more lanes with NVIDIA NF200 chips as we've seen in the P55 world. Another point is Intel's decision to make the chipset base clock the reference for almost every clock on the system, which removes base clock frequency increases as an overclocking mechanism. Although any Sandy Bridge chip can increase its multiplier by 4 bins (when used with a P67 Express chipset), this still leaves a lot of potential performance on the table: the non-K Core i7-2600 will be limited to a maximum multiplier of 38, significantly below the 41 I achieved with the Intel board and the 46 I reached with the ASUS motherboards. And if you choose a motherboard based on a desktop Cougar Point chipset other than the P67 Express, you won't be able to overclock the CPU cores at all, since Intel's press materials note that "P67 Express chipset required for core overclocking." 
If the P67 Express chipset is somewhat disappointing, the Intel DP67BG Desktop Board is nonetheless a credible effort to build a high-end motherboard around it. With features like 4 PWM-controllable fan headers, power and reset buttons, a POST code display and init-sequence LEDs, and even the whimsical lighted skull logo, it seems Intel is serious about addressing the P67 Express enthusiast market. I found the overclocking abilities disappointing, but I expect this is mostly the result of a very early BIOS and production boards should be a lot better (especially given that Intel's press kit makes a point of emphasizing the overclocking and auto-tuning abilities of the P67 in combination with an unlocked processor and the Intel Extreme Tuning utility). Intel DP67BG ConclusionAlthough we strive to be as objective as possible, any review will reflect to some extent the perceptions and biases of the reviewer. Also, keep in mind that the computer market is very volatile, and that today's killer super product can easily become yesterday's also-ran as the market competition changes. Don't base a purchase decision solely on this review, but use it as part of your research. Since Benchmark Reviews did not receive the full retail package of the Intel DP67BG motherboard, nor do we know the suggested retail price, we can't rate the board's value. However, we can report on the other aspects of the board. The physical quality of the board is excellent. There are none of the small indications of rushed production like misaligned solder masks or components. Little touches like labelling the front panel connectors and making all the fan connectors red so you can easily find them indicates someone at Intel put some thought into this board. I was especially impressed by the board's layout, and Intel's decision to eschew of legacy ports like floppy and IDE, which opens up board space for both innovations (like the sequential-LED POST status display) and fun features like the flashing-eyed skull. The slot layout is excellent, maximizing the potential of the board when equipped with two double-wide video cards. Functionally, the Intel DP67BG has the features one expects of an enthusiast-level board: on-board power and reset switches; a POST code display, all-PWM fans, the "Back to BIOS" button for recovering from failed overclocks, and the robust power supply cicuitry needed to support stable overclocks...BIOS permitting. With an updated BIOS, the Intel DP67BG motherboard would make an excellent basis for an enthusiast-level P67 system...especially with a windowed case so you can see the skull. Pros:
+ Excellent slot layout Cons:
- Immature BIOS limits overclocking Questions? Comments? Benchmark Reviews really wants your feedback. We invite you to leave your remarks in our Discussion Forum.
Related Articles:
|
|||||||||||||||||||||||||||||||||||||||||||||||||||||||||||||||||||||||||||||||||||||||||||||||||||||||||||||
 f
f


Comments
BUT for this one i suggest a tower WITHOUT a side window ; unless you
want to get eye cancer from looking at that thing...
I got mine for 179.99 at micro center with a core i5 2500k overclocked to 4.7 with the corsair h60!
GREAT BOARD!
Fingers crossed
because i has to to purchase cabinate,ram,cpu,gra phics card,harddisk e.t.c i can't wait to complete my computer to assemble i heard that the skull glow i want to purchase two nvidia gtx 570 graphics card to connect sli bridge but my dad gonna kill me for high budget i hope single will work for me i want to mount crosair cpu cooler but my dad shouting on me you know tha matter of money i wish you guys can get
i'm really a game lover that nividia gtx 570 is awsome