| Intel Core i7-3820 Extreme Edition CPU |
| Reviews - Featured Reviews: Processors | |||||||||||||||||||||||||||||||||||||||||||||||||||||||||||||||||||||||||||||||||||||||||||||||||||||||||||||||||||||||||||||||
| Written by Hank Tolman | |||||||||||||||||||||||||||||||||||||||||||||||||||||||||||||||||||||||||||||||||||||||||||||||||||||||||||||||||||||||||||||||
| Tuesday, 06 March 2012 | |||||||||||||||||||||||||||||||||||||||||||||||||||||||||||||||||||||||||||||||||||||||||||||||||||||||||||||||||||||||||||||||
Intel Core i7-3820 Extreme Edition CPU Review
Manufacturer: Intel Corporation Full Disclosure: The product sample used in this article has been provided by Intel. For most people, the Sandy Bridge LGA-1155 carries enough power for everything they need. This includes most gamers and many enthusiasts wanting to overclock and push their systems up as high as they can. Certainly for mainstream users, media users, and light gamers, the Sandy Bridge platform offers more than enough flexibility and features. Even with all that, it seemed like Sandy Bridge was lacking. For many of us, the Sandy Bridge-E LGA-2011 release brought a flood of appealing features that the LGA-1155 platform left out. For extreme gamers and enthusiasts, the number of PCI-E lanes on the Sandy Bridge platform fell short. With the release of the LGA-2011 platform, Intel fixed this. They also added Quad-channel memory support, PCIe 3.0 support, and the option for CPUs with up to six cores. The first two processors released with the new Sandy Bridge-E platform were both 6-core CPUs; the i7-3960X and the i7-3930K. The problem with these CPUs is that they cost a lot. The i73960X released at $999 and i7-3930K released at $555. These were definitely both extreme CPUs for extreme users, but what about those of us who want enough PCIe lanes to use three or four GPUs, quad-channel memory, and a system that will support PCIe 3.0 without having to upgrade again within the year or the need for a $1000 CPU? For us, Intel released the Core i7-3820 Extreme Edition CPU.
The Core i7-3820 is quite a different beast than the other two Sandy Bridge-E CPUs. In fact, it's even built on its own die, smaller than the other Sandy Bridge-E processors, but bigger than the Sandy Bridge CPUs. The first difference, of course, is the 4-cores/8-threads of the i7-3820 compared to the 6-cores/12-threads of the other two CPUs. Next comes the smaller cache. The i7-3960X has a 15MB L3 cache, the i7-3930K has a 12MB L3 cache, and the i7-3820 has the smallest L3 cache at 10MB. That's still larger, however, than the largest LGA-1155 CPU, which has an 8MB L3 cache. The i7-3820 also clocks in a tiny bit faster than the fastest LGA-1155 CPU, the i7-2700K, at 3.6GHz compared to 3.5GHz. Basically, what all that means is that the i7-3820 Extreme Edition CPU should be ever so slightly faster than then top-end Sandy Bridge LGA-1155 CPU. The nice part is that the i7-3820 also costs less than the i7-2700K. Of course, that cost will be offset by the more expensive motherboards. Intel Core i7-3820 FeaturesThe following information is courtesy of Intel
BX80619i73820 SpecificationsThe naming convention for Intel Core processors started with LGA-1366 CPUs and continued through LGA-1156, LGA-1155, and now to LGA-2011 processors. With all those Core iX CPUs, it can be confusing to tell which CPU goes with which platform. LGA-1366 Core i7 CPUs were three-digits in 9XX range. The LGA-1155 platform made the Sandy Bridge Core i7 CPUs 2nd Generation, added a fourth digit, and start with a 2. The LGA-2011 Sandy Bridge Extreme Core i7 CPUs keep the four digits, but start with a 3. The chart below lays out the specs for the three LGA-2011 CPUs and the top-end LGA-1155 CPU, the i7-2700K.
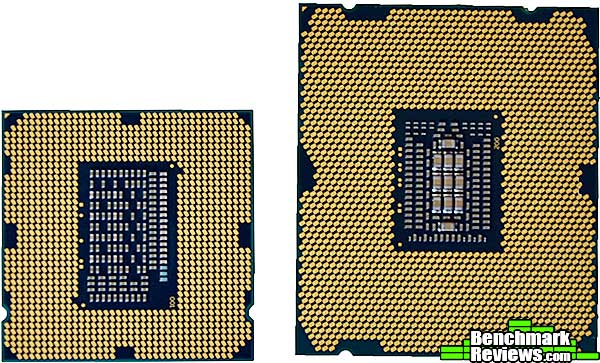
The cache, the cores, and the turbo boost increase, besides the price, are what differentiate the three LGA-2011 platforms. You'll notice that the Core i7-3820 only bumps up 300MHz on the Turbo clock, compared to the 600MHz jump that the other two experience. This is somewhat misleading, however, as those 6-core processors can only boost by 600MHz when less than five cores are at work. To boost all 6 cores, they can only add 300MHz. The Turbo Boost used on LGA-2011 platform is the same Turbo Boost 2.0 technology found on the original Sandy Bridge CPUs. To give you an idea of just how much bigger the LGA-2011 CPUs are compared to the LGA-1155 CPUs, you can take a look at the image below. LGA-1155 quad-cores have a die size of 216mm squared. The i7-3820 die is 294mm squared, but it sits on the same sized CPU as the 6-core LGA-2011 CPUs that have a 435mm squared die. That's almost exactly twice the size of the biggest LGA-1155 CPUs. 
Keep in mind that the i7-3820 does not come with a CPU cooler. You should be able to use your old LGA-1155 cooler. The two X79 motherboards I have both came with hardware to assist in mounting the old coolers. Next up, let's take a look at the Sandy Bridge-E architecture. Sandy Bridge Extreme ArchitectureIn reality, the i7-3820 is very similar in build to the i7-2700K. The cores are nearly identical. The following is a list of the main differences between the two CPUs:
So Sandy Bridge-E does away with the iGPU. What does that mean exactly? Well, not a whole lot for most gamers and enthusiasts. The 3000 series Intel HD Graphics were good enough to play most games, but certainly not as high quality. The only real advantage of the iGPU is Quick Sync. With a Z68 motherboard, you could use your discrete GPU to power games and graphics and still use the Intel HD Graphics to transcode video as insane speeds. I'll give it up, however, for 22 more PCI-E lanes off the CPU. With only 16 lanes on LGA-1155 systems, even only a dual-GPU system lost efficiency. You had to run at two GPUs at x8/x8. With the Sandy Bridge-E platform, you can run both at x16 and even still run a third at x8. In fact, even in a four-GPU setup, your first GPU is still running at full bandwidth. Full bandwidth brings me to another feature of the Sandy Bridge-E architecture. The PCIe lanes are actually PCIe 3.0 lanes rather than PCIe 2.0 lanes. That means that the available bandwidth is technically twice that of each of the lanes on a LGA-1155 system. So speaking from a bandwidth perspective, you are looking at the equivalent of 80 PCIe 2.0 lanes compared to just 16 on the LGA-1155 platform. Of course, we don't have GPUs or other peripherals that are built to PCIe 3.0 standards yet, but even running those last GPUs at x8, the bandwidth capability is equivalent to running at x16 on PCIe 2.0 lanes. 
Above is an image depicting the die layout for the 6-core LGA-2011 CPUs. The i7-3820 obviously only has 4-cores and a smaller cache, but the concept is the same. I just wanted to point out those two areas below the three cores on either side sure look about the same size as a CPU core. This die layout can certainly support another two cores. 
The X79 chipset block diagram above looks very similar to the Z68 diagram, with the differences we have already talked about, of course. Also missing is the Intel Smart Response Technology support. That's unfortunate, since SSD caching has become a much more distinct possibility with falling SSD prices. Fortunately, motherboard manufacturers are starting to implement their own solutions to this dilemma. The USB ports and SATA ports are identical to the Z68 and P67 chipsets. By that I mean no native SuperSpeed USB 3.0 ports and only two SATA 6Gb/s ports. The lack of USB 3.0 is unsurprising, but it looks like we are still going to be kept waiting for the Light Peak (Thunderbolt) Intel alternative, as it's not here on the X79 chipset. That's disappointing, but not too terrible, as I am sure almost every X79 motherboard will come equipped with an alternative controller for USB 3.0 ports. Hopefully they also come with a controller for more SATA 6Gb/s ports, as those devices are becoming commonplace.Processor Testing MethodologyIn this article, I am comparing the Intel Core i7-3820 at stock and overclocked speeds on the ASUS Rampage IV Formula motherboard to a wide variety of systems. I am comparing it to the i7-3960X on the ASUS Sabertooth X79 motherboard, the i7-2600K, its closest competitor in price, on the ASUS P8P67 motherboard, the i5-2500K on the ASUS Sabertooth P67 motherboard, the i7-980X on the ASUS Rampage III Extreme motherboard, and the AMD FX-8150 and AMD Phenom-II X4-980BE on the ASUS Crosshair V Formula motherboard. This should give us a good smattering of different CPUs and platforms to look at.
Intel X58 Express Test Platform
Intel P67 Express Test Platform
AMD 990FX Test Platform
Intel X79 Express Test Platform
Benchmark Applications
SiSoft Sandra Memory BandwidthSiSoftware Sandra (the System ANalyser, Diagnostic and Reporting Assistant) is an information & diagnostic utility. It should provide most of the information (including undocumented) you need to know about your hardware, software and other devices whether hardware or software. It's available in five versions, ranging from the free "Lite" version to the Sandra Enterprise version. Sandra fully supports and exploits multi-processor and multi-core systems, NUMA memory, Hyper-Threading, and MMX, SSE, SSE2, SSE3, SSSE3, SSE 4.1, SSE 4.2, AVX, and FMA instructions. The memory bandwidth test within Sandra's test suite will give us the best idea of how the quad-channel memory system affects memory bandwidth.  The tests show very clearly that the quad-channel memory improves bandwidth speeds. The i7-3820 even outperforms the 980X because of this quad-channel memory support. The improved memory controller on the LGA-1155 CPUs is enough to boost the i7-2600K up over the 980X as well. AIDA64 Extreme Edition TestsAIDA64 is a full 64-bit benchmark and test suite utilizing MMX, 3DNow! and SSE instruction set extensions, and will scale up to 32 processor cores. An enhanced 64-bit System Stability Test module is also available to stress the whole system to its limits. For legacy processors all benchmarks and the System Stability Test are available in 32-bit versions as well. Additionally, AIDA64 adds new hardware to its database, including 300 solid-state drives. On top of the usual ATA auto-detect information the new SSD database enables AIDA64 to display flash memory type, controller model, physical dimensions, and data transfer performance data. AIDA64 v1.00 also implements SSD-specific SMART disk health information for Indilinx, Intel, JMicron, Samsung, and SandForce controllers. All of the benchmarks used in this test— Queen, Photoworxx, ZLib, hash, and AES— rely on basic x86 instructions, and consume very little system memory while also being aware of Hyper-Threading, multi-processors, and multi-core processors. Of all the tests in this review, AIDA64 is the one that best isolates the processor's performance from the rest of the system. While this is useful in that it more directly compares processor performance, readers should remember that virtually no "real world" programs will mirror these results. 
The Queen and Photoworxx tests are synthetic benchmarks that iterate the function many times and over-exaggerate what the real-world performance would be like. The Queen benchmark focuses on the branch prediction capabilities and misprediction penalties of the CPU. It does this by finding possible solutions to the classic queen problem on a chessboard. At the same clock speed theoretically the processor with the shorter pipeline and smaller misprediction penalties will attain higher benchmark scores. Like the Queen benchmark, the Photoworxx tests for penalties against pipeline architecture. The synthetic Photoworxx benchmark stresses the integer arithmetic and multiplication execution units of the CPU and also the memory subsystem. Due to the fact that this test performs high memory read/write traffic, it cannot effectively scale in situations where more than two processing threads are used, so quad-core processors with Hyper-Threading have no real advantage. The AIDIA64 Photoworxx benchmark performs the following tasks on a very large RGB image:
The i7-3820 matches up pretty closely in terms of performance with the i7-2600K. This makes sense, considering the processors are very close in specification. Both of them actually outperform the six-core 980X in the Photoworxx test. 
Again, the i7-3820 winds up performing almost exactly like the i7-2600K, edging it out slightly in the Hash tests. 
Its not even worth putting the Phenom-II X4-980BE on the chart here because of its lack of optimization in terms of AES. The new AMD instructions first appeared with Bulldozer CPUs. The i7-3820 again pushes slightly ahead of its nearest competitor in price and relative architecture, the i7-2600K. Let's move on to the PCMark Vantage benchmark. PCMark Vantage TestsPCMark Vantage is an objective hardware performance benchmark tool for PCs running 32- and 64-bit versions of Microsoft Windows Vista or Windows 7. It's well suited for benchmarking any type of Microsoft Windows Vista/7 PC: from multimedia home entertainment systems and laptops, to dedicated workstations and high-end gaming rigs. Benchmark Reviews has decided to use a few select tests from the suite to simulate real-world processor usage in this article. Our tests were conducted on 64-bit Windows 7, with results displayed in the chart below. TV and Movies Suite
Gaming Suite*
Music Suite
* EDITOR'S NOTE: Hopefully our readers will carefully consider how relevant PCMark Vantage is as a "real-world" benchmark, since many of the tests rely on unrelated hardware components. For example, per the FutureMark PCMark Vantage White Paper document, Gaming test #2 weighs the storage device for 100% of the test score. In fact, according to PCMark Vantage the video card only impacts 23% of the total gaming score, but the CPU represents 37% of the final score. As our tests in this article (and many others) have already proven, gaming performance has a lot more to do with the GPU than the CPU, and especially more than the hard drive or SSD (which is worth 38% of the final gaming performance score). 
The i7-3820 is performing right as we would expect it to considering the specifications. It runs just faster than the i7-2600K. Let's move on to CINEBENCH. CINEBENCH R11.5 BenchmarksMaxon CINEBENCH is a real-world test suite that assesses the computer's performance capabilities. CINEBENCH is based on Maxon's award-winning animation software, Cinema 4D, which is used extensively by studios and production houses worldwide for 3D content creation. Maxon software has been used in blockbuster movies such as Spider-Man, Star Wars, The Chronicles of Narnia, and many more. CINEBENCH Release 11.5 includes the ability to more accurately test the industry's latest hardware, including systems with up to 64 processor threads, and the testing environment better reflects the expectations of today's production demands. A more streamlined interface makes testing systems and reading results incredibly straightforward. The CINEBENCH R11.5 test scenario comprises three tests: an OpenGL-based test that models a simple car chase, and single-core and multi-core versions of a CPU-bound computation using all of a system's processing power to render a photo-realistic 3D scene, "No Keyframes", the viral animation by AixSponza. This scene makes use of various algorithms to stress all available processor cores, and all rendering is performed by the CPU: the graphics card is not involved except as a display device. The multi-core version of the rendering benchmark uses as many cores as the processor has, including the "virtual cores" in processors that support Hyper-Threading. The resulting "CineMark" is a dimensionless number only useful for comparisons with results generated from the same version of CINEBENCH. What a nice, linear set of results! CINEBENCH really uses all the threads it can, and the more threads a CPU can dispatch, the better it's going to do on this test.
In single core rendering, the i7-3820 at 3.6Ghz runs faster than all but the i7-3960X. This is a little strange, considering the i7-3960X runs at 3.3GHz. Perhaps its due to the massive 15MB of L3 cache on the $1k CPU. Multi-core rendering shows no surprises. The i7-3820 is the fasted quad-core on the chart. That's pretty good, considering its price isn't much higher than the i7-2600K. CPU-Dependent 3D GamingBenchmark Reviews continually evaluates the various tests and benchmarks we use, and we have switched from Ubisoft's Far Cry 2 benchmark to CAPCOM's Street Fighter IV benchmark. Street Fighter IV uses a new, built-from-scratch graphics engine that enables CAPCOM to tune the visuals and performance to fit the needs of the game, as well as run well on lower-end hardware. Although the engine is based on DX9 capabilities, it does add soft shadows, High Dynamic Range lighting, depth of field effects, and motion blur to enhance the game experience. The game is multi-threaded, with rendering, audio, and file I/O all running in different threads. The development team has also worked to maintain a relatively constant CPU load in all parts of the game so that on-screen performance does not change dramatically in different game scenarios.
I ran the Street Fighter IV benchmark at its lowest resolution (640x480) will all graphical features turned down to the minimum possible settings. This makes the video card much less of a factor in the results, biasing towards processor performance. The i7-3820, with its faster clock speed and bigger L3 cache gets pretty close to the i7-3960X and beats every other CPU on the chart. PassMark PerformanceTest 7.0The PassMark PerformanceTest allows you to objectively benchmark a PC using a variety of different speed tests and compare the results to other computers. PassMark comprises a complete suite of tests for your computer, including CPU tests, 2D and 3D graphics tests, disk tests, memory tests, and even tests to determine the speed of your system's optical drive. PassMark tests support Hyper-Threading and systems with multiple CPUs, and allow you to save benchmark results to disk (or to export them to HTML, text, GIF, and BMP formats). Knowledgeable users can use the Advanced Testing section to alter the parameters for the disk, network, graphics, multitasking, and memory tests, and created individual, customized testing suites. But for this review I used only the built-in CPU tests, which aren't configurable. The CPU tests comprise a number of different metrics. The first three I'll look at are integer performance, floating point performance, and a benchmark that finds prime numbers.
The key to look at in this chart is the fact that, again, the i7-3820 runs right around the same in performance as the i7-2600K. 
SSE stands for "Streaming SIMD Extensions", and are instructions that handle multiple chuncks of data per instruction (SIMD = Single Instruction Multiple Data). SSE instructions work on single-precision floating point data and are typically used in graphical computations. SSE was Intel's response to AMD's "3D Now", which itself was a response to Intel's MMX instructions. Don't you love competition? AMD's current implementation is actually quite good: notice how it beats the 980X? The i7-3820 falls in line with the i7-2600K.
The Compress and String benchmarks both show the i7-3820 narrowly edging out the slightly slower i7-2600K. Handbrake Media EncodingIt's a truism that consumer-level computer performance reached the "fast enough" point years ago, where increases in system performance don't make thing any faster for most people. Web browsing, e-mail, word processing, and even most games won't benefit dramatically from a super-fast CPU. There are some exceptions, though, and media encoding is one of them: transcoding video, especially high-definition video, can bring the strongest system to its knees. Fortunately, media transcoding is one of those things that (depending on the design of the code, of course) that scales really well with both clock speed and the number of cores, so the more you have of both, the better your results will be. The free and open-source Handbrake 0.95 video transcoder is an example of a program that makes full use of the computational resources available. For this test I used Handbrake 0.95 to transcode a standard-definition episode of Family Guy to the "iPhone & iPod Touch" presets, and recorded the total time (in seconds) it took to transcode the video.
The i7-3820 actually matches the six-core 980X here, performing better than everything else except for the massive 3960X. x264 HD Benchmark 3.19Tech ARP's x264 HD Benchmark comprises the Avisynth video scripting engine, an x264 encoder, a sample 720P video file, and a script file that actually runs the benchmark. The script invokes four two-pass encoding runs and reports the average frames per second encoded as a result. The script file is a simple batch file, so you could edit the encoding parameters if you were interested, although your results wouldn't then be comparable to others.
Interestingly enough, the old Phenom processor actually does very well here. The real story, however, is the i7-3820. Bang for buck, the i7-3820 rocks this transcoding test. 
The story here is similar, but the 980X picks up and takes back the second place spot, upending the i7-3820. SPECviewperf 11 testsThe Standard Performance Evaluation Corporation is "...a non-profit corporation formed to establish, maintain and endorse a standardized set of relevant benchmarks that can be applied to the newest generation of high-performance computers." Their free SPECviewperf benchmark incorporates code and tests contributed by several other companies and is designed to stress computers in a reproducible way. SPECviewperf 11 was released in June 2010 and incorporates an expanded range of capabilities and tests. Note that results from previous versions of SPECviewperf cannot be compared with results from the latest version, as even benchmarks with the same name have been updated with new code and models. SPECviewperf comprises test code from several vendors of professional graphics modeling, rendering, and visualization software. Most of the tests emphasize the CPU over the graphics card, and have between 5 and 13 sub-sections. For this review I ran the Lightwave, Maya, and Seimens Teamcenter Visualization tests. Results are reported as abstract scores, with higher being better. LightwaveThe lightwave-01 viewset was created from traces of the graphics workloads generated by the SPECapc for Lightwave 9.6 benchmark. The models for this viewset range in size from 2.5 to 6 million vertices, with heavy use of vertex buffer objects (VBOs) mixed with immediate mode. GLSL shaders are used throughout the tests. Applications represented by the viewset include 3D character animation, architectural review, and industrial design. MayaThe maya-03 viewset was created from traces of the graphics workload generated by the SPECapc for Maya 2009 benchmark. The models used in the tests range in size from 6 to 66 million vertices, and are tested with and without vertex and fragment shaders. State changes such as those executed by the application- including matrix, material, light and line-stipple changes- are included throughout the rendering of the models. All state changes are derived from a trace of the running application. Siemens Teamcenter Visualization MockupThe tcvis-02 viewset is based on traces of the Siemens Teamcenter Visualization Mockup application (also known as VisMockup) used for visual simulation. Models range from 10 to 22 million vertices and incorporate vertex arrays and fixed-function lighting. State changes such as those executed by the application- including matrix, material, light and line-stipple changes- are included throughout the rendering of the model. All state changes are derived from a trace of the running application.
The SPECviewperf suite is a good example of a real-world test of applications that would normally be the province of a high-end workstation: the individual tests comprise code and models from real applications, running scripts that do real work. This shows an interesting dynamic, with the i7-3820 and the i7-2600K fighting for top spot, with the 3820 winning in two out of three of the tests. SPECapc LightwaveSPECapc (Application Performance Characterization) tests are fundamentally different from the SPECviewperf tests. While SPECviewperf tests incorporate code from the various test programs directly into the benchmark, the SPECapc tests are separate scripts and datasets that are run against a stand-alone installation of the program being benchmarked. SPECapc group members sponsor applications and work with end-users, user groups, publications and ISVs to select and refine workloads, which consist of data sets and benchmark script files. Workloads are determined by end-users and ISVs, not SPECapc group members. These workloads will evolve over time in conjunction with end-users' needs and the increasing functionality of PCs and workstations. For this test, I ran the SPECapc "Lightwave" benchmark against a trial installation of Newtek's Lightwave 3D product. The benchmark, developed in cooperation with NewTek, provides realistic workloads that simulate a typical LightWave 3D workflow. It contains 11 datasets ranging from 64,000 to 1.75 million polygons and representing such applications as 3D character animation, architectural review, and industrial design. Scores for individual workloads are composited under three categories: interactive, render and multitask. The benchmark puts special emphasis on processes that benefit from multi-threaded computing, such as animation, OpenGL playback, deformations, and high-end rendering that includes ray tracing, radiosity, complex textures and volumetric lighting. The test reports three scores: Animation (multitasking), Animation (interactive), and Rendering. The numeric scores represent the time it took to complete each section of the benchmark, in seconds, so lower scores are better. I've found the SPECapc Lightwave 3D test to be an excellent indicator of overclock stability. In many cases, overclocked systems that will make it through every other benchmark here will crash in this test. 
Surprisingly, the i7-3820 does quite poorly in the Multitasking and Rendering tests. BlenderBlender is an open-source, free content creation suite of 3D modeling, rendering, and animation capabilities. Originally released in 2002, it's available in versions for Mac OS X, Windows, Linux, and several Unix distributions. It supports rigid and soft-body objects and can handle the draping and animation of cloth, as well as the rendering and animation of smoke, water, and general particle handling. Our Blender test renders multiple frames of an animation of a rotating chunk of ice, with translucency and reflections. Rendering of this model uses ray-tracing algorithms and the program reports the rendering time for each of the animation's 25 frames. The results are a summation of the rendering times for all frames and the lower the score, the better. 
Blender is limited to a maximum of 8 threads, so it's interesting to see that the Sandy Bridge Extreme CPU still performs better than the standard Sandy Bridge. Perhaps the extra cache helps. POV-RayThe Persistence of Vision ray tracer is a free, open source 3D modeling program that uses ray-tracing algorithms to generate realistic three dimensional images. Ray tracing is very computationally intensive, and the POV-Ray program has a handy built-in benchmark to let you check the performance of your system. AMD wins this round, posting stock-clocked results that are 26% better than Intel, although the FX-8150's lead narrows to a mere percentage point when both processors are overclocked.
Same story with this rendering benchmark, with the i7-3820 coming in just ahead of the i7-2600K. Core i7-3820 OverclockingI have to tell you, without the K or the X moniker at the end of the i7-3820, I was initially very skeptical of its overclocking ability. Sandy Bridge doesn't have the greatest track record in my mind with its ability to easily overclock. For the most part, you are limited to overclocking just the turbo boost. I was pleasantly surprised by what I found, however. To get started, let's get into some background on Sandy Bridge overclocking. It's important to realize that, for the most part, Sandy Bridge CPUs are locked at their base clock speeds. Any Sandy Bridge CPU that supports Turbo Boost is partially unlocked simply due to the fact that they support Turbo Boost. Turbo Boost in itself is an overclock, boosting the base clock up to higher frequencies. All Turbo Boost enabled Sandy Bridge GPUs can be overclocked to run 400MHz higher than their base Turbo Frequencies. K and X series CPUs have a limited unlocked Turbo Boost and fully unlocked memory, power, and graphics capabilities. Obviously, graphics overclocking isn't something that comes into play on the Sandy Bridge-E CPUs.
To explain this further, I'll talk specifically about the Core i5-2500 and i5-2500K processors. The i5-2500 has a base frequency of 3.3GHz and a Turbo Boost Frequency of 3.7GHz with 1 active core, 3.6GHz with 2 active cores, 3.5GHz with 3 active cores, and 3.4GHz with 4 active cores. With the limited unlock capabilities of this CPU, you could boost each of those Turbo frequencies by an additional 400MHz, making the maximum overclock 4.1GHz if only 1 core is active. The i5-2500K is virtually the same, except for the fact that the unlocked K-series CPU has a limited unlocked modifier that lets it go above that 400MHz threshold. It's still limited, however, so that the max overclock you could potentially achieve is 5.7GHz with 1 active core. While the two, higher end Sandy Bridge-E CPUs are both X or K-series CPUs and are thus unlocked, the i7-3820 is not. This makes it potentially more difficult to overclock than the other Extreme Edition CPUs. Since the i7-3820 uses Turbo Boost and has a max Turbo of 3.9GHz, it reasons that you should be able to overclock to 4.3GHz by just using the standard, limited multiplier adjustments available with any Turbo Boost enabled Sandy Bridge CPU. Remember that the 4.3GHz mark would only be for a single active core. With all four cores running, the best you should be able to see is 4.0GHz. Pretty boring stuff for an Extreme Edition CPU, right? Luckily for us, Sandy Bridge-E made some other changes that affect overclocking. While normal Sandy Bridge platforms use a bclk of 100MHz, the Sandy Bridge Extreme can use a bclk of 100MHz, 125MHz, 166MHz, or 250MHz. Just crunching the numbers, if that 4x the bclk ratio is in effect, then with the multiplier at 43, as it was for the single core turbo overclock with the 100MHz bclk, we are looking at a potential overclock of 5.375GHz with a bclk of 125MHz, 7.138GHz at a 166MHz bclk, and 10.75GHz at a 250MHz bclk. Obviously, pushing the bclk to 250MHz, or even 166MHz, is really out of the question. Even using the base clock as the multiplier at 3.6GHz, you're trying for a 5.9GHz overclock with the 166MHz bclk. But 125MHz bclk is right up our alley. Just by pushing the bclk up to 125MHz, you are already looking at a base overclock to 4.5GHz. That's quite respectable, considering that would run on all 4 cores as opposed to the standard max of 4.3GHz on a single active core. To get all I can out of the i7-3820, I'll probably need to change some of the other settings besides just the blck frequency. I used the ASUS Rampage IV Formula motherboard for this overclock. To find out more about the specific settings I tweaked, watch out for my review of that motherboard. I'll tell you just what I did to get to 4.75GHz on the i7-3820.
The X79 chipset brings a separate base clock back into the overclocking world, so this time-honored mechanism is again available. The CPU itself adds a new twist: in addition to increasing the voltage to the chip to support higher speeds, you can now increase the sustained maximum and burst maximum current draw as well.
A nearly 32% increase in base clock speed improved performance on average by 24% during our tests. I'd call that very successful for a locked CPU. I'd bet with a little more tuning we could probably see 5GHz on the i7-3820 without many issues. Remember that each component is different and each individual CPU or motherboard will result in different overclocking speeds and capabilities. Sandy Bridge Extreme Final ThoughtsI have to say that the side by side comparison results of the i7-3820 with the similarly priced but i7-2600K were a little disappointing to me. The individual cores are nearly identical on both processors, although the i7-3820 cores are clocked a little faster than the i7-2600K. Also, while the i7-3820 doesn't have an on-die GPU, it does have a little bigger L3 cache at 10MB rather than 8MB. With a faster clock speed and bigger L3 cache, I would think that the i7-3820 would have outshined the i7-2600K by a larger margin than it did.
That being said, the test beds were close, but not identical. Any number of reasons could have caused the i7-3820 to run as close as it did to the i7-2600K. It still did better than the older CPU in most of the testing, and the two processors are very close in specifications. The real point boils down the usage of the two CPUs. Priced just above the i7-2600K and just below the i7-2700K, the i7-3820 represents the lowest-priced CPU available for the Sandy Bridge Extreme chipset. In the end, if you aren't going to use the other features provided by the Sandy Bridge Extreme chipset, then there is really no need to consider the i7-3820 at all. There are, however, a lot of reasons you might be considering an i7-3820 and the Sandy Bridge Extreme chipset. A lot of gamers would love to have a full 40 PCIe lanes to play around with, allowing them three GPUs running at x16 and a fourth at x8. We've decisively proven in the past that the GPU is the deciding factor in gameplay anyway. Maybe you like the idea of being prepared for the next generation of GPUs running on PCIe 3.0 lanes, which offer twice the bandwidth of PCIe 2.0 lanes. Our memory bandwidth tests certainly showed that quad-channel memory had a dramatic affect on memory bandwidth capabilities as well. The key, it seems, to deciding whether or not you should consider the i7-3820, lies in what you will be using it for. Gamers could certainly see the benefits in the Sandy Bridge Extreme chipset that we just outlined. But even the most intense games available right now can be played with ease on a P67 or Z68 motherboard with the right components. A P67 or Z68 system will also probably end up being less expensive in the long run. Even the i7-3820 is very competitively priced based on its own specifications, you'll need a LGA-2011 motherboard to run it. Even the least expensive of these motherboards start at over $200, and you wouldn't be able to run quad-GPUs with those ones anyway.Intel Core i7-3820 ConclusionAs we have explained in the past, it's very hard to isolate a single component within a system. While we try to keep as many of the components static throughout the testing environment, it's impossible to keep everything the same. Any of these other components can cause fluctuations in the performances shown by the benchmarks. With that in mind, the i7-3820 performed pretty much just where it should have in our tests. It topped out the quad-core CPUs in most of the tests and beat out the six-core 980X in many of the tests. Of course, so did the i7-2600K. I would have liked to see a little better performance, but it sits nicely for its price.
While the Sandy Bridge Extreme CPUs brought on six-core processors, the i7-3820 isn't one of them. In fact, the i7-3820 resembles a normal Sandy Bridge CPU in architecture more than one of the six-core Extreme CPUs. It trades in the on-die GPU for an extra 2MB of cache. In the end, however, there is nothing new or unexpected about the i7-3820. Overclocking the i7-3820 turned out to be a real pleasure. I have to give the i7-3820 props. As a CPU without an X or a K attached to the end of it, you really wouldn't expect it to overclock very well. We've become accustomed to the locked Sandy Bridge CPUs only being able to overclock 400MHz higher, and even then only on one core and only when turbo-boost is in use. With the new ability of the Sandy Bridge Extreme platform to overclock the bclk, however, things have change dramatically. Pushing the bclk frequency up will overclock the CPU from the start, regardless of Turbo-Boost or number of cores in use. By increasing the bclk to 125MHz over 100MHz, I was able to give the i7-3820 a 1.15GHz boost in clock speed. That's quite a bit more than the 400MHz we might have expected from a Sandy Bridge locked CPU. Functionally, the i7-3820 is very similar to top end of the regular Sandy Bridge CPUs, the i7-2700 with a little more cache. Pitting the i7-3820 against the high-end of the regular Sandy Bridge series isn't going to yield much different results. The functionality of the i7-3820 really lies in the Sandy Bridge Extreme chipset and its increased capabilities. At $319.99 (NewEgg), the i7-3820 is actually less expensive than both the i7-2700K and the i7-2600K. The 3820 also comes stock clocked at 3.6GHz, 100MHz faster than the 2700K and 200MHz faster than the 2600K. It also has 2MB more L3 cache. Just looking at the specs, the i7-3820 is amazingly priced. The difference comes in chipset. You'll have to spend more money on the motherboard, offsetting the few dollars you'd save on the CPU. Depending on what your using it for, however, it's likely worth it.Pros:
|
|||||||||||||||||||||||||||||||||||||||||||||||||||||||||||||||||||||||||||||||||||||||||||||||||||||||||||||||||||||||||||||||


Comments
For two CF/SLI GPUs we have P67 motherboards in the $120~$180 range.
For tri-fire/SLI or more we have NF200 equipped P8P67 WS Revolution and Rampage boards that sell for the same price of a low-end LGA 2011 motherboard. This is a hard sell either because it's not good enough or LGA 1155 is just too good.
simply seems intel sponsered benchmark to fakely demonstrate 3xxx is best processor