| AMD Phenom-II X4-980 BE Processor |
| Reviews - Featured Reviews: Processors | |
| Written by Hank Tolman | |
| Tuesday, 03 May 2011 | |
AMD Phenom-II X4-980 BE Deneb Processor Review
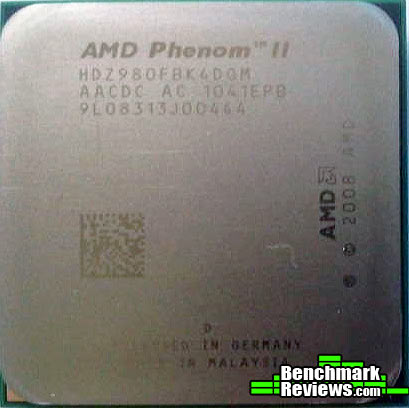
Manufacturer: Advanced Micro Devices, Inc. (AMD) Full Disclosure: The product sample used in this article has been provided by AMD, Inc. Last week I was a little surprised to find an email in my inbox about a new AMD CPU. Like many of you, I have been anxiously anticipating the arrival of a desktop platform for the new Bulldozer lineup. I have to admit that I was a little disappointed that the CPU being released this week isn't from a new series. That being said, it is always fun to test the newest CPUs of any series, especially the extremely popular Phenom-II X4 series CPUs. As is common with AMD CPUs, the next in the Phenom-II X4 Black Edition series is being released; the Phenom-II X4-980BE HDZ980FBK4DGM. The X4-980BE will take over as AMDs flagship quad-core processor and guess what, it is 100MHz faster than the current quad-core king at 3.7GHz. Without surprise the Phenom-II X4-980BE will be released at the same price the X4-975BE was released in January 2011 with an MSRP of $195. And because we are just that reliable, Benchmark Reviews is here to give you the run down on the Phenom-II X4-980BE to show you how it stacks up against its younger brothers and the similarly priced (though slightly more expensive) Core i5-2500K.
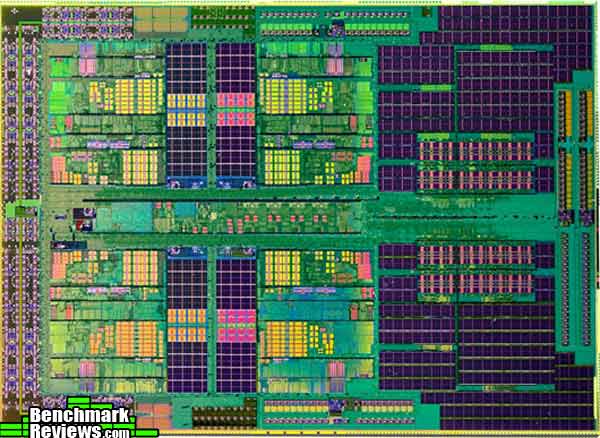
By now we are all familiar with the Phenom-II X4 series, or at least we thought we were until AMD released the Phenom-II X4-840 CPU back in January 2011. Just so we are aware, being called a Phenom-II doesn't automatically mean you get a L3 cache anymore. You really have to pay attention to the numbering convention now in order to figure out what you are getting. The Phenom-II X4-980BE, like the other Phenom-II X4-900 series processors, is built on the Deneb die. There aren't any changes to the processor itself, except for the fact that its core clock speed is set to 3.7GHz instead of 3.6GHz like the Phenom-II X4-975BE. Basically, the stock multiplier is bumped up from x18 to x18.5. Multiply that by the bus speed of 200MHz and you get your 3700MHz. The BE on the end of the name Phenom-II X4-980BE stands for Black Edition. This means that the stock multiplier of x18.5 isn't locked like it is on non-Black Edition processors, making it easier to overclock because you don't have to rely on increasing the bus speed as much. Since the bus speed doesn't just control the overall clock of the processor, overclocking can be dangerous for other components, especially if they aren't as good at overclocking as the Phenom-II X4-900 series processors have proven to be. I have to admit that most of my excitement at the release of new AMD CPUs within the Athlon-II and Phenom-II series is based off the fact that the previous processors get a price cut. The overclockability of these two series of CPUs has been proven here at Benchmark Reviews time and time again. They remain solid at high clock speeds and the resulting performance increases can be pretty amazing. At the same time, the already low prices of the Athlon-II and Phenom-II lines of CPUs make them great for overclockers and non-overclockers alike, though I have found the Athlon-IIs to be of a little higher price/performance ratio. Without further ado, let's head inside and check out the next step in the Phenom-II series, the Phenom-II X4-980BE.Phenom-II X4-980BE FeaturesAMD64 with Direct Connect Architecture
AMD Balanced Smart Cache
AMD Wide Floating Point Accelerator
HyperTransport Technology
Integrated DRAM Controller with AMD Memory Optimizer Technology
AMD Virtualization (AMD-V) Technology With Rapid Virtualization Indexing
AMD PowerNow! Technology (Cool'n'Quiet Technology)
AMD CoolCore Technology
Dual Dynamic Power Management
HDZ980FBK4DGM Specifications
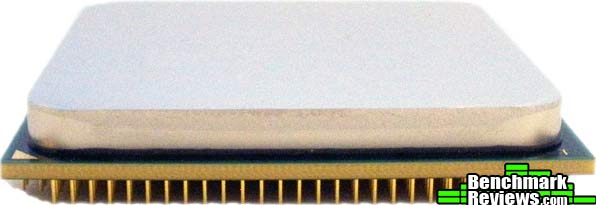
*Note: configurable for dual 64-bit channels for simultaneous read/writes Closer Look: Phenom-II X4-980BEThe Black Edition moniker tells us that the Phenom-II X4-980BE is ready for overclocking, and that's exactly what we are going to do with it. Before we get to that, let's look at the basics of the Phenom-II X4-980BE. The Athlon-II and Phenom-II CPUs are 45nm CPUs. That generation of CPUs, both on the Intel and the AMD side, tended to run quite a bit hotter than newer 32nm CPUs, especially the Sandy Bridge CPUs. That heat generation is a big concern for potential overclocking. Just because the CPU says it's Black Edition doesn't mean you can crank the multiplier up and run it as high as you want. The Phenom-II CPUs also had a little bit more surface area than the 45nm Intel processors; about 24% more. The Phenom-II X4-980 has a heat-spreader surface area of 1.47" x 1.47" (37.31 x 37.31mm). Aftermarket CPU cooler manufacturers can take advantage of that extra surface area in order to cool the CPUs a little better.
Getting a little further into the technical details, the Phenom-II X4-980BE has a nominal voltage of 0.825-1.4v. It comes out of the box taking about 1.4v, a little more than Intel CPUs, but it can be undervolted for the energy conscious consumer. Normally, I've been able to get the Phenom-II CPUs to be stable on about 1.20-1.25v. With the higher stock multiplier, the Phenom-II X4-980BE resides at the top end of that. I successfully undervolted it at stock speeds to 1.25v. On the flip-side, I pushed the voltage up to 1.60v during overclocking.
The Phenom-II X4-980BE is built on the AM3 938-pin micro grid array like all other Athlon-II and Phenom-II processors. This means it was meant for an AM3 motherboard. However, one of the things that has kept me a fan of AMD is that their newer processors have been backwards compatible with the AM2+ socket. This means you don't have to upgrade motherboard, RAM, CPU, and cooler all at once. That's nice for users on a budget. Unfortunately, this isn't going to be the case with the release of the AMD Fusion platforms in Bulldozer and Llano. Since they will be going to a 32nm fabrication process, a new motherboard will be necessary.
I have had great success overclocking AMD Athlon-II and Phenom-II processors. For their generation, the Phenom-IIs had some of the best overclocking potential available. This has changed a little with the release of the Sandy Bridge CPUs and with the incremental stock speed upgrades of the Phenom-II CPUs. The Phenom-II X4-900 series Black Edition CPUs have all been able to overclock pretty reliably to around 4.0GHz. That was true of those with stock clocks from 3.2GHz all the way to stock clocks of 3.6GHz. The reason for that is that all those CPUs are pretty much identical. The only difference is the stock clock speed set at the factory by the stock multiplier. As the stock speed increases, the overclocking potential decreases.
The other reason why overclocks up to 4.0GHz are not as impressive is due to the recent overclocking of the Sandy Bridge CPUs. Although much more restricted, the Sandy Bridge CPUs have been able to reach up to 5.0GHz overclocked speeds on air alone and the heat they produce at those speeds is much less than that of the Phenom-II CPUs fully overclocked. It's true that those speeds are really only Turbo Boost speeds because of the overclock restrictions of the Sandy Bridge CPUs and the P67-Express chipset, but even so, it makes the 4.0GHz of the Phenom-II series look outdated. With the Phenom-II X4-980BE CPU I had very minimal time to overclock. I didn't spend as much time or effort on it as I would have liked, but I was still able to overclock it very well. I incrementally bumped up the unlocked multiplier on the Phenom-II X4-980BE and stressed it with Prime95 running on all four cores. While I normally like to run this for 12 hours to ensure stability, I only did it for 6 hours this time, due to time constraints. Still, it is rare that a CPU lasting 6 hours won't make it to 12 hours. Without increasing the voltage on the CPU, I was able to get the multiplier only to x19.5 for a clock speed of 3.9GHz. That's an overclock of about 5%. I'm looking for a little more.
Testing and ResultsBefore I begin any benchmarking or overclocking, I thoroughly stress the CPU and memory by running Prime95 on all available cores, normally for 12 hours. In this review I stressed them for 6 hours. If no errors are found, I move on to a gaming stress test. To do this, I use Prime95 again to stress the processor, while running an instance of FurMark's stability test on top of this. If the computer survives this test for 2 hours without lockup or corruption, I consider it to be stable and ready for overclocking. After achieving what I feel is stable overclock, I run to these tests again for certainty. The goal of this stress testing is to ensure the clock speeds and settings are stable before performing any benchmarks. I adopted this method from another writer here at Benchmark Reviews and it seems to do a great job of flushing out what only seem to be stable overclocks.
Once the hardware is prepared, we begin our testing. Each benchmark test program begins after a system restart, and the very first result for every test will be ignored since it often only caches the test. This process proves extremely important in many gaming benchmarks, as the first run serves to cache maps allowing subsequent tests to perform much better than the first. Each test is completed five times, with the average results displayed in our article. The Phenom-II X4-980BE will become the most expensive and fastest AMD quad-core processor available. Set to release at an MSRP of $195, the Phenom-II X4-980BE competes directly with the Intel Core i5-2500 Sandy Bridge processor clocked at 3.3GHz. We have tested the Phenom-II X4-980BE against the Core i5-2500. Let's take a look at the results. (Prices are from NewEgg.com as of 5/2/11.)Intel H67 Test Platforms
Intel X58 Test Platform
AMD 890GX Test Platform
Benchmark Applications
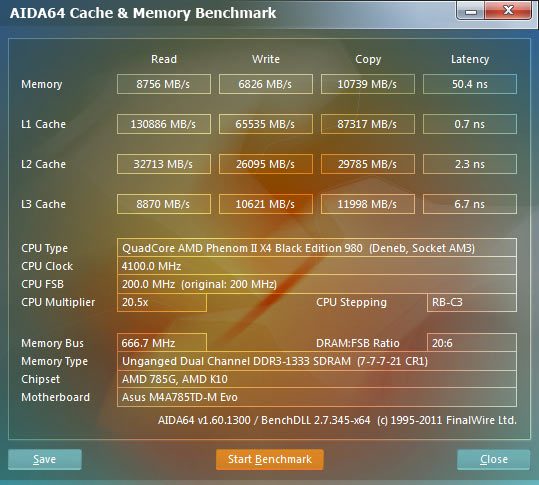
AIDA64 Extreme Edition v1.1 Benchmark TestsIn November, 2010, FinalWire acquired and discontinued Lavalys EVEREST, updated it, and released it as AIDA64. AIDA64 is an industry leading system diagnostics and benchmarking solution for enthusiasts PC users, based on the award-winning EVEREST Technology. During system optimizations and tweaking it provides essential system and overclock information, advanced hardware monitoring and diagnostics capabilities to check the effects of the applied settings. CPU, FPU and memory benchmarks are available to measure the actual system performance and compare it to previous states or other systems. Furthermore, complete software, operating system and security information makes AIDA64 a comprehensive system diagnostics tool that offers a total of 100 pages of information about your PC.
All of the benchmarks used in our test bed rely on basic x86 instructions and consume very low system memory while also being aware of HyperThreading, multi-processors, and multi-core processors. While the AIDA64 CPU tests really only compare the processor performance more than it measures platforms, it still offers a glimpse into what kind of power each platform possesses. Queen and Photoworxx tests are synthetic benchmarks that operate the function many times and over-exaggerate by several magnitudes what the real-world performance would be like. The Queen benchmark focuses on the branch prediction capabilities and misprediction penalties of the CPU. It does this by finding possible solutions to the classic queen problem on a chessboard. At the same clock speed theoretically the processor with the shorter pipeline and smaller misprediction penalties will attain higher benchmark scores.
Like the Queen benchmark, the Photoworxx tests for penalties against pipeline architecture. The synthetic Photoworxx benchmark stresses the integer arithmetic and multiplication execution units of the CPU and also the memory subsystem. Due to the fact that this test performs high memory read/write traffic, it cannot effectively scale in situations where more than two processing threads are used. The AIDA64 Photoworxx benchmark performs the following tasks on a very large RGB image:
I have noticed over time that the Photoworxx test, unlike most of the other AIDA64 tests, depends a lot on the L3 cache. In this test more than any other, the CPUs that have an L3 cache perform a lot better than those that do not. Once again, the Phenom-II X4-980 tops the AMD CPUs and this time it even outperforms the newly released Core i5-2500 CPU. The Zip Library test measures combined CPU and memory subsystem performance through the public ZLib compression library. ZLib is designed as a free lossless data compression library for use on virtually any computer hardware and operating system. The ZLib data format is itself portable across platforms and has a footprint independent of input data that can be reduced at some cost in compression.
The AES integer benchmark measures CPU performance using AES data encryption. It utilizes Vincent Rijmen, Antoon Bosselaers and Paulo Barreto's public domain C code in ECB mode and consumes 48 MB of memory. 
While I normally like to put both of the Everest integer performance tests on one graph, the Core i5-6500K made that impossible this time. With the new Sandy Bridge processors, Intel made some major changes to the way their CPUs handle AES compression. This new processing is a boon to webmasters everywhere, as well as anyone who deals with encrypted files on a regular basis. With that in mind, the Core i5 processor completely destroys the competition in the AES test. 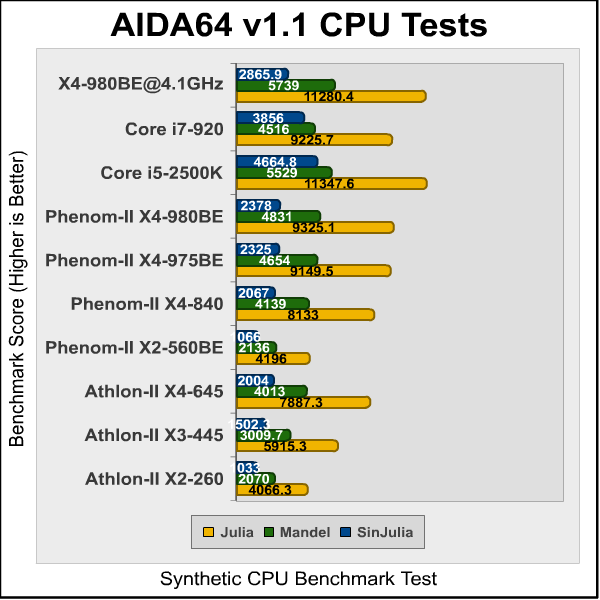
Next we will take a look at the Passmark Performance Test results. Passmark Performance TestPassMark Performance Test is a PC hardware benchmark utility that allows a user to quickly assess the performance of their computer and compare it to a number of standard 'baseline' computer systems. The Passmark Performance Test CPU tests all benchmark the mathematical operations, compression, encryption, SSE, and 3DNow! instructions of modern processors. In our tests there were several areas of concentration for each benchmark, which are combined into one compound score. This score is referred to as the CPU Mark, and is a composite of the following tests: Integer Math, Floating Point Math, Find Prime Numbers, SSE/3DNow!, Compression, Encryption, Image Rotation, and String Sorting. For this review, we've also decided to run the memory benchmark, which results in a composite score based on the following tests: small block allocation, cached read, uncached read, write performance, and large block allocation.
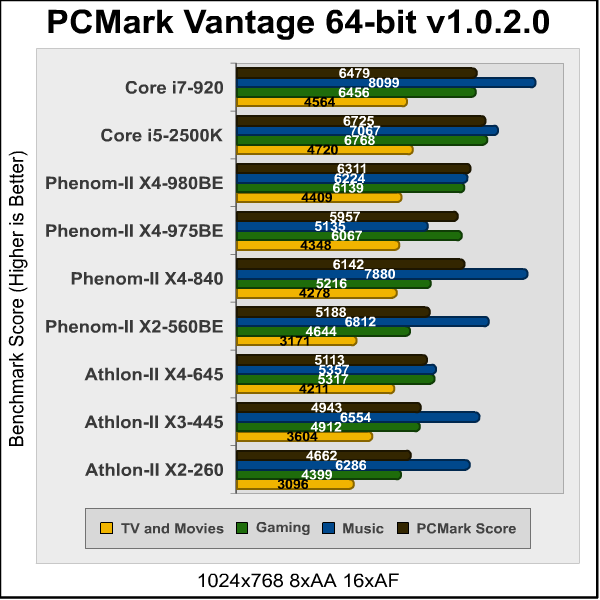
Up next are the results from the PCMark Vantage Benchmark tests. PCMark Vantage Benchmark TestsPCMark Vantage is an objective hardware performance benchmark tool for PCs running 32- and 64-bit versions of Microsoft Windows Vista or Windows 7. PCMark Vantage is well suited for benchmarking any type of Microsoft Windows Vista/7 PC: from multimedia home entertainment systems and laptops, to dedicated workstations and high-end gaming rigs. Benchmark Reviews has decided to use a few select tests from the suite to demonstrate simulated real-world processor usage in this article. Our tests were conducted on 64-bit Windows 7, with results displayed in the chart below. TV and Movies Suite
Gaming Suite*
Music Suite
* EDITOR'S NOTE: Hopefully our readers will carefully consider how relative PCMark Vantage is as "real-world" benchmark, since many of the tests rely on unrelated hardware components. For example, per the FutureMark PCMark Vantage White Paper document, Gaming test #2 weighs the storage device for 100% of the test score. In fact, according to PCMark Vantage the video card only impacts 23% of the total gaming score, but the CPU represents 37% of the final score. As our tests in this article (and many others) has already proven, gaming performance has a lot more to do with the GPU than the CPU, and especially more than the hard drive or SSD (which is worth 38% of the final gaming performance score).
SiSoftware SandraSiSoftware Sandra (the System ANalyser, Diagnostic and Reporting Assistant) is an information & diagnostic utility. It should provide most of the information (including undocumented) you need to know about your hardware, software and other devices whether hardware or software. It works along the lines of other Windows utilities, however it tries to go beyond them and show you more of what's really going on. Giving the user the ability to draw comparisons at both a high and low-level. You can get information about the CPU, chipset, video adapter, ports, printers, sound card, memory, network, Windows internals, AGP, PCI, PCI-X, PCIe (PCI Express), database, USB, USB2, 1394/Firewire, etc. The SANDRA DhryStone and Whetstone tests are CPU tests that run completely within the CPU + cache memory itself. These tests are perfect for seeing general efficiency per processing core. Dhrystone is basically a suite of arithmetic and string manipulating programs and is an older CPU tests. Even so, it remains a simple and accurate way to show RAW CPU processing performance. The whetstone benchmark primarily measures floating-point arithmetic performance.  Cinebench R11.5 BenchmarksMaxon Cinebench is a real-world test suite that assesses the computer's performance capabilities. Cinebench is based on Maxon's award-winning animation software, Cinema 4D, which is used extensively by studios and production houses worldwide for 3D content creation. Maxon software has been used in blockbuster movies such as Spider-Man, Star Wars, The Chronicles of Narnia and many more. Cinebench Release 11.5 includes the ability to more accurately test the industry's latest hardware, including systems with up to 64 processor threads and the testing environment better reflects the expectations of today's production demands. A more streamlined interface makes testing systems and reading results incredibly straightforward. The Cinebench R11.5 test scenario uses all of a system's processing power to render a photorealistic 3D scene, "No Keyframes" the viral animation by AixSponza. This scene makes use of various algorithms to stress all available processor cores. The OpenGL graphics card testing procedure uses a complex 3D scene depicting a car chase with which the performance of your graphics card in OpenGL mode is measured. During the benchmark tests the graphics card is evaluated by way of displaying an intricate scene that includes complex geometry, high-resolution textures, and a variety of effects to evaluate the performance across a variety of real-world scenarios.
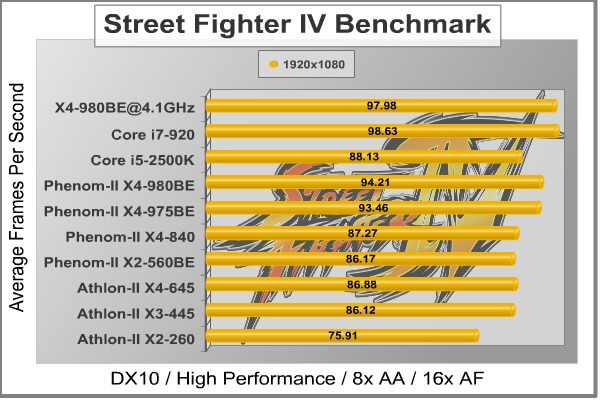
Street Fighter IV BenchmarkPC-based video games can depend heavily on the CPU if the attached GPU (Graphics Processing Unit) is less powerful, or the graphics settings are configured so low that they create no strain on the video card and must rely purely on system processing speed; a phenomenon known as CPU-dependence. The opposite is true when the video game has a powerful video card installed, and can handle all graphical demands without receiving assistance from the CPU. Benchmark Reviews has proven consistently that, with a high end GPU in use, frame rates are not often noticeably impacted by changes in processor or RAM. Capcom's Street Fighter IV is part of the now-famous Street Fighter series that began in 1987. The 2D Street Fighter II was one of the most popular fighting games of the 1990s, and now gets a 3D face-lift to become Street Fighter 4. The Street Fighter 4 benchmark utility was released as a novel way to test your system's ability to run the game. It uses a few dressed-up fight scenes where combatants fight against each other using various martial arts disciplines. Feet, fists and magic fill the screen with a flurry of activity. Due to the rapid pace, varied lighting and the use of music this is one of the more enjoyable benchmarks. Street Fighter IV uses a proprietary Capcom SF4 game engine, which is enhanced over previous versions of the game. In terms of 3D graphical demand, Street Fighter IV is considered very low-end for most desktop GPUs. While modern desktop computers with discrete graphics have no problem playing Street Fighter IV at its highest graphical settings, integrated and mobile GPUs have a difficult time producing playable frame rates with the lowest settings configured. While PC games are generally playable regardless of CPU, the Street Fighter IV game is surprisingly dependent on the CPU. That is why it is included here.
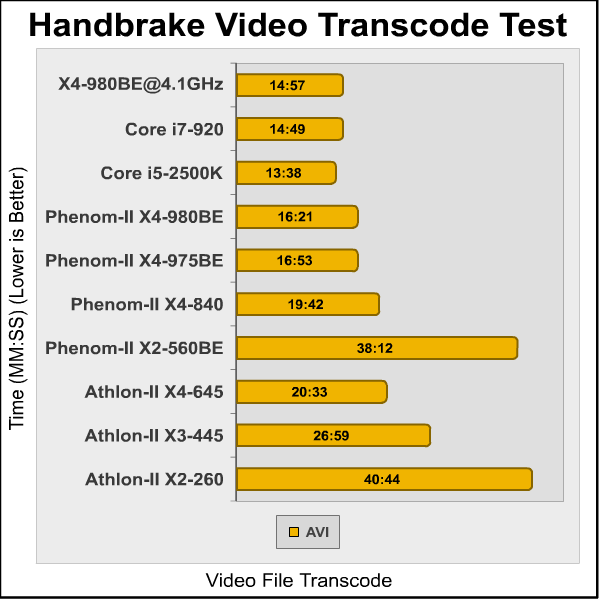
Let's take a look at some video transcoding tests next. Video Transcoding Tests
|
|


Comments
Your so called test is FAR from a real world experience.
By tha way my processor is Phenom II X3 720BE works rock solid 3.6GHz
Major running tasks include 2 Minecraft servers, a daily (at 12pm) backup from one hard drive to 2 others (Acronis Backup & Restore 10), AVG Business Pro in the background and a Minecraft render (renders an overview map to a Google Maps interface) every hour.
I will occasionally run the Minecraft client & FRAPS together on the same machine.
This is on older generation (socket 940) gear so... maybe I'm not quite mainstream real-world, but I would consider game+AV+video convert as not /too/ far removed from the kind of workload I would put my AMD system through.
My current system copes beautifully, by the way. It would just be nice to see how modern hardware performs.
Throwing 2 or 3 'big' tasks at a system is the only way to know how well it really performs. CPU's have generally been 'fast enough' for 2 years. The only consumer-level task bottlenecked by CPU power is video converting and, really, how many consumers actually do that?
Gaming is limited by GPU and just about everything else gets stuck trickling through a SATA cable or wobbling around in a mostly circular fashion on a hard disk platter, waiting patiently for a read/write head to give it some attention.
So, can a system cope with playing Battlefield whilst your iPod video conversion, Torrent download, CD audio rip and BOINC job is running? Inquiring minds want to know.
Phenom II x4 965BE is now available for $120. The rest of the line seems to be similarly discounted around the web as well. I'm sure that AMD has a plan but wonder why the price point isn't more in line with moving silicon as a commodity at this late stage of the Phenom family tree.
-Hank