| MSI N460GTX Cyclone 1GD5/OC Video Card |
| Reviews - Featured Reviews: Video Cards | |||||||||||||||||||||||||||||||||||||||||||||||||||||||||||||||||||||||||||||||||||||||||||||||||||||||||||||||||||||||||||||||||||||||||||||||||||||||||||||||||||||||||||||||||||||||||||||||||||||||||||||||||||||||||||||||||||||||||||||||||||||||||||||||||||||||||||||||||||||||||||||||||||||||||||||||||||||||||||||||||||||||||||||||||||||||||||||||||||||||||||||||||||||||||||||||||||||||||||||||||||||||||||||||||||||||||||||||||||||||||||||||||||||||||||||||||||||||||||||||||||||||||||||||||||||||||||||||||||||||||||||||||||||||||||||||||||||||||||||||||||||||||||||||||||||||||||||||||||||||||||||||||||||||||||||||||||||||||||||||||||||||||||||||||||||||||||||||||||||||||||||||||||||||||||||||||||||||||||||||||||||||||||||||||||||||||||||||||||||||||||||||||||||||||||||||||||||||||||||||||||||||||||||||||||||||||||||||||||||||||||||||||||||||||||||||||||||||||||||||||||||||||||||||||
| Written by Bruce Normann | |||||||||||||||||||||||||||||||||||||||||||||||||||||||||||||||||||||||||||||||||||||||||||||||||||||||||||||||||||||||||||||||||||||||||||||||||||||||||||||||||||||||||||||||||||||||||||||||||||||||||||||||||||||||||||||||||||||||||||||||||||||||||||||||||||||||||||||||||||||||||||||||||||||||||||||||||||||||||||||||||||||||||||||||||||||||||||||||||||||||||||||||||||||||||||||||||||||||||||||||||||||||||||||||||||||||||||||||||||||||||||||||||||||||||||||||||||||||||||||||||||||||||||||||||||||||||||||||||||||||||||||||||||||||||||||||||||||||||||||||||||||||||||||||||||||||||||||||||||||||||||||||||||||||||||||||||||||||||||||||||||||||||||||||||||||||||||||||||||||||||||||||||||||||||||||||||||||||||||||||||||||||||||||||||||||||||||||||||||||||||||||||||||||||||||||||||||||||||||||||||||||||||||||||||||||||||||||||||||||||||||||||||||||||||||||||||||||||||||||||||||||||||||||||||
| Wednesday, 11 August 2010 | |||||||||||||||||||||||||||||||||||||||||||||||||||||||||||||||||||||||||||||||||||||||||||||||||||||||||||||||||||||||||||||||||||||||||||||||||||||||||||||||||||||||||||||||||||||||||||||||||||||||||||||||||||||||||||||||||||||||||||||||||||||||||||||||||||||||||||||||||||||||||||||||||||||||||||||||||||||||||||||||||||||||||||||||||||||||||||||||||||||||||||||||||||||||||||||||||||||||||||||||||||||||||||||||||||||||||||||||||||||||||||||||||||||||||||||||||||||||||||||||||||||||||||||||||||||||||||||||||||||||||||||||||||||||||||||||||||||||||||||||||||||||||||||||||||||||||||||||||||||||||||||||||||||||||||||||||||||||||||||||||||||||||||||||||||||||||||||||||||||||||||||||||||||||||||||||||||||||||||||||||||||||||||||||||||||||||||||||||||||||||||||||||||||||||||||||||||||||||||||||||||||||||||||||||||||||||||||||||||||||||||||||||||||||||||||||||||||||||||||||||||||||||||||||||
MSI N460GTX Cyclone 1GD5/OC ReviewThere is no doubt that the NVIDIA GTX 460 has created quite a splash since its introduction. The reconfigured Fermi architecture of the new GF104 chip gives the card a welcome boost in gaming performance, compared to the first GPUs in the series. With 1/3 fewer transistors to feed, the board uses much less power, runs cooler, and it overclocks well with just air cooling. With that kind of capability baked into the basic design, it didn't take long for NVIDIA's partners to start releasing overclocked editions with advanced cooling hardware. MSI has taken on the challenge, and released one of their custom designs under the Cyclone banner. Benchmark Reviews can't resist a good HSF assembly; that much should be obvious to long term readers. So here we are with a detailed review of the MSI N460GTX Cyclone 1GD5/OC video card.
Software control of a video card's clocks and core voltage is the fastest and easiest way to improve its performance. MSI Afterburner is one of the best monitoring and control software products available, and it brings voltage control to the GTX 460 reference design. With so much apparent thermal headroom available on the GTX 460, the ability to bump up the core voltage on the GPU is quite useful. Add in an oversized heat sink and an oversized fan, and you have a recipe for generous overclocks. Driver updates are a touchy subject for the enthusiast and gaming communities. They are a necessary evil, IMHO. I like the performance and stability improvements they (sometimes...!) bring, but I wish I didn't have to constantly mess with them. Not every update is needed by every user, but for a new product like the GTX 4xx series it seems like every second or third release is a necessary update. Either the performance increases are too great to ignore, or the vendor has fixed a major bug that affects a large number of users. NVIDIA released a major performance upgrade to their Fermi drivers right around the same time as the GTX 460 hit the market and got some great synergy from the combination. "What we have here is the perfect storm." When you combine the newly improved Fermi architecture of the GF104, its overclocking ability, the latest performance-enhancing device drivers, enhanced cooling performance, and software voltage control, that's what you get: the perfect storm. Ride along with Benchmark Reviews as we see how high we can crest this wave before crashing into a watery trough.
Manufacturer: Micro-Star Int'l Co., Ltd Full Disclosure: The product sample used in this article has been provided by MSI. NVIDIA GeForce GTX 460 GPU FeaturesThe features of the GF104 GPU contained in the N460GTX are fully comparable with the latest offerings from both major GPU camps. We've been using most of these, or similar technologies, on Radeon 5xxx cards since last September, now we have rough parity in GPU features. Here are the Features and Specifications directly related to the GPU, as provided by the manufacturer, NVIDIA:
Microsoft DirectX 11 SupportDirectX 11 GPU with Shader Model 5.0 support designed for ultra high performance in the new API's key graphics feature, GPU-accelerated tessellation. NVIDIA PhysX TechnologyFull support for NVIDIA PhysX technology, enabling a totally new class of physical gaming interaction for a more dynamic and realistic experience with GeForce. NVIDIA 3D Vision Ready*GeForce GPU support for NVIDIA 3D Vision, bringing a fully immersive stereoscopic 3D experience to the PC. A combination of high-tech wireless glasses and advanced software, 3D Vision transforms hundreds of PC games into full stereoscopic 3D. In addition, you can watch 3D movies and 3D digital photographs in eye popping, crystal-clear quality. NVIDIA 3D Vision Surround Ready**Expand your games across three displays in full stereoscopic 3D for the ultimate "inside the game" experience with the power of NVIDIA 3D Vision and SLI technologies. NVIDIA Surround also supports triple screen gaming with non-stereo displays. NVIDIA CUDA TechnologyCUDA technology unlocks the power of the GPU's processor cores to accelerate the most demanding tasks such as video transcoding, physics simulation, ray tracing, and more, delivering incredible performance improvements over traditional CPUs. NVIDIA SLI Technology***Industry leading NVIDIA SLI technology offers amazing performance scaling for the world's premier gaming solution. 32x Anti-aliasing TechnologyLightning fast, high-quality anti-aliasing at up to 32x sample rates obliterates jagged edges. NVIDIA PureVideo HD Technology****The combination of high-definition video decode acceleration and post-processing that delivers unprecedented picture clarity, smooth video, accurate color, and precise image scaling for movies and video. PCI Express 2.0 SupportDesigned for the new PCI Express 2.0 bus architecture offering the highest data transfer speeds for the most bandwidth-hungry games and 3D applications, while maintaining backwards compatibility with existing PCI Express motherboards for the broadest support. Dual-link DVI SupportAble to drive industry's largest and highest resolution flat-panel displays up to 2560x1600 and with support for High-bandwidth Digital Content Protection (HDCP). HDMI 1.4a Support*****Fully integrated support for HDMI 1.4a including GPU accelerated Blu-ray 3D4 support, xvYCC, deep color, and 7.1 digital surround sound including Dolby TrueHD and DTS-HD. Upgrade your GPU to full 3D capability with NVIDIA 3DTV Play software, enabling 3D gaming, picture viewing and 3D web video streaming. See www.nvidia.com/3dtv for more details.
* NVIDIA 3D Vision requires 3D Vision glasses and a 3D Vision-Ready monitor. See www.nvidia.com/3dvision for more information. NVIDIA GeForce GTX 460 GPU SpecificationsGPU Engine Specs (1GB model at 725MHz): |
|||||||||||||||||||||||||||||||||||||||||||||||||||||||||||||||||||||||||||||||||||||||||||||||||||||||||||||||||||||||||||||||||||||||||||||||||||||||||||||||||||||||||||||||||||||||||||||||||||||||||||||||||||||||||||||||||||||||||||||||||||||||||||||||||||||||||||||||||||||||||||||||||||||||||||||||||||||||||||||||||||||||||||||||||||||||||||||||||||||||||||||||||||||||||||||||||||||||||||||||||||||||||||||||||||||||||||||||||||||||||||||||||||||||||||||||||||||||||||||||||||||||||||||||||||||||||||||||||||||||||||||||||||||||||||||||||||||||||||||||||||||||||||||||||||||||||||||||||||||||||||||||||||||||||||||||||||||||||||||||||||||||||||||||||||||||||||||||||||||||||||||||||||||||||||||||||||||||||||||||||||||||||||||||||||||||||||||||||||||||||||||||||||||||||||||||||||||||||||||||||||||||||||||||||||||||||||||||||||||||||||||||||||||||||||||||||||||||||||||||||||||||||||||||||


|
Graphics Card |
Processor |
Core Clock |
Shader Clock |
Memory Clock |
Memory |
Memory |
| XFX Radeon HD5750 (HD-575X-ZNFC) |
720 |
700 |
N/A |
1150 |
1.0GB GDDR5 |
128-bit |
| ATI Radeon HD5770 (Engineering Sample) |
800 |
850 |
N/A |
1200 |
1.0GB GDDR5 |
128-bit |
| XFX Radeon HD5830 (HD-583X-ZNFV) |
1120 |
800 |
N/A |
1000 |
1.0GB GDDR5 |
256-bit |
|
ASUS GeForce GTX 260 (ENGTX260 MATRIX) |
216 |
576 |
1242 |
999 |
896MB GDDR3 |
448-bit |
| MSI GeForce GTX460 (N460GTX Cyclone 1GD5/OC) |
336 |
725 |
1450 |
900 |
1.0GB GDDR5 |
256-bit |
|
XFX Radeon HD5850 (21162-00-50R) |
1440 |
725 |
N/A |
1000 |
1.0GB GDDR5 |
256-bit |
|
MSI GeForce GTX460-OC (N460GTX Cyclone 1GD5/OC) |
336 |
850 |
1700 |
1050 |
1.0GB GDDR5 |
256-bit |
|
ASUS GeForce GTX 285 (MATRIX GTX285) |
240 |
662 |
1476 |
1242 |
1.0GB GDDR3 |
512-bit |
|
XFX Radeon HD5870 (HD-587X-ZNFC) |
1600 |
850 |
N/A |
1200 |
1.0GB GDDR5 |
256-bit |
|
ASUS Radeon HD5870-OC (EAH5870/2DIS/1GD5/V2) |
1600 |
1000 |
N/A |
1250 |
1.0GB GDDR5 |
256-bit |
-
XFX Radeon HD5750 (HD-575X-ZNFC - Catalyst 8.732.0.0)
-
ATI Radeon HD5770 (Engineering Sample - Catalyst 8.732.0.0)
-
XFX Radeon HD5830 (HD-583X-ZNFV - Catalyst 8.732.0.0)
-
MSI GeForce GTX 460 (N460GTX Cyclone 1GD5/OC - Forceware v258.96)
-
XFX Radeon HD5850 (21162-00-50R - ATI Catalyst 8.732.0.0)
-
ASUS GeForce GTX 260 (ENGTX260 MATRIX - Forceware v197.45)
-
ASUS GeForce GTX 285 (GTX285 MATRIX - Forceware v197.45)
-
XFX Radeon HD5870 (HD-587X-ZNFC - Catalyst 8.732.0.0)
-
ASUS Radeon HD5870 (EAH5870/2DIS/1GD5/V2) - Catalyst 8.732.0.0)
3DMark Vantage Performance Tests
3DMark Vantage is a computer benchmark by Futuremark (formerly named Mad Onion) to determine the DirectX 10 performance of 3D game performance with graphics cards. A 3DMark score is an overall measure of your system's 3D gaming capabilities, based on comprehensive real-time 3D graphics and processor tests. By comparing your score with those submitted by millions of other gamers you can see how your gaming rig performs, making it easier to choose the most effective upgrades or finding other ways to optimize your system.
There are two graphics tests in 3DMark Vantage: Jane Nash (Graphics Test 1) and New Calico (Graphics Test 2). The Jane Nash test scene represents a large indoor game scene with complex character rigs, physical GPU simulations, multiple dynamic lights, and complex surface lighting models. It uses several hierarchical rendering steps, including for water reflection and refraction, and physics simulation collision map rendering. The New Calico test scene represents a vast space scene with lots of moving but rigid objects and special content like a huge planet and a dense asteroid belt.
At Benchmark Reviews, we believe that synthetic benchmark tools are just as valuable as video games, but only so long as you're comparing apples to apples. Since the same test is applied in the same controlled method with each test run, 3DMark is a reliable tool for comparing graphic cards against one-another.
1680x1050 is rapidly becoming the new 1280x1024. More and more widescreen are being sold with new systems or as upgrades to existing ones. Even in tough economic times, the tide cannot be turned back; screen resolution and size will continue to creep up. Using this resolution as a starting point, the maximum settings were applied to 3DMark Vantage include 8x Anti-Aliasing, 16x Anisotropic Filtering, all quality levels at Extreme, and Post Processing Scale at 1:2.
3DMark Vantage GPU Test: Jane Nash
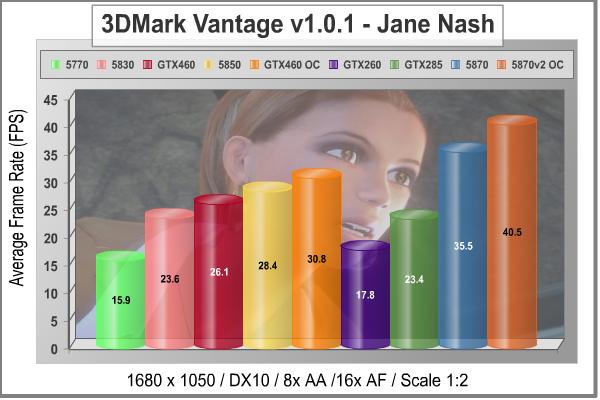
Our first test shows the GTX460 placed right where NVIDIA wants it, just ahead of the ATI HD 5830. The MSI N460GTX Cyclone is overclocked from the factory, by about 7.5% (+50MHz), and I am also showing the results from a more substantial overclock of 25%, to 850 MHz on the core. When overclocked by 25%, the N460GTX outperforms the HD 5850 by over 8%. All the results are very even and linear, just the way synthetic benchmarks are supposed to be. The only hitch in the graph is caused by the older GT200-based cards, which I am including for reference in case you want to see whether it's worth upgrading. The synthetic results overwhelmingly say, Yes.

At 1920x1200 native resolution, things look much the same as they did at the lower screen size; just the absolute values are lower, the ranking stays the same. One thing you may have noticed is how well the HD 5830 does on this test, compared to the HD 5770. That issue has been beat to death, but I mention it to demonstrate that the N460GTX beats the HD 5830 even when it has everything going for it. The 5870 is the only card that can break 30FPS at this resolution, and it's pretty obvious as the test plays out on the screen. All the lower choices seem choppy by comparison. Let's take a look at test#2, which has a lot more surfaces to render, with all those asteroids flying around the doomed planet New Calico.
3DMark Vantage GPU Test: New Calico
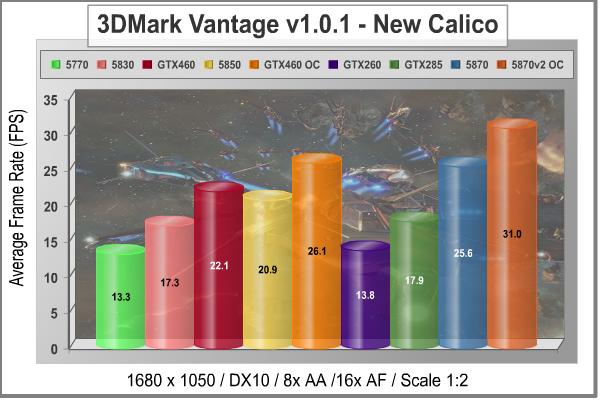
In the medium resolution New Calico test, the slightly overclocked MSI N460GTX Cyclone does so well that it edges out an ATI HD 5850 with base clocks. That's an impressive feat for a card in this price range. The higher overclock results show that synthetic performance scales linearly with higher clock rates, just as you would suspect. Even though the 850 MHz GTX 460 gets within 4 FPS to a highly overclocked HD 5870, it still takes a 1.0 GHz Cypress core to get over 30 FPS in this benchmark, which shows how tough this test really is.

At a higher screen resolution of 1920x1200, the N460GTX Cyclone with its mild factory OC keeps a slim lead over the HD 5850, less than 1 FPS. Again, an increase in Core and Shader clocks for the GTX 460 provides a roughly 1:1 increase in frame rates. Even the fastest single GPU cards have trouble rendering this scene, with an average frame rate in the mid 20s. Soon this benchmark suite may be replaced with DX11-based tests, but in the fading days of DX10 it has been a very reliable benchmark for high-end video cards.
We need to look at some actual gaming performance to verify these results, so let's take a look in the next section, at how these cards stack up in the standard bearer for gaming benchmarks, Crysis.
|
Graphics Card |
Processor |
Core Clock |
Shader Clock |
Memory Clock |
Memory |
Memory |
| XFX Radeon HD5750 (HD-575X-ZNFC) |
720 |
700 |
N/A |
1150 |
1.0GB GDDR5 |
128-bit |
| ATI Radeon HD5770 (Engineering Sample) |
800 |
850 |
N/A |
1200 |
1.0GB GDDR5 |
128-bit |
| XFX Radeon HD5830 (HD-583X-ZNFV) |
1120 |
800 |
N/A |
1000 |
1.0GB GDDR5 |
256-bit |
|
ASUS GeForce GTX 260 (ENGTX260 MATRIX) |
216 |
576 |
1242 |
999 |
896MB GDDR3 |
448-bit |
| MSI GeForce GTX460 (N460GTX Cyclone 1GD5/OC) |
336 |
725 |
1450 |
900 |
1.0GB GDDR5 |
256-bit |
|
XFX Radeon HD5850 (21162-00-50R) |
1440 |
725 |
N/A |
1000 |
1.0GB GDDR5 |
256-bit |
|
MSI GeForce GTX460-OC (N460GTX Cyclone 1GD5/OC) |
336 |
850 |
1700 |
1050 |
1.0GB GDDR5 |
256-bit |
|
ASUS GeForce GTX 285 (MATRIX GTX285) |
240 |
662 |
1476 |
1242 |
1.0GB GDDR3 |
512-bit |
|
XFX Radeon HD5870 (HD-587X-ZNFC) |
1600 |
850 |
N/A |
1200 |
1.0GB GDDR5 |
256-bit |
|
ASUS Radeon HD5870-OC (EAH5870/2DIS/1GD5/V2) |
1600 |
1000 |
N/A |
1250 |
1.0GB GDDR5 |
256-bit |
Crysis Performance tests
Crysis uses a new graphics engine: the CryENGINE2, which is the successor to Far Cry's CryENGINE. CryENGINE2 is among the first engines to use the Direct3D 10 (DirectX 10) framework, but can also run using DirectX 9, on Vista, Windows XP and the new Windows 7. As we'll see, there are significant frame rate reductions when running Crysis in DX10. It's not an operating system issue, DX9 works fine in WIN7, but DX10 knocks the frame rates in half.
Roy Taylor, Vice President of Content Relations at NVIDIA, has spoken on the subject of the engine's complexity, stating that Crysis has over a million lines of code, 1GB of texture data, and 85,000 shaders. To get the most out of modern multicore processor architectures, CPU intensive subsystems of CryENGINE2 such as physics, networking and sound, have been re-written to support multi-threading.
Crysis offers an in-game benchmark tool, which is similar to World in Conflict. This short test does place some high amounts of stress on a graphics card, since there are so many landscape features rendered. For benchmarking purposes, Crysis can mean trouble as it places a high demand on both GPU and CPU resources. Benchmark Reviews uses the Crysis Benchmark Tool by Mad Boris to test frame rates in batches, which allows the results of many tests to be averaged.
Low-resolution testing allows the graphics processor to plateau its maximum output performance, and shifts demand onto the other system components. At the lower resolutions Crysis will reflect the GPU's top-end speed in the composite score, indicating full-throttle performance with little load. This makes for a less GPU-dependant test environment, but it is sometimes helpful in creating a baseline for measuring maximum output performance. At the 1280x1024 resolution used by 17" and 19" monitors, the CPU and memory have too much influence on the results to be used in a video card test. At the widescreen resolutions of 1680x1050 and 1900x1200, the performance differences between video cards under test are mostly down to the cards themselves.

With medium screen resolution and no MSAA dialed in, the MSI N460GTX Cyclone is on par with the HD 5830 and the same card with a 175 MHz overclock is about one FPS behind a stock HD 5850. Unlike many so-called TWIMTBP titles, Crysis has always run quite well on the ATI architecture. The GTX 460 is still competitive here at current pricing, so don't look at the performance in this title as anything like a failure. It's just not a slam dunk victory for NVIDIA this time.
Crysis is one of those few games that stress the CPU almost as much as the GPU. As we increase the load on the graphics card, with higher resolution and AA processing, the situation may change. Remember all the test results in this article are with maximum allowable image quality settings, plus all the performance numbers in Crysis took a major hit when Benchmark Reviews switched over to the DirectX 10 API for all our testing.

At 1900 x 1200 resolution, the relative rankings stay the same; the raw numbers just go down. With the increased load on the GPU, the GTX 460 can't quite get above the 30 FPS mark, even with a 25% overclock. It takes more than any mid-range GPU can muster to play Crysis at high resolution, but that's no surprise.

Now let's turn up the heat a bit, and add some Multi-Sample Anti-Aliasing. With 4x MSAA cranked in, the MSI N460GTX Cyclone 1GD5/OC loses about 5 FPS at 1680x1050 screen resolution. This time however, the GTX 460 with a major overclock manages to stay just above the 30 FPS line. Compared to the ATI offerings, the N460GTX with out-of-the-box settings hangs tight with the HD 5830, and when pushed to 850 MHz core, sticks with the HD 5850. Very competitive results.... None of the GT200 cards are a serious threat to the newer cards with their 40nm GPU technology.

This is one of our toughest tests, at 1900 x 1200, maximum quality levels, and 4x AA. Only one GPU gets above 30 FPS in this test, and until recently it was the fastest single-GPU card on the planet, the Radeon HD 5870. In the middle ranges, the HD 5850 holds on to its spot as performance leader, but the GTX 460 is starting to look like it might be the value leader. We'll have to get a lot more results tabulated before we can make that judgment.
In our next section, Benchmark Reviews tests with Devil May Cry 4 Benchmark. Read on to see how a blended high-demand GPU test with low video frame buffer demand will impact our test products.
|
Graphics Card |
Processor |
Core Clock |
Shader Clock |
Memory Clock |
Memory |
Memory |
| XFX Radeon HD5750 (HD-575X-ZNFC) |
720 |
700 |
N/A |
1150 |
1.0GB GDDR5 |
128-bit |
| ATI Radeon HD5770 (Engineering Sample) |
800 |
850 |
N/A |
1200 |
1.0GB GDDR5 |
128-bit |
| XFX Radeon HD5830 (HD-583X-ZNFV) |
1120 |
800 |
N/A |
1000 |
1.0GB GDDR5 |
256-bit |
|
ASUS GeForce GTX 260 (ENGTX260 MATRIX) |
216 |
576 |
1242 |
999 |
896MB GDDR3 |
448-bit |
| MSI GeForce GTX460 (N460GTX Cyclone 1GD5/OC) |
336 |
725 |
1450 |
900 |
1.0GB GDDR5 |
256-bit |
|
XFX Radeon HD5850 (21162-00-50R) |
1440 |
725 |
N/A |
1000 |
1.0GB GDDR5 |
256-bit |
|
MSI GeForce GTX460-OC (N460GTX Cyclone 1GD5/OC) |
336 |
850 |
1700 |
1050 |
1.0GB GDDR5 |
256-bit |
|
ASUS GeForce GTX 285 (MATRIX GTX285) |
240 |
662 |
1476 |
1242 |
1.0GB GDDR3 |
512-bit |
|
XFX Radeon HD5870 (HD-587X-ZNFC) |
1600 |
850 |
N/A |
1200 |
1.0GB GDDR5 |
256-bit |
|
ASUS Radeon HD5870-OC (EAH5870/2DIS/1GD5/V2) |
1600 |
1000 |
N/A |
1250 |
1.0GB GDDR5 |
256-bit |
Devil May Cry 4 Test Results
Devil May Cry 4 was released for the PC platform in early 2007 as the fourth installment to the Devil May Cry video game series. DMC4 is a direct port from the PC platform to console versions, which operate at the native 720P game resolution with no other platform restrictions. Devil May Cry 4 uses the refined MT Framework game engine, which has been used for many popular Capcom game titles over the past several years.
MT Framework is an exclusive seventh generation game engine built to be used with games developed for the PlayStation 3 and Xbox 360, and PC ports. MT stands for "Multi-Thread", "Meta Tools" and "Multi-Target". Originally meant to be an outside engine, but none matched their specific requirements in performance and flexibility. Games using the MT Framework are originally developed on the PC and then ported to the other two console platforms. On the PC version a special bonus called Turbo Mode is featured, giving the game a slightly faster speed, and a new difficulty called Legendary Dark Knight Mode is implemented. The PC version also has both DirectX 9 and DirectX 10 mode for Windows XP, Vista, and Widows 7 operating systems.
It's always nice to be able to compare the results we receive here at Benchmark Reviews with the results you test for on your own computer system. Usually this isn't possible, since settings and configurations make it nearly difficult to match one system to the next; plus you have to own the game or benchmark tool we used. Devil May Cry 4 fixes this, and offers a free benchmark tool available for download. Because the DMC4 MT Framework game engine is rather low-demand for today's cutting edge video cards, Benchmark Reviews uses the 1920x1200 resolution to test with 8x AA (highest AA setting available to Radeon HD video cards) and 16x AF.
Devil May Cry 4 is not as demanding a benchmark as it used to be. Only scene #2 and #4 are worth looking at from the standpoint of trying to separate the fastest video cards from the slower ones. Still, it represents a typical environment for many games that our readers still play on a regular basis, so it's good to see what works with it and what doesn't. Any of the tested cards will do a credible job in this application, and the performance scales in a pretty linear fashion. You get what you pay for when running this game, at least for benchmarks. This is one time where you can generally use the maximum available anti-aliasing settings, so NVIDIA users should feel free to crank it up to 16X. The DX10 "penalty" is of no consequence here.

The N460GTX Cyclone puts one more nail in the coffin of the HD 5830 in this test, beating it by 19% with out-of-the-box settings. Overclock it like you mean it....and the GTX 460 plays tag with the HD 5850. This is definitely one of the tests where the HD 5830 stumbles a bit, providing only a small increase in performance over the HD 5770, while the HD 5850 runs off ahead of the group.
The GT200 cards from NVIDIA stage a small comeback in Devil May Cry 4, but are still showing their age. The ASUS EAH5870V2 takes full advantage of an 18% overclock, even at these crazy frame rates, putting up 18% higher frame rates than the 5870 with stock clocks. I love the fact that this benchmark doesn't seem to get bottlenecked by the CPU, even at these crazy high frame rates.

In Scene #4, the N460GTX does the unthinkable; it runs clock-for-clock with the HD 5850. 725 MHz core clock on the GTX 460, and 725 MHz on the 5850 - same FPS. Who would have thought it..?!? Oh, and the GTX 285 is within 1 FPS as well. Well, I know which one is cheaper, anyway. Score another one for the GTX 460.
Our next benchmark of the series is for a very popular FPS game that rivals Crysis for world-class DirectX 10 graphics in a far away land.
|
Graphics Card |
Processor |
Core Clock |
Shader Clock |
Memory Clock |
Memory |
Memory |
| XFX Radeon HD5750 (HD-575X-ZNFC) |
720 |
700 |
N/A |
1150 |
1.0GB GDDR5 |
128-bit |
| ATI Radeon HD5770 (Engineering Sample) |
800 |
850 |
N/A |
1200 |
1.0GB GDDR5 |
128-bit |
| XFX Radeon HD5830 (HD-583X-ZNFV) |
1120 |
800 |
N/A |
1000 |
1.0GB GDDR5 |
256-bit |
|
ASUS GeForce GTX 260 (ENGTX260 MATRIX) |
216 |
576 |
1242 |
999 |
896MB GDDR3 |
448-bit |
| MSI GeForce GTX460 (N460GTX Cyclone 1GD5/OC) |
336 |
725 |
1450 |
900 |
1.0GB GDDR5 |
256-bit |
|
XFX Radeon HD5850 (21162-00-50R) |
1440 |
725 |
N/A |
1000 |
1.0GB GDDR5 |
256-bit |
|
MSI GeForce GTX460-OC (N460GTX Cyclone 1GD5/OC) |
336 |
850 |
1700 |
1050 |
1.0GB GDDR5 |
256-bit |
|
ASUS GeForce GTX 285 (MATRIX GTX285) |
240 |
662 |
1476 |
1242 |
1.0GB GDDR3 |
512-bit |
|
XFX Radeon HD5870 (HD-587X-ZNFC) |
1600 |
850 |
N/A |
1200 |
1.0GB GDDR5 |
256-bit |
|
ASUS Radeon HD5870-OC (EAH5870/2DIS/1GD5/V2) |
1600 |
1000 |
N/A |
1250 |
1.0GB GDDR5 |
256-bit |
Far Cry 2 Benchmark Results
Ubisoft developed Far Cry 2 as a sequel to the original, but with a very different approach to game play and story line. Far Cry 2 features a vast world built on Ubisoft's new game engine called Dunia, meaning "world", "earth" or "living" in Farci. The setting in Far Cry 2 takes place on a fictional Central African landscape, set to a modern day timeline.
The Dunia engine was built specifically for Far Cry 2, by Ubisoft Montreal development team. It delivers realistic semi-destructible environments, special effects such as dynamic fire propagation and storms, real-time night-and-day sun light and moon light cycles, dynamic music system, and non-scripted enemy A.I. actions.
The Dunia game engine takes advantage of multi-core processors as well as multiple processors and supports DirectX 9 as well as DirectX-10. Only 2 or 3 percent of the original CryEngine code is re-used, according to Michiel Verheijdt, Senior Product Manager for Ubisoft Netherlands. Additionally, the engine is less hardware-demanding than CryEngine 2, the engine used in Crysis.
However, it should be noted that Crysis delivers greater character and object texture detail, as well as more destructible elements within the environment. For example; trees breaking into many smaller pieces and buildings breaking down to their component panels. Far Cry 2 also supports the amBX technology from Philips. With the proper hardware, this adds effects like vibrations, ambient colored lights, and fans that generate wind effects.
There is a benchmark tool in the PC version of Far Cry 2, which offers an excellent array of settings for performance testing. Benchmark Reviews used the maximum settings allowed for DirectX-10 tests, with the resolution set to 1920x1200. Performance settings were all set to 'Very High', Render Quality was set to 'Ultra High' overall quality, 8x anti-aliasing was applied. HDR and Bloom are automatically enabled in DX10 mode.

Even on a game that typically favors the Green Machine, the performance of the latest NVIDIA GPU in this test is nothing short of amazing. It's not worth even running the numbers, the advantage is so overwhelming. Using the short 'Ranch Small' time demo (which yields the lowest FPS of the three tests available), many of the midrange products we've tested are capable of producing playable frame rates with the settings all turned up. Now it seems we have a midrange video card that absolutely dominates this game. We also saw a different effect when switching our testing from DX9 to DX10. Far Cry 2 seems to have been optimized, or at least written with a clear understanding of DirectX 10 requirements. This test also generally produces one of the lighter GPU loads (thermal + power) among our benchmarks; the coding appears to be highly optimized.

The higher resolution testing doesn't change the rankings at all, and the N460GTX still produces stellar results. With these kinds of average frame rates, there is less chance of any stutter making it into game play. I was curious to see how well the GTX 460 did on minimum frame rates, given the outstanding performance on average, so here is what I learned:

The minimum frame rate never dropped below 50 FPS, and there was only one sharp dip in the chart, at the 13 second mark. It was probably one of the many explosions, the first one takes place at close range, and has more detail associated with it. I've been glancing at these charts every time I run this benchmark, even though we generally don't report the results, and this is definitely one of the smoother and flatter curves I've seen.
Our next benchmark of the series puts our collection of video cards against some fresh graphics in the recently released Resident Evil 5 benchmark.
|
Graphics Card |
Processor |
Core Clock |
Shader Clock |
Memory Clock |
Memory |
Memory |
| XFX Radeon HD5750 (HD-575X-ZNFC) |
720 |
700 |
N/A |
1150 |
1.0GB GDDR5 |
128-bit |
| ATI Radeon HD5770 (Engineering Sample) |
800 |
850 |
N/A |
1200 |
1.0GB GDDR5 |
128-bit |
| XFX Radeon HD5830 (HD-583X-ZNFV) |
1120 |
800 |
N/A |
1000 |
1.0GB GDDR5 |
256-bit |
|
ASUS GeForce GTX 260 (ENGTX260 MATRIX) |
216 |
576 |
1242 |
999 |
896MB GDDR3 |
448-bit |
| MSI GeForce GTX460 (N460GTX Cyclone 1GD5/OC) |
336 |
725 |
1450 |
900 |
1.0GB GDDR5 |
256-bit |
|
XFX Radeon HD5850 (21162-00-50R) |
1440 |
725 |
N/A |
1000 |
1.0GB GDDR5 |
256-bit |
|
MSI GeForce GTX460-OC (N460GTX Cyclone 1GD5/OC) |
336 |
850 |
1700 |
1050 |
1.0GB GDDR5 |
256-bit |
|
ASUS GeForce GTX 285 (MATRIX GTX285) |
240 |
662 |
1476 |
1242 |
1.0GB GDDR3 |
512-bit |
|
XFX Radeon HD5870 (HD-587X-ZNFC) |
1600 |
850 |
N/A |
1200 |
1.0GB GDDR5 |
256-bit |
|
ASUS Radeon HD5870-OC (EAH5870/2DIS/1GD5/V2) |
1600 |
1000 |
N/A |
1250 |
1.0GB GDDR5 |
256-bit |
Resident Evil 5 Test Results
PC gamers get the ultimate Resident Evil package in this new PC version with exclusive features including NVIDIA's new GeForce3D Vision technology (wireless 3D Vision glasses sold separately), new costumes and a new mercenary mode with more enemies on screen. Delivering an infinite level of detail, realism and control, Resident Evil 5 is certain to bring new fans to the series. Incredible changes to game play and the world of Resident Evil make it a must-have game for gamers across the globe.
Years after surviving the events in Raccoon City, Chris Redfield has been fighting the scourge of bio-organic weapons all over the world. Now a member of the Bio-terrorism Security Assessment Alliance (BSSA), Chris is sent to Africa to investigate a biological agent that is transforming the populace into aggressive and disturbing creatures. New cooperatively-focused game play revolutionizes the way that Resident Evil is played. Chris and Sheva must work together to survive new challenges and fight dangerous hordes of enemies.
From a gaming performance perspective, Resident Evil 5 uses Next Generation of Fear - Ground breaking graphics that utilize an advanced version of Capcom's proprietary game engine, MT Framework, which powered the hit titles Devil May Cry 4, Lost Planet and Dead Rising. The game uses a wider variety of lighting to enhance the challenge. Fear Light as much as Shadow - Lighting effects provide a new level of suspense as players attempt to survive in both harsh sunlight and extreme darkness. As usual, we maxed out the graphics settings on the benchmark version of this popular game, to put the hardware through its paces. Much like Devil May Cry 4, it's relatively easy to get good frame rates in this game, so take the opportunity to turn up all the knobs and maximize the visual experience. The Resident Evil5 benchmark tool provides a graph of continuous frame rates and averages for each of four distinct scenes which take place in different areas of the compound. In addition it calculates an overall average for the four scenes. The averages for scene #3 and #4 are what we report here, as they are the most challenging.

Looking at the results for area #3, it's blatantly obvious that the NVIDIA cards do exceptionally well in this scene. The MSI N460GTX Cyclone achieves the same average frame rate as an HD 5870 at stock settings. Coincidently, that also the same performance level as the GTX 285 puts up. So it's clear, that this is not a fair comparison. If you like this game, all of the GTX cards offer best value in this instance. Plus, all that performance is available at a substantial discount with the new GTX 460. There is quite a bit of variation in the game play between the four areas, so let's see what happens in the next scene, area #4.

In area #4, the 5870 convincingly reclaims its title, and the 5850 comes back to compete with the GTX 460; this looks more like we've seen on the other titles so far. I'm not sure what it is in area #3 that gives the GTX cards such an advantage, but it doesn't last throughout the entire benchmark. In both scenes, the 17% overclock on the GTX 460 returns a comparable gain in performance, consistent with the improvements we've seen in the other benchmarks. Let's keep looking, especially at some new titles that were developed specifically to showcase DX11, and see if there are any more surprises in store for the N460GTX Cyclone.
In our next section, Benchmark Reviews looks at one of the newest and most popular games, Battlefield: Bad Company 2. The game lacks a dedicated benchmarking tool, so we'll be using FRAPS to measure frame rates within portions of the game itself.
|
Graphics Card |
Processor |
Core Clock |
Shader Clock |
Memory Clock |
Memory |
Memory |
| XFX Radeon HD5750 (HD-575X-ZNFC) |
720 |
700 |
N/A |
1150 |
1.0GB GDDR5 |
128-bit |
| ATI Radeon HD5770 (Engineering Sample) |
800 |
850 |
N/A |
1200 |
1.0GB GDDR5 |
128-bit |
| XFX Radeon HD5830 (HD-583X-ZNFV) |
1120 |
800 |
N/A |
1000 |
1.0GB GDDR5 |
256-bit |
|
ASUS GeForce GTX 260 (ENGTX260 MATRIX) |
216 |
576 |
1242 |
999 |
896MB GDDR3 |
448-bit |
| MSI GeForce GTX460 (N460GTX Cyclone 1GD5/OC) |
336 |
725 |
1450 |
900 |
1.0GB GDDR5 |
256-bit |
|
XFX Radeon HD5850 (21162-00-50R) |
1440 |
725 |
N/A |
1000 |
1.0GB GDDR5 |
256-bit |
|
MSI GeForce GTX460-OC (N460GTX Cyclone 1GD5/OC) |
336 |
850 |
1700 |
1050 |
1.0GB GDDR5 |
256-bit |
|
ASUS GeForce GTX 285 (MATRIX GTX285) |
240 |
662 |
1476 |
1242 |
1.0GB GDDR3 |
512-bit |
|
XFX Radeon HD5870 (HD-587X-ZNFC) |
1600 |
850 |
N/A |
1200 |
1.0GB GDDR5 |
256-bit |
|
ASUS Radeon HD5870-OC (EAH5870/2DIS/1GD5/V2) |
1600 |
1000 |
N/A |
1250 |
1.0GB GDDR5 |
256-bit |
Battlefield: Bad Company 2 Test Results
The Battlefield franchise has been known to demand a lot from PC graphics hardware. DICE (Digital Illusions CE) has incorporated their Frostbite-1.5 game engine with Destruction-2.0 feature set with Battlefield: Bad Company 2. Battlefield: Bad Company 2 features destructible environments using Frostbit Destruction-2.0, and adds gravitational bullet drop effects for projectiles shot from weapons at a long distance. The Frostbite-1.5 game engine used on Battlefield: Bad Company 2 consists of DirectX-10 primary graphics, with improved performance and softened dynamic shadows added for DirectX-11 users. At the time Battlefield: Bad Company 2 was published, DICE was also working on the Frostbite-2.0 game engine. This upcoming engine will include native support for DirectX-10.1 and DirectX-11, as well as parallelized processing support for 2-8 parallel threads. This will improve performance for users with an Intel Core-i7 processor.
In our benchmark tests of Battlefield: Bad Company 2, the first three minutes of action in the single-player raft night scene are captured with FRAPS. Relative to the online multiplayer action, these frame rate results are nearly identical to daytime maps with the same video settings.

BF:BC2 shows that DirectX10 need not be the death card for NVIDIA GeForce products; the Frostbite-1.5 game engine is partial to NVIDIA products over ATI, despite AMD's sponsorship of the game. In Battlefield: Bad Company 2, the MSI N460GTX Cyclone bests the ATI Radeon HD 5830 by 19%. Once overclocked to a readily achievable 850 MHz, the N460GTX improves its lead over the HD 5830 to 39%. BTW, I think it's a fair fight comparing the Cypress to the GF104; they both have roughly 2 billon transistors, use the exact same fabrication technology-sourced from the same supplier, and many are running at 800-850 MHz core frequencies here. As always, in the fight between NVIDIA and ATI, it's how each company has chosen to arrange those transistors; they have radically different computing architectures.
I know general purpose computing uses a very small fraction of the power contained in today's average PC, but it does seem that gaming applications are at least trying to push the envelope. Playing this game with the previous generation of graphics cards is a complete waste of time and effort. Some of that is attributable to advances in 3D Graphics APIs (application programming interfaces) like DirectX11, but at some level the game developers have to make decisions about how much detail to include in the scenes, and how realistically to render soft surfaces like skin and water. I know some of the improvements may look minimal or insignificant when perusing the promotional screenshots, but they all add up, in the final result. Bring it on, I say. I'll find some other use for that old HD 4850 graphics card.
In our next section, we are going to switch over to DirectX 11 testing and look at the one of the newest DX11 benchmarks, straight from Russia and the studios of Unigine. Their latest benchmark is called "Heaven", and it has some very interesting and non-typical graphics. So, let's take a peek at what Heaven v2.0 looks like.
|
Graphics Card |
Processor |
Core Clock |
Shader Clock |
Memory Clock |
Memory |
Memory |
| XFX Radeon HD5750 (HD-575X-ZNFC) |
720 |
700 |
N/A |
1150 |
1.0GB GDDR5 |
128-bit |
| ATI Radeon HD5770 (Engineering Sample) |
800 |
850 |
N/A |
1200 |
1.0GB GDDR5 |
128-bit |
| XFX Radeon HD5830 (HD-583X-ZNFV) |
1120 |
800 |
N/A |
1000 |
1.0GB GDDR5 |
256-bit |
|
ASUS GeForce GTX 260 (ENGTX260 MATRIX) |
216 |
576 |
1242 |
999 |
896MB GDDR3 |
448-bit |
| MSI GeForce GTX460 (N460GTX Cyclone 1GD5/OC) |
336 |
725 |
1450 |
900 |
1.0GB GDDR5 |
256-bit |
|
XFX Radeon HD5850 (21162-00-50R) |
1440 |
725 |
N/A |
1000 |
1.0GB GDDR5 |
256-bit |
|
MSI GeForce GTX460-OC (N460GTX Cyclone 1GD5/OC) |
336 |
850 |
1700 |
1050 |
1.0GB GDDR5 |
256-bit |
|
ASUS GeForce GTX 285 (MATRIX GTX285) |
240 |
662 |
1476 |
1242 |
1.0GB GDDR3 |
512-bit |
|
XFX Radeon HD5870 (HD-587X-ZNFC) |
1600 |
850 |
N/A |
1200 |
1.0GB GDDR5 |
256-bit |
|
ASUS Radeon HD5870-OC (EAH5870/2DIS/1GD5/V2) |
1600 |
1000 |
N/A |
1250 |
1.0GB GDDR5 |
256-bit |
Unigine Heaven Benchmark
The Unigine "Heaven 2.0" benchmark is a free, publicly available, tool that grants the power to unleash the graphics capabilities in DirectX-11 for Windows 7 or updated Vista Operating Systems. It reveals the enchanting magic of floating islands with a tiny village hidden in the cloudy skies. With the interactive mode, emerging experience of exploring the intricate world is within reach. Through its advanced renderer, Unigine is one of the first to set precedence in showcasing the art assets with tessellation, bringing compelling visual finesse, utilizing the technology to the full extend and exhibiting the possibilities of enriching 3D gaming.
The distinguishing feature in the Unigine Heaven benchmark is a hardware tessellation that is a scalable technology aimed for automatic subdivision of polygons into smaller and finer pieces, so that developers can gain a more detailed look of their games almost free of charge in terms of performance. Thanks to this procedure, the elaboration of the rendered image finally approaches the boundary of veridical visual perception: the virtual reality transcends conjured by your hand. The "Heaven" benchmark excels at providing the following key features:
- Native support of OpenGL, DirectX 9, DirectX-10 and DirectX-11
- Comprehensive use of tessellation technology
- Advanced SSAO (screen-space ambient occlusion)
- Volumetric cumulonimbus clouds generated by a physically accurate algorithm
- Dynamic simulation of changing environment with high physical fidelity
- Interactive experience with fly/walk-through modes
- ATI Eyefinity support

Starting off with a lighter load of 4x MSAA, we see a steady progression of performance as you move up the ATI 5xxx ladder. Stuck there in the middle of the chart are two results that show a clear distinction between the two competing architectures. Even in the "normal" tessellation mode, this is a graphics test that really shows off the full effect of the new technology. The Fermi architecture has so much more computing power designated and available for tessellation, that it's no small surprise to see the card doing so well here. There is still some jerkiness to the display with all of the cards; now that I've seen the landscape go by for a couple hundred times, I can spot the small stutters more easily. This test was run with 4x anti-aliasing; let's see how the cards stack up when we increase MSAA to the maximum level of 8x.
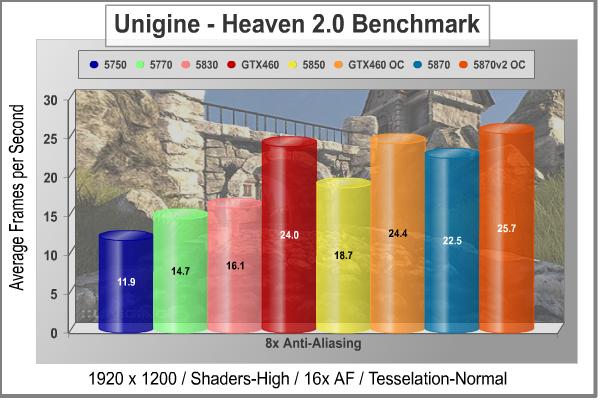
Increasing the anti-aliasing just improved the already convincing performance of the GTX 460, relative to the Radeon HD 5xxx series. It's interesting to note that the HD 5850 doesn't stand out so much with this benchmark; everywhere else, it seems to jump a little higher than its Radeon neighbors. There's no denying that the Fermi chip, in its best interpretation yet: the GF104, is a killer when called upon for tessellation duty.
Let's take a look at one more DX11 benchmark, a decidedly less cheerful scenario in a post-apocalyptic "Zone", which is traversed by mercenary guides called Stalkers.
|
Graphics Card |
Processor |
Core Clock |
Shader Clock |
Memory Clock |
Memory |
Memory |
| XFX Radeon HD5750 (HD-575X-ZNFC) |
720 |
700 |
N/A |
1150 |
1.0GB GDDR5 |
128-bit |
| ATI Radeon HD5770 (Engineering Sample) |
800 |
850 |
N/A |
1200 |
1.0GB GDDR5 |
128-bit |
| XFX Radeon HD5830 (HD-583X-ZNFV) |
1120 |
800 |
N/A |
1000 |
1.0GB GDDR5 |
256-bit |
|
ASUS GeForce GTX 260 (ENGTX260 MATRIX) |
216 |
576 |
1242 |
999 |
896MB GDDR3 |
448-bit |
| MSI GeForce GTX460 (N460GTX Cyclone 1GD5/OC) |
336 |
725 |
1450 |
900 |
1.0GB GDDR5 |
256-bit |
|
XFX Radeon HD5850 (21162-00-50R) |
1440 |
725 |
N/A |
1000 |
1.0GB GDDR5 |
256-bit |
|
MSI GeForce GTX460-OC (N460GTX Cyclone 1GD5/OC) |
336 |
850 |
1700 |
1050 |
1.0GB GDDR5 |
256-bit |
|
ASUS GeForce GTX 285 (MATRIX GTX285) |
240 |
662 |
1476 |
1242 |
1.0GB GDDR3 |
512-bit |
|
XFX Radeon HD5870 (HD-587X-ZNFC) |
1600 |
850 |
N/A |
1200 |
1.0GB GDDR5 |
256-bit |
|
ASUS Radeon HD5870-OC (EAH5870/2DIS/1GD5/V2) |
1600 |
1000 |
N/A |
1250 |
1.0GB GDDR5 |
256-bit |
S.T.A.L.K.E.R.: Call of Pripyat Test Results
The events of S.T.A.L.K.E.R.: Call of Pripyat unfolds shortly after the end of S.T.A.L.K.E.R.: Shadow of Chernobyl. Having discovered about the open path to the Zone center, the government decides to hold a large-scale military "Fairway" operation aimed to take the CNPP under control. According to the operation's plan, the first military group is to conduct an air scouting of the territory to map out the detailed layouts of anomalous fields location. Thereafter, making use of the maps, the main military forces are to be dispatched. Despite thorough preparations, the operation fails. Most of the avant-garde helicopters crash. In order to collect information on reasons behind the operation failure, Ukraine's Security Service sends their agent into the Zone center.
S.T.A.L.K.E.R.: CoP is developed on X-Ray game engine v.1.6, and implements several ambient occlusion (AO) techniques including one that AMD has developed. AMD's AO technique is optimized to run on efficiently on Direct3D11 hardware. It has been chosen by a number of games (e.g. BattleForge, HAWX, and the new Aliens vs. Predator) for the distinct effect in it adds to the final rendered images. This AO technique is called HDAO which stands for ‘High Definition Ambient Occlusion' because it picks up occlusions from fine details in normal maps.

Once we turn on DirectX 11 with S.T.A.L.K.E.R.: CoP, we're left with only the latest GPUs to test with. There's a fairly even step up from one card to the next, similar to what you see in a synthetic benchmark. In this case, the GTX460 doesn't jump to the head of the class like it did with Unigine's heaven 2.0, primarily because there isn't as much emphasis on tessellation here. The primary influence on the graphics seems to be the features introduced in DirectX 10 and 10.1, namely SSAO. In fact, "Shadows" is the first thing that comes to mind when trying to think of words to describe the scenes in this gloomy adventure.
Our next benchmark of the series is not for the faint of heart. Lions and tiger - OK, fine. Guys with guns - I can deal with that. But those nasty little spiders......NOOOOOO! How did I get stuck in the middle of a deadly fight between Aliens vs. Predator anyway? Check out the results from our newest DirectX11 benchmark in the next section.
|
Graphics Card |
Processor |
Core Clock |
Shader Clock |
Memory Clock |
Memory |
Memory |
| XFX Radeon HD5750 (HD-575X-ZNFC) |
720 |
700 |
N/A |
1150 |
1.0GB GDDR5 |
128-bit |
| ATI Radeon HD5770 (Engineering Sample) |
800 |
850 |
N/A |
1200 |
1.0GB GDDR5 |
128-bit |
| XFX Radeon HD5830 (HD-583X-ZNFV) |
1120 |
800 |
N/A |
1000 |
1.0GB GDDR5 |
256-bit |
|
ASUS GeForce GTX 260 (ENGTX260 MATRIX) |
216 |
576 |
1242 |
999 |
896MB GDDR3 |
448-bit |
| MSI GeForce GTX460 (N460GTX Cyclone 1GD5/OC) |
336 |
725 |
1450 |
900 |
1.0GB GDDR5 |
256-bit |
|
XFX Radeon HD5850 (21162-00-50R) |
1440 |
725 |
N/A |
1000 |
1.0GB GDDR5 |
256-bit |
|
MSI GeForce GTX460-OC (N460GTX Cyclone 1GD5/OC) |
336 |
850 |
1700 |
1050 |
1.0GB GDDR5 |
256-bit |
|
ASUS GeForce GTX 285 (MATRIX GTX285) |
240 |
662 |
1476 |
1242 |
1.0GB GDDR3 |
512-bit |
|
XFX Radeon HD5870 (HD-587X-ZNFC) |
1600 |
850 |
N/A |
1200 |
1.0GB GDDR5 |
256-bit |
|
ASUS Radeon HD5870-OC (EAH5870/2DIS/1GD5/V2) |
1600 |
1000 |
N/A |
1250 |
1.0GB GDDR5 |
256-bit |
Aliens Vs. Predator Test Results
Rebellion, SEGA and Twentieth Century FOX have released the Aliens vs. Predator DirectX 11 Benchmark to the public. As with many of the already released DirectX 11 benchmarks, the Aliens vs. Predator DirectX 11 benchmark leverages your DirectX 11 hardware to provide an immersive game play experience through the use of DirectX 11 Tessellation and DirectX 11 Advanced Shadow features.
In Aliens vs. Predator, DirectX 11 Geometry Tessellation is applied in an effective manner to enhance and more accurately depict HR Giger's famous Alien design. Through the use of a variety of adaptive schemes, applying tessellation when and where it is necessary, the perfect blend of performance and visual fidelity is achieved with at most a 4% change in performance.
DirectX 11 hardware also allows for higher quality, smoother and more natural looking shadows as well. DirectX 11 Advanced Shadows allow for the rendering of high-quality shadows, with smoother, artifact-free penumbra regions, which otherwise could not be realized, again providing for a higher quality, more immersive gaming experience.
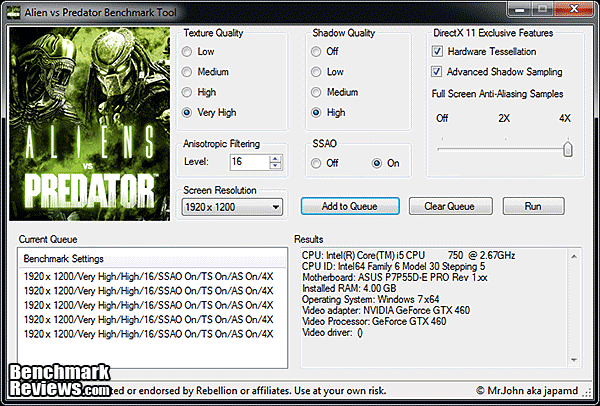
Benchmark Reviews is committed to pushing the PC graphics envelope, and whenever possible we configure benchmark software to its maximum settings for our tests. In the case of Aliens vs. Predator, all cards were tested with the following settings: Texture Quality-Very High, Shadow Quality-High, HW Tessellation & Advanced Shadow Sampling-ON, Multi Sample Anti-Aliasing-4x, Anisotropic Filtering-16x, Screen Space Ambient Occlusion (SSAO)-ON. You will see that this is a challenging benchmark, with all the settings turned up and a screen resolution of 1920 x 1200, as only the HD5870 cards achieved an average frame rate of 30FPS.
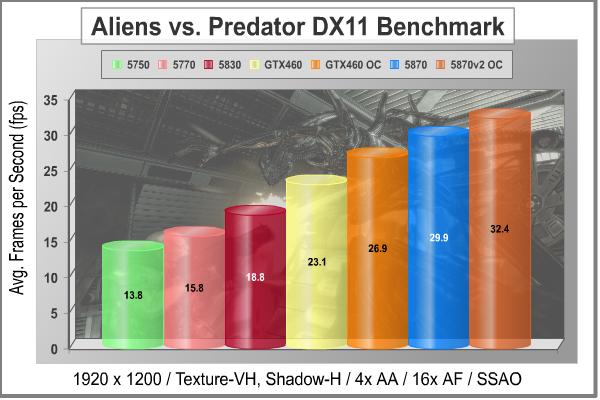
This is truly a DirectX11 only benchmark, so we're limited to looking at only the latest generation cards that I had available. This is clearly a tough benchmark, and it's very useful for testing the latest and greatest graphics hardware. The stock ATI HD 5870, with a core clock of 850 MHz, just barely reached 30 FPS as an average frame rate. Using anything less than the top hardware, some scenes had a jumpy quality to them. The overclocked N460GTX got the closest, in terms of smooth video quality, with an average frame rate of 27 FPS. Once again, the GTX 460 put the hurt on the HD 5830, piling up some real pressure on the existing cards in this price sector.
In our next section, we investigate the thermal performance of the MSI N460GTX Cyclone, and see how well MSI's Cyclone cooler works on the latest Fermi offering.
|
Graphics Card |
Processor |
Core Clock |
Shader Clock |
Memory Clock |
Memory |
Memory |
| XFX Radeon HD5750 (HD-575X-ZNFC) |
720 |
700 |
N/A |
1150 |
1.0GB GDDR5 |
128-bit |
| ATI Radeon HD5770 (Engineering Sample) |
800 |
850 |
N/A |
1200 |
1.0GB GDDR5 |
128-bit |
| XFX Radeon HD5830 (HD-583X-ZNFV) |
1120 |
800 |
N/A |
1000 |
1.0GB GDDR5 |
256-bit |
|
ASUS GeForce GTX 260 (ENGTX260 MATRIX) |
216 |
576 |
1242 |
999 |
896MB GDDR3 |
448-bit |
| MSI GeForce GTX460 (N460GTX Cyclone 1GD5/OC) |
336 |
725 |
1450 |
900 |
1.0GB GDDR5 |
256-bit |
|
XFX Radeon HD5850 (21162-00-50R) |
1440 |
725 |
N/A |
1000 |
1.0GB GDDR5 |
256-bit |
|
MSI GeForce GTX460-OC (N460GTX Cyclone 1GD5/OC) |
336 |
850 |
1700 |
1050 |
1.0GB GDDR5 |
256-bit |
|
ASUS GeForce GTX 285 (MATRIX GTX285) |
240 |
662 |
1476 |
1242 |
1.0GB GDDR3 |
512-bit |
|
XFX Radeon HD5870 (HD-587X-ZNFC) |
1600 |
850 |
N/A |
1200 |
1.0GB GDDR5 |
256-bit |
|
ASUS Radeon HD5870-OC (EAH5870/2DIS/1GD5/V2) |
1600 |
1000 |
N/A |
1250 |
1.0GB GDDR5 |
256-bit |
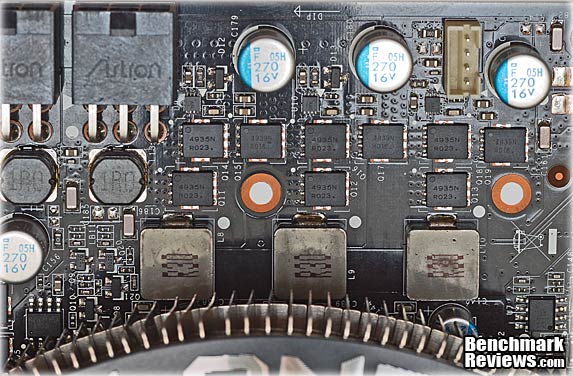
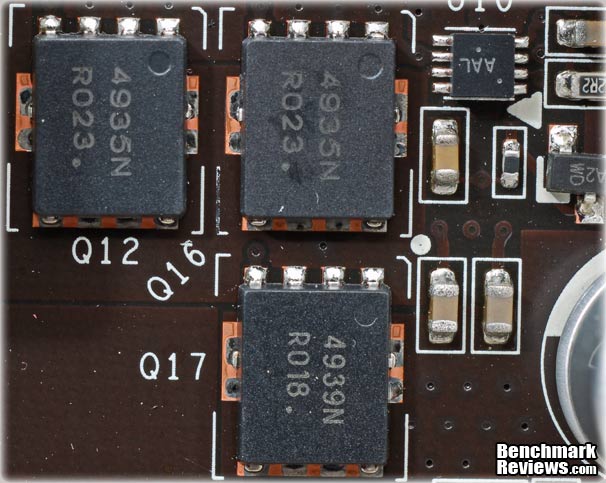
MSI N460GTX Cyclone Temperatures
It's hard to know exactly when the first video card got overclocked, and by whom. What we do know is that it's hard to imagine a computer enthusiast or gamer today that doesn't overclock their hardware. Of course, not every video card has the head room. Some products run so hot that they can't suffer any higher temperatures than they generate straight from the factory. This is why we measure the operating temperature of the video card products we test.
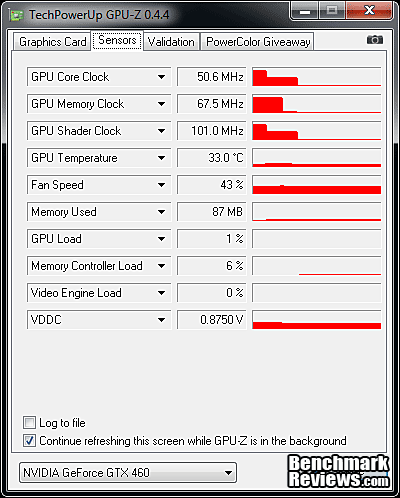
To begin testing, I use GPU-Z to measure the temperature at idle as reported by the GPU. Next I use FurMark 1.8.2 to generate maximum thermal load and record GPU temperatures at high-power 3D mode. The ambient room temperature remained stable at a very high 29C throughout testing. I know this is much higher than the average American household, but we had a massive heat wave this summer and my testing is done in an upstairs room that doesn't get as much of the central A/C as I would like... Besides, I know some of you are not living in iceboxes and would be interested in how well the GTX 460 handles high ambient temps. I do have a ton of airflow into the video card section of my benchmarking case, with a 200mm side fan blowing directly inward, so that helps alleviate the high ambient temps.
The MSI N460GTX Cyclone 1GD5/OC video card recorded 33C in idle 2D mode, and increased to 60C after 20 minutes of stability testing in full 3D mode, at 1920x1200 resolution, and the maximum MSAA setting of 8X. With the fan set on Automatic, the speed rose from 40% at idle to 70% under full load. Before we talk about the temps under load, it's worth it to pay notice to the idle temperatures. I have never seen idle temps this low above ambient, but if you follow along into the next section on power consumption, I think you'll see the explanation.
|
Load |
Fan Speed |
GPU Temperature |
|
Idle |
40% - AUTO |
33C |
|
Furmark |
70% - AUTO |
60C |
60C is an excellent result for temperature stress testing, especially with such a powerful GPU, stock fan settings, a high ambient of 29C, and fan speeds controlled by the card. I'm used to seeing video card manufacturers keeping the fan speeds low and letting GPU temps get into higher temperature regions than this. I applaud MSI for keeping the fan speeds up and the temps low with their stock automatic fan settings. I rarely do my benchmarking tests with fans set on Automatic, preferring to give the GPU or CPU the best shot at surviving the day intact. With an integrated temperature controller in play though, I want to show how the manufacturer has programmed the system. This is one of the few video cards where I like the manufacturer's settings, right out of the box.
Load temps never got higher than 57C when running continuous gaming benchmarks with automatic fan speeds, so the cooling system definitely does the job, and there is a lot of temperature headroom left for the GPU. The noise at 100% speed was much lower than some other products I've tested recently that had squirrel cage blowers. For me, this type of fan noise is less irritating than what a radial fan produces, but I still prefer a design that pushes all the heated air out the back of the case. For normal usage patterns including gaming, I'd leave the fan settings on Auto. For benchmarking, it's worth it to put up with a little more noise, and drive the fan at 100%.
FurMark is an OpenGL benchmark that heavily stresses and overheats the graphics card with fur rendering. The benchmark offers several options allowing the user to tweak the rendering: fullscreen / windowed mode, MSAA selection, window size, duration. The benchmark also includes a GPU Burner mode (stability test). FurMark requires an OpenGL 2.0 compliant graphics card with lot of GPU power!

FurMark does do two things extremely well: drive the thermal output of any graphics processor higher than any other application or video game, and it does so with consistency every time. While FurMark is not a true benchmark tool for comparing different video cards, it still works well to compare one product against itself using different drivers or clock speeds, or testing the stability of a GPU, as it raises the temperatures higher than any program. But in the end, it's a rather limited tool.
In our next section, we discuss electrical power consumption and learn how well (or poorly) each video card will impact your utility bill...
VGA Power Consumption
Life is not as affordable as it used to be, and items such as gasoline, natural gas, and electricity all top the list of resources which have exploded in price over the past few years. Add to this the limit of non-renewable resources compared to current demands, and you can see that the prices are only going to get worse. Planet Earth is needs our help, and needs it badly. With forests becoming barren of vegetation and snow capped poles quickly turning brown, the technology industry has a new attitude towards turning "green". I'll spare you the powerful marketing hype that gets sent from various manufacturers every day, and get right to the point: your computer hasn't been doing much to help save energy... at least up until now. Take a look at the idle clock rates NVIDIA programmed into the BIOS for this GPU. Yes, that's two digits for core and memory clocks, right out of the box; no special power-saving software utilities required.
To measure isolated video card power consumption, I used the Kill-A-Watt EZ (model P4460) power meter made by P3 International. A baseline test is taken without a video card installed inside our computer system, which is allowed to boot into Windows and rest idle at the login screen before power consumption is recorded. Once the baseline reading has been taken, the graphics card is installed and the system is again booted into Windows and left idle at the login screen. Our final loaded power consumption reading is taken with the video card running a stress test using FurMark. Below is a chart with the isolated video card power consumption (not system total) displayed in Watts for each specified test product:
VGA Product Description(sorted by combined total power) |
Idle Power |
Loaded Power |
|---|---|---|
NVIDIA GeForce GTX 480 SLI Set |
82 W |
655 W |
NVIDIA GeForce GTX 590 Reference Design |
53 W |
396 W |
ATI Radeon HD 4870 X2 Reference Design |
100 W |
320 W |
AMD Radeon HD 6990 Reference Design |
46 W |
350 W |
NVIDIA GeForce GTX 295 Reference Design |
74 W |
302 W |
ASUS GeForce GTX 480 Reference Design |
39 W |
315 W |
ATI Radeon HD 5970 Reference Design |
48 W |
299 W |
NVIDIA GeForce GTX 690 Reference Design |
25 W |
321 W |
ATI Radeon HD 4850 CrossFireX Set |
123 W |
210 W |
ATI Radeon HD 4890 Reference Design |
65 W |
268 W |
AMD Radeon HD 7970 Reference Design |
21 W |
311 W |
NVIDIA GeForce GTX 470 Reference Design |
42 W |
278 W |
NVIDIA GeForce GTX 580 Reference Design |
31 W |
246 W |
NVIDIA GeForce GTX 570 Reference Design |
31 W |
241 W |
ATI Radeon HD 5870 Reference Design |
25 W |
240 W |
ATI Radeon HD 6970 Reference Design |
24 W |
233 W |
NVIDIA GeForce GTX 465 Reference Design |
36 W |
219 W |
NVIDIA GeForce GTX 680 Reference Design |
14 W |
243 W |
Sapphire Radeon HD 4850 X2 11139-00-40R |
73 W |
180 W |
NVIDIA GeForce 9800 GX2 Reference Design |
85 W |
186 W |
NVIDIA GeForce GTX 780 Reference Design |
10 W |
275 W |
NVIDIA GeForce GTX 770 Reference Design |
9 W |
256 W |
NVIDIA GeForce GTX 280 Reference Design |
35 W |
225 W |
NVIDIA GeForce GTX 260 (216) Reference Design |
42 W |
203 W |
ATI Radeon HD 4870 Reference Design |
58 W |
166 W |
NVIDIA GeForce GTX 560 Ti Reference Design |
17 W |
199 W |
NVIDIA GeForce GTX 460 Reference Design |
18 W |
167 W |
AMD Radeon HD 6870 Reference Design |
20 W |
162 W |
NVIDIA GeForce GTX 670 Reference Design |
14 W |
167 W |
ATI Radeon HD 5850 Reference Design |
24 W |
157 W |
NVIDIA GeForce GTX 650 Ti BOOST Reference Design |
8 W |
164 W |
AMD Radeon HD 6850 Reference Design |
20 W |
139 W |
NVIDIA GeForce 8800 GT Reference Design |
31 W |
133 W |
ATI Radeon HD 4770 RV740 GDDR5 Reference Design |
37 W |
120 W |
ATI Radeon HD 5770 Reference Design |
16 W |
122 W |
NVIDIA GeForce GTS 450 Reference Design |
22 W |
115 W |
NVIDIA GeForce GTX 650 Ti Reference Design |
12 W |
112 W |
ATI Radeon HD 4670 Reference Design |
9 W |
70 W |
The MSI N460GTX Cyclone 1GD5/OC pulled just 18 (140-122) watts at idle and 180 (304-122) watts when running full out, using the test method outlined above. So, there's good news for those who were frightened off by the GF100 power consumption. The GF104 is much more frugal, especially in idle, where the device driver runs the clocks WAY down, without any apparent ill effects. Built on 40nm technology, those two billion transistors could be pulling a lot more power and generating a lot more heat with older chip technology, exactly like the GT200 cards built with 55nm chips did. Next, I'll offer you some final thoughts, and my conclusions. On to the next page...
GTX 460 Final Thoughts
I wrote earlier this year that the first Fermi cards from NVIDIA were not really "Competitors" for ATI, because they occupied different price and market segments than the existing series of Radeon HD 5xxx video cards. Well all that's changed now, with the introduction of the GF104 GPU. With 1.95 billion transistors and an estimated die size of 366 mm2, it's in the same league as the ATI Cypress chip, introduced last September on the Radeon HD 5870. On second thought, maybe NVIDIA is in the National League and ATI is in the American League. They both play the same game, but by different rules, and once a year everyone gets together and pretends that they are all the same. Then it's Football season, thank goodness.
If I allow myself to anthropomorphize these products, I thought it was a bit cruel for the GF104 to go gunning for the HD 5830, the crippled sister of the Radeon family. As fate would have it, she held on to the $200-$240 market with only a hope and a prayer by her side. There was no better point for NVIDIA to attack, with a product more clearly focused on gaming graphics, than this thinly populated market segment. Resistance was futile; there was no way the GTX 460 was going to lose this battle. That's because the GTX 460 is a wolf in sheep's clothing. To put it more plainly, and give away my conclusion to those who are reading this entire page, the GTX 460 is a 5850-class video card with a $230 price tag.
From a technology standpoint, the GTX 460 has a whole lot more in common with the Radeon HD 5850 than it does with the HD 5830. Let's compare. The HD 5850 disables one out of ten (10%) possible stream processing units, the HD 5830 disables three out of every ten (30%). The GTX 460 ships with one out of eight possible Streaming Multiprocessor blocks (12.5%) disabled. Match ‘em up.... looks like a 5850 to me. Now let's look at clock rates, the top clock rate that ATI specs out for the Cypress line is 850 MHz, and the HD 5850 ships with a 725 MHz stock clock. It's too early to guess what the highest clock will be on the GF104 chip, but Galaxy and Palit are already shipping cards with factory core clocks over 800 MHz. Almost every reviewer that bothered to overclock their GTX 460 sample got it easily up to the 850 range. The base clock for the GTX 460 is 675 MHz. Once again, the similarity to the HD 5850 is pretty plain; chop off one (presumably dead) processing cluster and downclock the core significantly, so it doesn't compete with the top model (or the lame duck GTX 465 in this case...).
Forgive me for dabbling in a bit of fairy tale economics, but I can't help myself. First of all, I'm going to make a bold assumption that an HD 5830 chip costs exactly the same amount of money to produce as an HD 5870 or HD 5850. Same amount of silicon, same pin out, same package, same testing costs - all the production costs are equal. Next, I'll extend the same bold assumption and conclude that every GF104 chip costs almost exactly the same as the Cypress chips I just mentioned. Same number of transistors, same technology node, same supplier, same production lines, same die area, etc. The only difference is the R&D and SG&A costs that have to get amortized in to establish a fully burdened cost. (I wish I could add a survey button here: agree or disagree.) The pricing model on the other hand, has you paying for performance, which seems realistic and fair for the consumer. That's where NVIDIA chose their battleground.

I've come to one inescapable conclusion: the GTX 460 is really comparable to an HD 5850 from a technology standpoint, and NVIDIA chose to sell it at a price point currently occupied by a lesser model, the HD 5830. Sounds like a good marketing plan to me, especially since I believe that every Cypress-based card and every GF104-based card share the same cost structure. Sure, you can add or subtract features, but the fundamental production costs are comparable, even if the performance is not. ATI has had a monopoly on DX11 hardware for what seems like ages, so you can't blame NVIDIA for throwing a spanner in the works and trying to disrupt the market. Finally, I can say, "Fermi = Competition". BTW, just like you, I can't wait to read the next chapter in this continuing battle saga.
MSI N460GTX Cyclone 1GD5/OC Conclusion
From a performance standpoint, it's impossible to argue with the numbers this card puts up, at its price point. As I hypothesized in my Final Thoughts, this is really a 5850-class card from a technology standpoint, and it performed like one. Overclocked up to what seems like its natural operating point, at 850 MHz on the core, it swept the field in its market segment. The cooling performance was first rate, including the noise required to achieve it, which was quite low. This is also one of the few cards where I would leave the fan settings on factory automatic; the default curve is aimed at performance users. The combination of a new low-power Fermi GPU, a well designed, oversized cooler, and a performance oriented fan profile kept operating temperatures quite low during both intensive gaming and brutal stress testing.
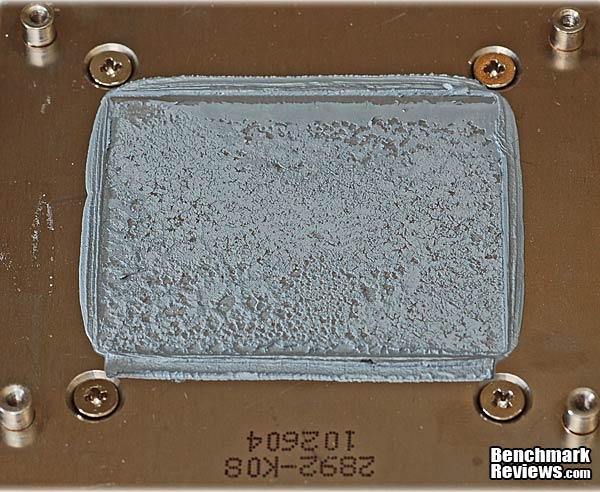
The appearance of the MSI N460GTX Cyclone video card is excellent in my opinion, and also somewhat unique. That's always a plus in my book; I hate the same-old, same-old. The larger fan works well even without a full shroud to direct the airflow. While not a subtle design, the Cyclone avoids the garish themes that often show up on products marketed at gamers.

The build quality of the MSI Cyclone card was excellent. Everything is assembled well, the overall impression of the card was solid, and the packaging was also first rate. I was also impressed by the manufacturing quality of the PC board, especially compared to some recent samples I've seen. The nickel plating on the cooler components doesn't help the thermal performance in the short term, but it eliminates corrosion which would eventually take its toll in the long run. The GTX 460 is a relatively easy card to make because of its simplicity, and MSI chose to execute a simple design, well. Good choice, IMHO. I also have to give very high marks to MSI for the quality of their monitoring and control software, MSI Afterburner. It is one of the leading utilities in the enthusiast community for good reason, in that it is full featured, has an unusually wide application base, can be customized for individual cards, has very strong factory support, and is reliable. It has very few real competitors.
The features of the N460GTX are fully comparable with the latest offerings from both camps. It has: Microsoft DirectX 11 Support, PhysX Technology, is 3D Vision Ready, also 3D Vision Surround Ready, CUDA Technology, SLI, 32x Anti-aliasing, PureVideo HD, and HDMI 1.4a support. We've been using some of these same, or competitive, technologies on a whole host of Radeon 5xxx cards since last September. Still, it's good to finally have rough parity in the features and functions arena.
As of August 2010, the price for the MSI N460GTX CYCLONE 1GD5/OC is $234.99 at my favorite PC component supplier, Newegg. This is a little bit higher than the lowest price GTX 460 boards, the lower spec cards are going for just under $200. It's hard to find a bad deal for any of the GTX 460 cards; even if you are paying a premium for certain features, more memory, or a software bundle, the price-to-performance ratio is so good, there's not a lot of downside anywhere. For people who are interested in exploring the overclocking potential of the GF104 chip, the "extra" $15 or so that these Cyclone models go for is a good investment.
Let's face it, almost any GTX 460 card is going to get high marks at this stage of the game. NVIDIA has priced it very aggressively, and until ATI responds with some serious price cuts, or releases its next generation of video cards, this is the card to beat in the $200-$250 price range. It's pretty obvious from all the reporting that has been done already, that early production units of the GF104 have tons of overclocking headroom. I got +25% on the core clock with no trouble at all, and that seems to be a typical result if you read through the enthusiast forums. MSI has leveraged that capability by providing better cooling, and one of the best software overclocking utilities on the market. While it's not a full-on assault on the top performance crown, it's hard to argue with a product that's (better) X (better) X (better). Highly recommended.
Pros:
+ Attractive and effective cooling system
+ World-class monitoring and control software
+ Excellent overclocking headroom
+ Outstanding price/performance ratio
+ 1000 MHz Samsung GDDR5 overclocks better than 1250 MHz parts
+ Very low idle clocks = low power consumption
+ Low fan noise, even with performance fan profile
+ Memory ICs are cooled by airflow from fan
+ PCB manufacturing quality looks good
+ Driver updates with improved performance were ready at launch
Cons:
- Military Class Components = Mostly Marketing Speak
- All heat from the card is pushed into the case interior
- Mini HDMI connector offers no benefit over standard size
Ratings:
- Performance: 9.50
- Appearance: 9.25
- Construction: 9.25
- Functionality: 9.00
- Value: 9.50
Final Score: 9.3 out of 10.
Excellence Achievement: Benchmark Reviews Golden Tachometer Award.
Questions? Comments? Benchmark Reviews really wants your feedback. We invite you to leave your remarks in our Discussion Forum.
Related Articles:
- NETGEAR ProSafe GS110T Gigabit SmartSwitch
- Mtron MOBI 3000 2.5-Inch 16GB SSD MSD-SATA3025
- QNAP TS-409 Pro 4-Drive SATA Gigabit NAS
- Intel SSD 320 Series Solid State Drive
- QNAP TS-879U-RP NAS Network Storage Rack Server
- SteelSeries 4HD Gaming Surface Mouse Pad
- Rosewill Wireless-N WiFi Adapter RNX-N180UBE
- 2500MHz Patriot Viper-II Sector-5 DDR3 Kit
- Thermaltake Frio OCK CPU Cooler CLP0575
- Acer Iconia 6120 Dual-Screen Laptop

Comments
Whoops.
I consider myself now a little more educated from your remarks, thanks ;)
Olin know what I mean to ask
Seriously, you don't want to get into a discussion of air cooled vs. watercooled Porsches, do you? That's just begging for an invasion of the body-snatchers! Don't you think the comment section has suffered enough lately?
(Sorry for my english level)
I am French so the support service is not a problem (usually)
to help me to decide I would like to know wich graphic card has the cooling system more efficient and wich one has the best resistance to a higher overclocking. And to finish wich one do you prefer ^^
Thanks in advance
thank you for your help =)
Oh, and I like your writing (style).