| Intel DX79SI LGA2011 Desktop Motherboard |
| Reviews - Featured Reviews: Motherboards | |||||||||||||||||||||||||||||||||||||||||||||||||||||||
| Written by David Ramsey | |||||||||||||||||||||||||||||||||||||||||||||||||||||||
| Monday, 14 November 2011 | |||||||||||||||||||||||||||||||||||||||||||||||||||||||
Intel DX79SI LGA2011 Motherboard Review
Manufacturer: Intel Corporation Full Disclosure: The product sample used in this article has been provided by Intel Corporation. It's that time again: a new Intel processor line, along with the requisite new chipset and new motherboards. Intel's "Sandy Bridge Extreme" line of processors requires the massive new LGA2011 socket, which in turn is supported by the new X79 chipset. Intel provided a prototype of their top-end DX79SI motherboard with a Core i7-3960X Sandy Bridge E processor for us to test, and Benchmark Reviews will put it through its paces in this review. Intel's LGA1155 Sandy Bridge processors already set new standards in price/performance; in fact, the top-end Core i7-2600K and 2700K CPUs already challenge the X58-based Core i7-980X and 990X in many benchmarks. Really, how much better could the Sandy Bridge Extreme be? Considering that you have to buy a new motherboard to use it and more memory to get the most out of it, it had better be pretty good!
Intel has not previously been known for its enthusiast motherboards, which often lacked features and performance when compared with the best third party boards. They're actively working to change this perception, and the DX79SI is their latest salvo. Let's take a look at its features and performance! Intel DX79SI SpecificationsSpecifications supplied by Intel.
This is the first motherboard Benchmark Reviews has seen that officially supports the new PCI Express 3.0 standard. The new standard offers significantly improved bandwidth and is backwards-compatible with the 2.0 standard we've used for many years, which is a good thing as there are currently no PCI-E 3.0 cards available that I know of! Let's take a look at the new X79 Express chipset in the next section. The Intel X79 Express ChipsetLGA2011 processors, like the Sandy Bridge Extreme series shown above, require the new X79 Express chipset. If you look at the block diagrams of the Z68 and X79 chipsets side by side, the X79 seems functionally identical to the Z68, except that it lacks the digital display support and Intel Smart Response Technology. The lack of the latter is disappointing, since our tests with Intel Smart Response Technology showed that its use of an SSD as an intelligent cache to a hard drive could dramatically improve storage performance. Perhaps to make up for this, the X79 does permit overclocking via raising the base clock (BCLK) frequency, something that's almost impossible on the previous Sandy Bridge chipsets since most of the other clocks on the board were derived from the base clock, and raising it more than a few MHz would make the entire board unstable.
Intel provides this handy block diagram of an LGA2011-based system with an X79 Express chipset: 
As with the Z68 and earlier P67 chipsets, there are 14 USB 2.0 ports and 6 SATA ports, of which only two are SATA 6G. Notably missing is Intel's "Light Peak" (aka "Thunderbolt") interface, which Intel has touted as a reason for not supporting SuperSpeed USB 3.0. And it's really odd that only two of the SATA ports are SATA 6G, since 6G devices are becoming more common, especially among SSDs. For a cutting-edge platform, this is impossible to justify. At least AMD gives you a full six SATA 6G ports. One nice thing is the abundance of PCI-E lanes, an area Intel has historically been a little skimpy on, especially on their LGA1155/1156 platforms. The Sandy Bridge E provides a full 40 PCI-E lanes from the processor, more than twice the 16 lanes of an LGA1155 Sandy Bridge CPU, and an additional eight lanes from the X79 chipset...the same as from the P67/Z68 chipsets. Together, that's a full 48 PCI-E lanes, besting even AMD's 42. Triple-card SLI/CrossFireX systems will run at 16/16/8 with eight lanes left over for SATA 6 and USB 3.0 use. So the X79's a mixed bag: only two SATA 6G ports and no USB 3.0 or Thunderbolt, but plenty of PCI-E lanes. Closer Look: Intel DX79SI MotherboardIntel wants you to know they're serious about this whole "enthusiast motherboard" thing, and as we all know, nothing says "serious" like a giant skull.
Since this motherboard is a prototype, there's no manual or standard accessories package (although Intel did include a back port cover and two and three-card SLI bridges). Like all X79 motherboards (so far, anyway), Intel splits the DIMM sockets on either side of the processor socket, presumably because the number of traces required for quad-channel memory operation would make putting all the sockets on one side too complex. With eight DIMM slots, each capable of handling an 8GB DIMM, you could put 64GB of RAM on this motherboard! The blue and black DIMM sockets each define a quad-channel memory bank. DIMMs on either side of the CPU socket will make fitting performance air coolers difficult unless you use low profile memory.
You have to see the LGA2011 socket in person to appreciate how large it is. The pin spacing remains about the same as it was on the LGA1155 sockets, so with almost twice as many pins, the LGA2011 socket occupies almost twice the board area. Note that there are now two locking levers, which must be opened or closed in the correct sequence.
The back I/O panel is refreshingly legacy-free, without even a single combo PS/2 port. From left to right we see the "Back to BIOS" recovery button, two USB 3.0 ports, three dual USB 2.0 port connectors topped by Ethernet, FireWire (IEEE 1394), and another Ethernet port, and finally the audio ports with an optical output.
The large CPU socket and 8 DIMM slots have crowded some components to unusual locations. The EPS 12V socket, just to the right of the middle bottom of this image, gets squeezed to the very outside edge of the motherboard, and the position of the bright red CPU fan header at the lower right of this image means that your cooling fan connector might have to be routed over the tops of the rear DIMMs.
The giant socket and eight DIMM slots leave little room for the elaborate multi-phase CPU power systems we've come to expect on high-end X58 motherboards. The DX79SI's voltage regulators are split on either side of the CPU socket (above and below it in this photo). Intel didn't provide any specification on the CPU power supply circuitry (number of phases, etc.) Let's take a closer look at this board in the next section. DX79SI Detailed FeaturesIntel equips this board with some enthusiast features: in addition to Start and Reset buttons, there are diagnostic LEDs that light up in sequence as the POST progresses, a drive activity LED, and a standby LED that blinks when the system's asleep. There's also a separate POST code display, although without a manual or the POST code quick reference card that will come with the retail package, we can't discern the meaning of the codes displayed. The position of the POST code display means it will be blocked by a card in either of the last two PCI-E slots. In addition to the pretty LEDs, buttons, and POST code display, also note the yellow front panel audio connector, the red auxiliary fan connector (there are only four fan connectors on the board, but they're all bright red and PWM-capable), the blue internal FireWire header, and the front panel connector block.
Continuing along the edge of the board, we see the white consumer IR receive connector, the light blue USB 3.0 internal header, the white consumer IR transmit header, and last four black dual-USB 2.0 headers. Just above the USB 3.0 internal header, you can see the square black Renesas 720200 USB 3.0 controller.
Intel skimps a little on the SATA connectors, with only six where many enthusiast motherboards supply eight, albeit with the help of third party SATA controllers (there is a blank space about an inch to the left of the last SATA ports labeled "SATA 6-9", so perhaps a future board will add a couple more ports here). The two blue connectors are the SATA 6 ports, and right next to them is another bright red fan header. (If I keep harping on the color, it's because it can really be quite hard to find black fan headers in a dark computer case!)
The slot layout is fairly standard, with three PCI-E x16 slots, two PCI-E x1 slots, and a single PCI slot for whatever legacy card you might have laying around. I personally prefer that the first two PCI-E x16 slots be separated by two positions rather than just one to allow a little breathing room between two double-slot graphics cards. Of course you can always put your second video card in the third PCI-E slot, where it will block the POST display, but at least there's enough space so that even a double-width card in this slot won't occlude the buttons and headers at the edge of the board. Note the round beeper module above and between slots 4 and 5 (counting from the right). Since cases no longer include speakers, it's nice to have one on the board for beep codes.
The DX79SI's beta UEFI BIOS is entirely textual, which while functional enough looks primitive next to the graphical, mouse-driven BIOSs of the competition. This screen shot from the Performance section shows some interesting new settings such as ampere and watts settings for the CPU power consumption under sustained and burst modes. If the values here look absurdly high (a kilowatt for burst mode power?), rest assured they're taken directly from Intel's "DX79SI Extreme 4.9GHz Recipe" in the reviewer's guide for this motherboard. Sadly I wasn't able to achieve any significant overclock, even with these settings, probably due to the beta nature of the BIOS. 
OK, let's start running some actual tests. Motherboard Testing MethodologyIt's always interesting for us here at Benchmark Reviews to test a new processor/chipset combination, because normally we have no idea what to expect! The marketing and advertising press materials Intel included with this processor and motherboard promise unprecedented levels of performance...can these new parts really deliver? I admit my hopes are high: the original Sandy Bridge processors raised the performance bar considerably, and their new 32nm fabrication process allowed amazing overclocks with relatively low voltages and heat production. The enthusiast chip adds two more cores, nearly double the cache, and drops the relatively unused integrated GPU. Intel's DX79SI motherboard includes what Intel calls an "Overclocking Assistant": you turn it on, select the clock speed you want from a pop-up menu, and the motherboard adjusts the "detailed settings" such as memory speed, voltage, and multiplier for you, which you can then use as a base for hand-tweaked improvements. But just as with the last Intel motherboard I tested, the DX79SI was saddled with a "Beta" BIOS, and I wasn't able to achieve any significant overclocks (I don't consider a 200MHz overclock to be worth running a suite of benchmarks on). A newer BIOS is not available as of the time of this writing, but I'm sure the overclocking ability of the board will improve dramatically when a final BIOS becomes available. To see how this processor/chipset performs against the best AMD offers and Intel's previous top-of-the-line setups, I included the systems listed below. Each test system used the same hard drive, memory (with the exception of the AMD system), and graphics card. Intel X58 Test Platform
Intel P67 Test Platform
AMD 990FX Test Platform
Intel X79 Express Test Platform
Benchmark Applications
AIDA64 Extreme Edition TestsAIDA64 Extreme Edition is the evolution of Lavalys' "Everest Ultimate Edition". Hungarian developer FinalWire acquired the rights to Everest in late November 2010, and renamed the product "AIDA64". The Everest product was discontinued and FinalWire is offering 1-year license keys to those with active Everest keys. AIDA64 is a full 64-bit benchmark and test suite utilizing MMX, 3DNow! and SSE instruction set extensions, and will scale up to 32 processor cores. An enhanced 64-bit System Stability Test module is also available to stress the whole system to its limits. For legacy processors all benchmarks and the System Stability Test are available in 32-bit versions as well. Additionally, AIDA64 adds new hardware to its database, including 300 solid-state drives. On top of the usual ATA auto-detect information the new SSD database enables AIDA64 to display flash memory type, controller model, physical dimensions, and data transfer performance data. AIDA64 v1.00 also implements SSD-specific SMART disk health information for Indilinx, Intel, JMicron, Samsung, and SandForce controllers. All of the benchmarks used in this test- Queen, Photoworxx, ZLib, hash, and AES- rely on basic x86 instructions, and consume very little system memory while also being aware of Hyper-Threading, multi-processors, and multi-core processors. Of all the tests in this review, AIDA64 is the one that best isolates the processor's performance from the rest of the system. While this is useful in that it more directly compares processor performance, readers should remember that virtually no "real world" programs will mirror these results. 
The Queen and Photoworxx tests are synthetic benchmarks that iterate the function many times and over-exaggerate what the real-world performance would be like. The Queen benchmark focuses on the branch prediction capabilities and misprediction penalties of the CPU. It does this by finding possible solutions to the classic queen problem on a chessboard. At the same clock speed theoretically the processor with the shorter pipeline and smaller misprediction penalties will attain higher benchmark scores. Like the Queen benchmark, the Photoworxx tests for penalties against pipeline architecture. The synthetic Photoworxx benchmark stresses the integer arithmetic and multiplication execution units of the CPU and also the memory subsystem. Due to the fact that this test performs high memory read/write traffic, it cannot effectively scale in situations where more than two processing threads are used, so quad-core processors with Hyper-Threading have no real advantage. The AIDIA64 Photoworxx benchmark performs the following tasks on a very large RGB image:
In the Queen test, we see a fairly linear scaling as we move up the processor line. However, the 3960X leaps dramatically ahead of the rest of the field in the Photoworxx test, scoring almost 60% better than the second-place Core i7-2600K, perhaps due to its improved memory bandwidth. 
In the ZLib test, there's more difference than the appearance of the bars might indicate (they're scaled down due to the adjacent Hash scores). The 3960X scores 27% better than the second-place Core i7-980X. The AMD FX-8150 turns in a surprisingly good performance in the Hash test, though, beating every Intel processor except the Sandy Bridge Extreme, which narrowly edges it out. Intel's Clarksdale and subsequent CPUs have dominated the AES test due to their Advanced Encryption Standard New Instructions (AES-NI), which dramatically accelerate AES code. AMD's own implementation of AES-NI makes its first appearance in Bulldozer-based CPUs, and as you can see in the chart below is very competitive with the Intel 2600K and 980X. Again, though, the 3960X blasts ahead, posting a score 56% better than its nearest competition. 
Let's move on to the PCMark Vantage benchmark. PCMark Vantage TestsPCMark Vantage is an objective hardware performance benchmark tool for PCs running 32- and 64-bit versions of Microsoft Windows Vista or Windows 7. It's well suited for benchmarking any type of Microsoft Windows Vista/7 PC: from multimedia home entertainment systems and laptops, to dedicated workstations and high-end gaming rigs. Benchmark Reviews has decided to use a few select tests from the suite to simulate real-world processor usage in this article. Our tests were conducted on 64-bit Windows 7, with results displayed in the chart below. TV and Movies Suite
Gaming Suite*
Music Suite
* EDITOR'S NOTE: Hopefully our readers will carefully consider how relevant PCMark Vantage is as a "real-world" benchmark, since many of the tests rely on unrelated hardware components. For example, per the FutureMark PCMark Vantage White Paper document, Gaming test #2 weighs the storage device for 100% of the test score. In fact, according to PCMark Vantage the video card only impacts 23% of the total gaming score, but the CPU represents 37% of the final score. As our tests in this article (and many others) have already proven, gaming performance has a lot more to do with the GPU than the CPU, and especially more than the hard drive or SSD (which is worth 38% of the final gaming performance score). 
The TV and Movies suite concentrates on video playback and transcoding, but only uses two threads at a maximum, so most of the cores in these high-end processors are sitting idle. This is probably why the scores are relatively close. The Gaming benchmark relies on the hard disk and video card for over 50% of its score (see the Editor's Note above), and we're using the same HDD and video card for all platforms, so the Intel processors' huge advantage over the AMD Bulldozer in this test probably means that Vantage's gaming code is more optimized for Intel processors. Bear in mind, however, that most "real world" games will not show this difference; generally, in games, your video card matters most, followed by the clock speed (not number of cores) of your processor. The PCMark Vantage gaming test can use up to 16 threads, so it's still a little odd that the eight-core FX-8150 scores less than half of any of the Intel CPUs. Things flatten out in the Music benchmark, with only about a 10% difference separating the best and worst scores. Oddly, the 2600K turns in a better score than the Sandy Bridge Extreme. CINEBENCH R11.5 BenchmarksMaxon CINEBENCH is a real-world test suite that assesses the computer's performance capabilities. CINEBENCH is based on Maxon's award-winning animation software, Cinema 4D, which is used extensively by studios and production houses worldwide for 3D content creation. Maxon software has been used in blockbuster movies such as Spider-Man, Star Wars, The Chronicles of Narnia, and many more. CINEBENCH Release 11.5 includes the ability to more accurately test the industry's latest hardware, including systems with up to 64 processor threads, and the testing environment better reflects the expectations of today's production demands. A more streamlined interface makes testing systems and reading results incredibly straightforward. The CINEBENCH R11.5 test scenario comprises three tests: an OpenGL-based test that models a simple car chase, and single-core and multi-core versions of a CPU-bound computation using all of a system's processing power to render a photo-realistic 3D scene, "No Keyframes", the viral animation by AixSponza. This scene makes use of various algorithms to stress all available processor cores, and all rendering is performed by the CPU: the graphics card is not involved except as a display device. The multi-core version of the rendering benchmark uses as many cores as the processor has, including the "virtual cores" in processors that support Hyper-Threading. The resulting "CineMark" is a dimensionless number only useful for comparisons with results generated from the same version of CINEBENCH. For the multi-core rendering test, we again see a nice linear performance progression. As we've seen before, the 2600K's four real and four virtual (courtesy of Hyper-Threading) cores beat the FX-8150's eight real cores in testing, and the six real and six virtual cores of the 980X and 3960X do even better. It used to be that CINEBENCH multi-core rendering scores above 10 were the province of multi-CPU servers...not any more.
The single core rendering test sheds light on these results: we can see that AMD's core performance is approaching the Intel core performance...of their last-generation CPU. The Sandy Bridge cores are almost 50% faster. 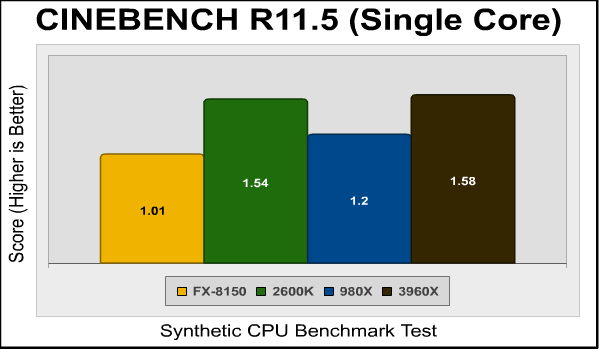
Let's take a look at some CPU-limited gaming results in the next section. CPU-Dependent 3D GamingStreet Fighter IV uses a new, built-from-scratch graphics engine that enables CAPCOM to tune the visuals and performance to fit the needs of the game, as well as run well on lower-end hardware. Although the engine is based on DX9 capabilities, it does add soft shadows, High Dynamic Range lighting, depth of field effects, and motion blur to enhance the game experience. The game is multi-threaded, with rendering, audio, and file I/O all running in different threads. The development team has also worked to maintain a relatively constant CPU load in all parts of the game so that on-screen performance does not change dramatically in different game scenarios.
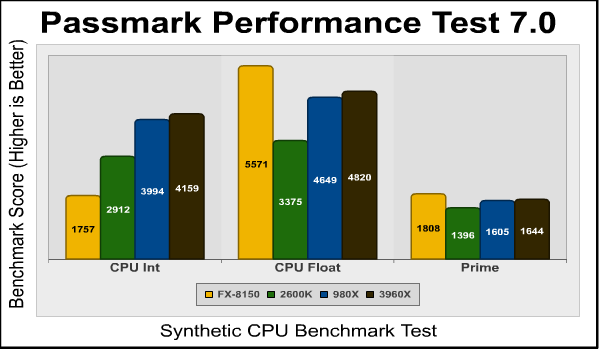
I ran the Street Fighter IV benchmark at its lowest resolution (640x480) with all graphical features turned down to the minimum possible settings. This makes the video card much less of a factor in the results, biasing towards processor performance. Intel CPUs dominate here, but it's odd that the 2600K turns in a somewhat better score than the 3960X. PassMark PerformanceTest 7.0The PassMark PerformanceTest allows you to objectively benchmark a PC using a variety of different speed tests and compare the results to other computers. PassMark comprises a complete suite of tests for your computer, including CPU tests, 2D and 3D graphics tests, disk tests, memory tests, and even tests to determine the speed of your system's optical drive. PassMark tests support Hyper-Threading and systems with multiple CPUs, and allow you to save benchmark results to disk (or to export them to HTML, text, GIF, and BMP formats). Knowledgeable users can use the Advanced Testing section to alter the parameters for the disk, network, graphics, multitasking, and memory tests, and create individual, customized testing suites. But for this review I used only the built-in CPU tests, which aren't configurable. The CPU tests comprise a number of different metrics. The first three I'll look at are integer performance, floating point performance, and a benchmark that finds prime numbers.
Intel utterly dominates the Integer test, and we can see that cores count for a lot here, with the old-school 980X producing results almost identical with the 3960X, and both of them beating the four-core 2600K. AMD does pull off wins in the next two benchmarks, though, especially in the Float test, where AMD's traditionally strong floating point performance takes the win...it's too bad that this will make so little difference in most real-world code, though, where integer instructions comprise upwards of 90% or more of the code actually executed. AMD also pulls off a win in the Prime benchmark, which we've seen before but is still slightly startling against the 3960X.
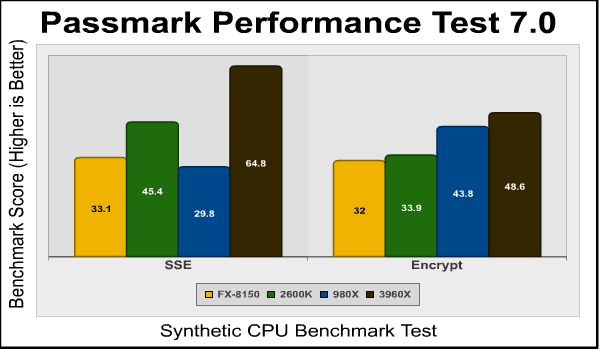
SSE stands for "Streaming SIMD Extensions", and are instructions that handle multiple chunks of data per instruction (SIMD = Single Instruction Multiple Data). SSE instructions work on single-precision floating point data and are typically used in graphical computations. SSE was Intel's response to AMD's "3D Now", which itself was a response to Intel's MMX instructions. Don't you love competition? AMD's current implementation does well in this benchmark, if only against Intel's last-generation CPU: both Sandy Bridge processors post much higher scores. Things flip around in the Encrypt benchmark, where it's obvious that more cores is more important than core architecture.
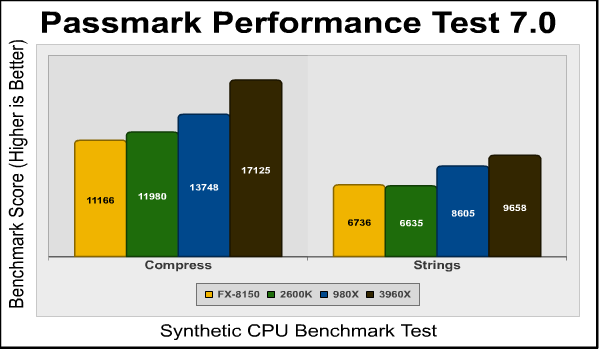
The Compress and String benchmarks are both integer-based, but the FX-8150 does pretty well, even so. It's all but even with the 2600K in the Compress benchmark and (very slightly) ahead in the Strings benchmark. But nothing competes with the Core i7-3960X. But enough with the synthetic benchmarks; let's move onto some more real-world applications. Handbrake Media EncodingIt's a truism that consumer-level computer performance reached the "fast enough" point years ago, where increases in system performance don't make things any faster for most people. Web browsing, e-mail, word processing, and even most games won't benefit dramatically from a super-fast CPU. There are some exceptions, though, and media encoding is one of them: transcoding video, especially high-definition video, can bring the strongest system to its knees. Fortunately, media transcoding is one of those things that (depending on the design of the code, of course) that scales really well with both clock speed and the number of cores, so the more you have of both, the better your results will be. The free and open-source Handbrake 0.95 video transcoder is an example of a program that makes full use of the computational resources available. For this test I used Handbrake 0.95 to transcode a standard-definition episode of Family Guy to the "iPhone & iPod Touch" presets, and recorded the total time (in seconds) it took to transcode the video.
Handbrake's encoding code seems to benefit from both number of cores as well as core efficiency, but there's still less difference here between the Intel CPUs than I'd expect. The Sandy Bridge Extreme CPU is 16% faster than the 2600K and only 13% faster than the 980X. x264 HD Benchmark 3.19Tech ARP's x264 HD Benchmark comprises the Avisynth video scripting engine, an x264 encoder, a sample 720P video file, and a script file that actually runs the benchmark. The script invokes four two-pass encoding runs and reports the average frames per second encoded as a result. The script file is a simple batch file, so you could edit the encoding parameters if you were interested, although your results wouldn't then be comparable to others.
The first two runs see the AMD Bulldozer FX-8150 matching the performance of the 2600K, but both are dominated by the six core CPUs. The 3960X beats the 2600K by 41% in both runs, reasonably close to the 50% difference one would expect if the performance scaled linearly with the number of cores. 
Oddly, the 2600K drop far behind the other processors in this part of the benchmark, and the two six-core CPUs leap far ahead. The 3960X frames-per-second are double those of the 2600K. SPECviewperf 11 testsThe Standard Performance Evaluation Corporation is "...a non-profit corporation formed to establish, maintain and endorse a standardized set of relevant benchmarks that can be applied to the newest generation of high-performance computers." Their free SPECviewperf benchmark incorporates code and tests contributed by several other companies and is designed to stress computers in a reproducible way. SPECviewperf 11 was released in June 2010 and incorporates an expanded range of capabilities and tests. Note that results from previous versions of SPECviewperf cannot be compared with results from the latest version, as even benchmarks with the same name have been updated with new code and models. SPECviewperf comprises test code from several vendors of professional graphics modeling, rendering, and visualization software. Most of the tests emphasize the CPU over the graphics card, and have between 5 and 13 sub-sections. For this review I ran the Lightwave, Maya, and Seimens Teamcenter Visualization tests. Results are reported as abstract scores, with higher being better. LightwaveThe lightwave-01 viewset was created from traces of the graphics workloads generated by the SPECapc for Lightwave 9.6 benchmark. The models for this viewset range in size from 2.5 to 6 million vertices, with heavy use of vertex buffer objects (VBOs) mixed with immediate mode. GLSL shaders are used throughout the tests. Applications represented by the viewset include 3D character animation, architectural review, and industrial design. MayaThe maya-03 viewset was created from traces of the graphics workload generated by the SPECapc for Maya 2009 benchmark. The models used in the tests range in size from 6 to 66 million vertices, and are tested with and without vertex and fragment shaders. State changes such as those executed by the application- including matrix, material, light and line-stipple changes- are included throughout the rendering of the models. All state changes are derived from a trace of the running application. Siemens Teamcenter Visualization MockupThe tcvis-02 viewset is based on traces of the Siemens Teamcenter Visualization Mockup application (also known as VisMockup) used for visual simulation. Models range from 10 to 22 million vertices and incorporate vertex arrays and fixed-function lighting. State changes such as those executed by the application- including matrix, material, light and line-stipple changes- are included throughout the rendering of the model. All state changes are derived from a trace of the running application.
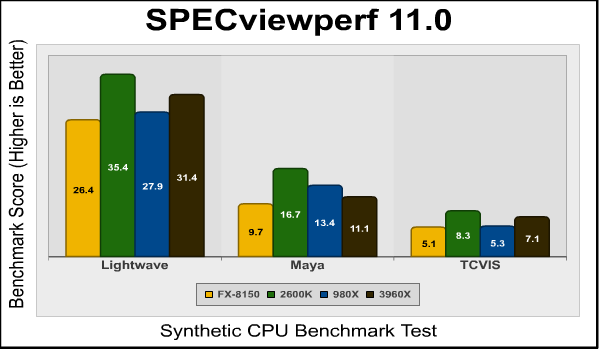
The SPECviewperf suite is a good example of a real-world test of applications that would normally be the province of a high-end workstation: the individual tests comprise code and models from real applications, running scripts that do real work. Still, the results are puzzling: the 2600K dominates, easily beating both of the six core CPUs. Results like this cause reviewers like me to scratch our heads and run the benchmark again, even though we know we'll get the same results. SPECapc LightwaveSPECapc (Application Performance Characterization) tests are fundamentally different from the SPECviewperf tests. While SPECviewperf tests incorporate code from the various test programs directly into the benchmark, the SPECapc tests are separate scripts and datasets that are run against a stand-alone installation of the program being benchmarked. SPECapc group members sponsor applications and work with end-users, user groups, publications and ISVs to select and refine workloads, which consist of data sets and benchmark script files. Workloads are determined by end-users and ISVs, not SPECapc group members. These workloads will evolve over time in conjunction with end-users' needs and the increasing functionality of PCs and workstations. For this test, I ran the SPECapc "Lightwave" benchmark against a trial installation of Newtek's Lightwave 3D product. The benchmark, developed in cooperation with NewTek, provides realistic workloads that simulate a typical LightWave 3D workflow. It contains 11 datasets ranging from 64,000 to 1.75 million polygons and representing such applications as 3D character animation, architectural review, and industrial design. Scores for individual workloads are composited under three categories: interactive, render and multitask. The benchmark puts special emphasis on processes that benefit from multi-threaded computing, such as animation, OpenGL playback, deformations, and high-end rendering that includes ray tracing, radiosity, complex textures and volumetric lighting. The test reports three scores: Animation (multitasking), Animation (interactive), and Rendering. The numeric scores represent the time it took to complete each section of the benchmark, in seconds, so lower scores are better. I've found the SPECapc Lightwave 3D test to be an excellent indicator of overclock stability. In many cases, overclocked systems that will make it through every other benchmark here will crash in this test. It's also one of the most "fun" benchmarks to watch, as multiple windows with various complex rendering tasks appear and disappear on your screen. 
These results illustrate how much difference benchmark configuration can make. SPECviewperf uses embedded code from Lightwave, while SPECapc is actually just a set of scripts that control a standard Lightwave installation. Note that in SPECviewperf's Lightwave section above, the 2600K returned the best performance numbers, while in SPECapc, the Sandy Bridge Extreme wins. BlenderBlender is an open-source, free content creation suite of 3D modeling, rendering, and animation capabilities. Originally released in 2002, it's available in versions for Mac OS X, Windows, Linux, and several Unix distributions. It supports rigid and soft-body objects and can handle the draping and animation of cloth, as well as the rendering and animation of smoke, water, and general particle handling. Our Blender test renders multiple frames of an animation of a rotating chunk of ice, with translucency and reflections. Rendering of this model uses ray-tracing algorithms and the program reports the rendering time for each of the animation's 25 frames. The results are a summation of the rendering times for all frames and the lower the score, the better. Bear in mind, though, that Blender can dispatch a maximum of eight threads, so the full power of the 980X and 3960X isn't being used here. 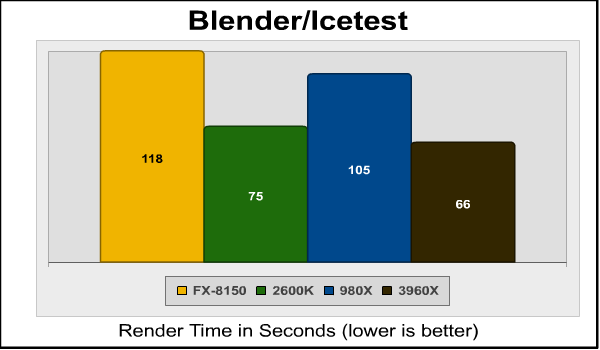
Another win for the Core i7-3960X, although by only a relatively slim margin: 12% better than the Core i7-2600K. Since the 3960X is limited to eight threads in this test, the same number as the 2600K, I'd guess the win reflects the extra cache the Sandy Bridge Extreme CPU brings to the party. POV-RayThe Persistence of Vision ray tracer is a free, open source 3D modeling program that uses ray-tracing algorithms to generate realistic three-dimensional images. Ray tracing is very computationally intensive, and the POV-Ray program has a handy built-in benchmark to let you check the performance of your system. Although AMD again brings up the rear, the FX-8150 really does pretty well, coming very close to the performance of the 2600K. But unlike Blender, POV-Ray can use as many threads as a CPU will give it, so the six core CPUs win again.
In the next section I'll present my final thoughts and conclusion on the Intel DX79SI Extreme Series motherboard. X79 Express Motherboard Final ThoughtsWith the release of the Sandy Bridge Extreme LGA2011 CPUs and their supporting X79 Express chipset, Intel once again vaults into the performance lead, and the Intel DX79SI X79 Express motherboard shows how Intel thinks things should be done. Enthusiasts can rejoice: the X79 Express jettisons most of the limitations of the previous P67/Z68 chipsets: you now have all the overclocking mechanisms you could wish for, and don't have to worry about spending die space or power on a weak integrated GPU you may never use. The dearth of PCI-E lanes that afflicted the LGA 1156/1155 platform has been addressed with a massive 48 lanes (40 from the Sandy Bridge Extreme and 8 from the X79 Express chipset), ensuring that you'll never have to worry about how adding a second video card might torpedo your SATA 6G or USB 3.0 performance again.
There are still some things missing from X79 Express, though: Intel's Smart Response Technology SSD caching is gone, although we'll see third party solutions to this lack in other X79 motherboards. And while quad-channel memory is nice, at least for memory bandwidth benchmark scores, I think more SATA 6G ports, along with some integrated USB 3.0 and Thunderbolt, would probably have made more real-world impact. The Intel DX79SI Extreme Series motherboard is a competent effort from the world's largest CPU vendor, and it contains enough enthusiast features (POST code display, Start and Reset buttons, status LEDs, PWM fan headers, BIOS recovery, etc.) to indicate that Intel's at least trying to justify its "Extreme" moniker, although I have to say that the impression I got from the DX79SI is that it's just that: trying, perhaps without a lot of understanding as to what enthusiasts really want. For example, the POST code display is a nice addition to any enthusiast motherboard, but putting a card in either of the last two slots will block it. Bright red fan headers are a good idea, but why only four, especially since one must be dedicated to the CPU fan? Intel's removed Smart Response Technology from the X79 chipset, eliminating the cool SSD caching this feature provided, and while vendors like ASUS have responded with their own solutions, all the DX79SI offers is a lonely blank space on the motherboard that might someday house another two SATA ports. The textual UEFI BIOS is functional, although it's not particularly easy to navigate and frankly looks primitive next to the more elaborate mouse-driven graphical BIOS' of its competition. That said, the one genuinely innovative feature of the BIOS is the DX79SI Overclocking Assistant, which can give you a real running start on the complexities of overclocking a Sandy Bridge Extreme chip. The beta BIOS prevented me from evaluating this feature (the board would lock up when I tried), but when Intel releases a stable BIOS, I think this has the potential to do a much better job of automatic overclocking than existing schemes from other vendors. Intel DX79SI ConclusionIMPORTANT: Although the rating and final score mentioned in this conclusion are made to be as objective as possible, please be advised that every author perceives these factors differently at various points in time. While we each do our best to ensure that all aspects of the product are considered, there are often times unforeseen market conditions and manufacturer changes which occur after publication that could render our rating obsolete. Please do not base any purchase solely on our conclusion, as it represents our product rating specifically for the product tested which may differ from future versions. Benchmark Reviews begins our conclusion with a short summary for each of the areas that we rate. My conclusions about this motherboard are necessarily limited: Benchmark Reviews received a pre-production unit with no manual, no accessory pack, and a beta BIOS that dramatically limited overclocking. Still, I can make some observations. You'll see relatively little, if any, performance differences between different motherboards using the same chipset. With modern processors integrating the memory controller, PCI-E lanes, and such onto the CPU die, there are fewer opportunities for vendors to distinguish their motherboards on stock performance (although well-designed power and cooling systems can certainly help overclocking). What this means is that vendors must distinguish themselves with features, and this is especially true of enthusiast-level motherboards that cost $300 and more. The DX79SI's feature set makes a nod to the enthusiast community, but still lacks some of the basics you'd expect in a motherboard at this price level. 
The DX79SI appears to be well-constructed, as you'd expect from Intel, and was stable and reliable through the Benchmark Reviews testing regimen. However, its performance trailed that of the ASUS motherboards we were testing alongside it in every single benchmark, and while this was doubtless due to the beta BIOS, we can only test what we're sent. Functionally, the DX79SI offers a slew of new features. Some of these, like more memory channels and more PCI-E lanes, are part of the whole Sandy Bridge Extreme/X79 Express package, while others such as the POST code display, status LEDs, and a second gigabit Ethernet port, are things that have been added separately. But the DX79SI simply lacks the chops to seriously compete with high-end boards from many third party vendors, and things like the uninspired Realtek ALC829 audio really don't belong on a board at this level. All that said, Intel motherboards have earned a reputation for solid and reliable operation over the years, and nothing I saw with the DX79SI leads me to believe it will be any different. This board would make an excellent base for a professional CAD, rendering, or engineering workstation. But you should check out the competition before springing for the Intel board, since you might be able to get more for your money. Pros:
+ Excellent performance when paired with top-end Core i7-3960X CPU Cons:
- Character-based BIOS looks primitive next to graphical competition Benchmark Reviews invites you to leave constructive feedback below, or ask questions in our Discussion Forum.
Related Articles:
|
|||||||||||||||||||||||||||||||||||||||||||||||||||||||


Comments
i must say in the beginning that i-ll be a little biased, cause i do own an 990X.
So, it looks that Intel achieve full maturity with this type of processors (let-s call it I7 class). And not very distant from the end. Which may be not a good part for buyers. but,
on the other hand this means reiability, trust, and so on. Now, the efforts go in MB/3rd party enhancements.
good.
and , i think if today you own an 980X/2600k or around, you can stay relaxed 2 or more years. Also, I DO HOPE its a good time for AMD to catch the train. I hate/worry about monopoly. and the new amd CPU give us a little hope. good.
If you want to see how the Intel DX79SI compares against other X79 Express motherboards, read my "X79 Express Motherboard Performance Comparison." But do try to pay attention this time.
your prompt return will be highly appriciated .
That said, there's nothing magic or different about the X79's PCI-E slots, nor is software on that level any different, so if the card works in the PCI-E slots of any other motherboard, it should work fine in this board.