AMD A10-6700 Richland APU Review
Manufacturer: Advanced Micro Devices
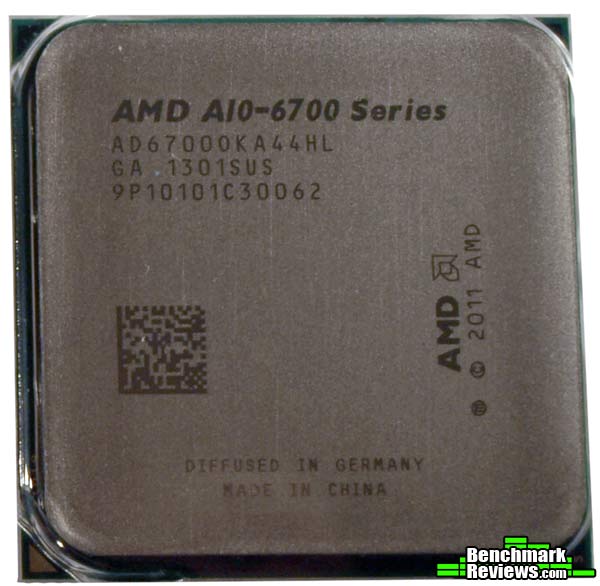
Product Name: Desktop processor
Model Number: A10-6700
Part Number: AD67000KA44HL / AD6700OKHLBOX
Full Disclosure: The product sample used in this article has been provided by AMD.
AMD has a pattern when it comes to processor releases. They release a new processor, run it through its paces for a while, then they release more of the same die with higher clock speeds. Generally, though, the new processors release at something closer to the release price of the first series of processors. That is the one part of the equation missing from this summer's AMD APU releases. The AMD A10-6700 is the second processor coming out in June 2013 with an MSRP of $142. In this article, Benchmark Reviews is taking a detailed look at the A10-6700, especially its differences from the unlocked A10-6800K.
There is not a lot of difference between the two, top-end APUs released today by AMD. The faster of the two is the A10-6800K. The 6800K is an unlocked processor with a core clock speed of 4.1GHz with the ability to turbo up to 4.4GHz. The AMD A10-6700 runs 200MHz slower at 3.9GHz stock and can only turbo up to 4.2GHz. The A10-6700 doesn't have a K on the end of it, which means that it isn't an unlocked processor, severely limiting its ability to be overclocked.
The interesting thing about the AMD A10-6700 and the A10-6800K is that they both cost the exact same amount. So what's the deal? The AMD A10-6700 is a slower, locked processor that costs the same as the faster, unlocked A10-6800K. What it all boils down to is one simple question. How much is 35 Watts worth to you?
The AMD A10-6700 has a thermal design power of 65W, 35W why of the 100W TDP of the unlocked A10-6800K. Other than that, 200MHz, and a K at the end of its name, the two APUs are identical. In fact, if the A10-6800K were to be used exclusively at stock speeds, it wouldn't use any more power than the A10-6700. All you'd have to do is turn off the Turbo ability.
You see, the thermal design power isn't actually indicative of how much power the processor uses. The TPD is actually the maximum amount of power that would theoretically need to be dissipated by the system under load. That means that a processor with a TDP of 65W might actually use more power than that. It also means that a processor with a TDP of 100W might actually use less power than that.
But power is a big deal these days. The shining feature of Haswell that's drawing the most attention is its potential to use such low amounts of power that it could revolutionize the mobile arena with desktop level performance with extra-long battery life. Lower power consumption seems to be the main selling point these days. So is 35W worth 200MHz. Let's take a look at the numbers and see.
AMD A10-6700 Features
The following information is provided courtesy of AMD
Turbo Charged x86 architecture featuring "Piledriver" cores
o Supports up to 4 cores and support for the latest ISA instructions including FMA4/3, AVX, AES, XOP
o Up to 2MB L2 cache per dual-core module (up to 4MB total)
o Max Turbo Frequencies up to 4.4 GHz
o Configurable via AMD OverDrive
AMD Radeon HD 8000 Series GPU Cores
o Featuring VLIW 4 architecture
o Up to 384 shaders
o Up to 844MHz
o Up to 8xAA and 16AF support
o Controllable via AMD OverDrive
o DirectX 11 Support
New DDR3-2133 support on A10 APUs
Enhanced AMD Turbo Core
o More Frequency/Voltage levels for CPU and x86 cores
o Temperature Smart Turbo Core
o New bottleneck detect algorithms
o Controllable via AMD OverDrive
UVD and VCE
o Video Encode and Decode Hardware to offload CPU
o AMD Picture Perfect support with HD Post Processing technologies
Support for latest display technologies
o AMD Eyefinity
o Display Port 1.2 support technology for 3+1 monitor support
FM2 Platform
- AMD CrossFire support with AMD A85X motherboards
- AMD Memory Profile support (auto select memory timings in select DIMMs)
- AMD Dual Graphics cards support with AMD Radeon HD 6450, 6570, and 6670 graphics
AMD (SKU) Specifications
As of 5 June 2013, the AMD Richland series of APUs consists of five seperate processors; two from the A10 line, two from the A8 line, and one from the A6 line. Eventually, more processors will likely be released, specifically in the lower end A6 and even the A4 lines of processors. The TDP points of the third generation of APUs stays pretty much the same as the previous generation. This is not surprising, especially considering the new processors are built on mostly existing architecture.
Here are the current APU Richland models:
| Processor |
A10-6800K |
A10-6700 |
A8-6600K
|
A8-6500
|
A6-6400K
|
| CPU Base clock (GHz) |
4.1 |
3.9 |
3.7 |
3.4 |
3.4 |
| CPU Turbo clock (GHz) |
4.4
|
4.2 |
4.3 |
3.8 |
3.8 |
| Cores |
4 |
4 |
4
|
4 |
2
|
| Cache |
4MB |
4MB |
4MB |
4MB |
1M |
| Memory Support |
Dual-channel DDR3-2133 |
Dual-channel DDR3-1866 |
Dual-channel DDR3-1866 |
Dual-channel DDR3-1866 |
Dual-channel DDR3-1866 |
| PCI-E lanes |
16 Gen 3 |
16 Gen 3 |
16 Gen 3 |
16 Gen 3 |
16 Gen 3 |
| Graphics |
Radeon HD 8670D
|
Radeon HD 8670D |
Radeon HD 8570D |
Radeon HD 8570D |
Radeon HD 8470D |
AMD Radeon Cores
|
384
|
384 |
256 |
256 |
192 |
| Graphics Core clock |
844MHz |
844MHz |
844MHz |
800MHz |
80MHz |
| DirectX Version |
11.1 |
11.1 |
11.1 |
11.1 |
11.1 |
AMD Turbo Core
|
Yes |
Yes |
Yes |
Yes |
Yes |
| TDP |
100 watts |
65 watts |
100 watts |
84 watts |
84 watts |
| Unlocked |
Yes
|
No |
Yes |
No |
Yes |
| MSRP |
$142 |
$142 |
$112
|
$112
|
$69 |
Processor Testing Methodology
Richland is the next generation of APUs from AMD and follows Trinity in that role. Because of that, I have included the flagship Trinity processor in this review; the A10-5800K. Throughout the testing process, we will be able to see what kind of improvements the better yields and instructions have given the new APUs. As of this writing, the closest Intel processor to the A10-6800K and A10-6700 APUs that I have on hand, in terms of price and performance, is the Core i3-3220. I'll be comparing the i3-3220 to the new APUs so that we can see exactly where they stand. Of course, when the lower range of Haswell CPUs are released, we will have to revisit the
comparisons.
The A10-6700, as a locked processor, was not intended to be overclocked, and I haven't included any results from overclocking the slower of the two APUs.
The question on everyone's mind, of course, is whether or not the new series of APUs can play games; especially the latest titles available now. Because of that, I'll be specifically answering that question by using an array of GPU synthetic benchmarks and two of the newest games. I've used the HD2500 graphics on the i3-3220 for comparison, but since that's really no competition I also included a GT 630 for low end discrete comparison. Unfortunately I didn't have a GPU between the GT 630 and the Radeon HD 7850 on hand to test with. I added in results from the Radeon HD 7850 and the GTX 660Ti just to show was a little more juice can provide. At around $150, the Radeon HD 7850 could be a great match up for a Richland APU.
Intel Z77 Express Test Platform
- Motherboard: Biostar Hi-Fi Z7&X
- Processor: 3.3GHz Intel Core i3-3220 and 3.3GHz Intel Core i5-2500K
- System Memory: 8GB DDR3-1600 (two 4GB DIMMs) at 11-11-12-28
- Primary Drive: Seagate ST1000LM014 1TB SSHD drive
- Graphics Adapter: AMD Radeon HD7850; GT 630; GTX 660Ti; Integrated HD2500
AMD FM2 A-Series Platform
- Motherboard: ASUS F2A85-M Pro
- Processor: 3.8GHz A10-5800K; 3.9GHz A10-6700; 4.1GHz A10-6800K
- System Memory: 8GB DDR3-1600 (two 4GB DIMMs) at 11-11-12-28
- Primary Drive: Seagate ST1000LM014 1TB SSHD drive
- Graphics Adapter: AMD Radeon HD7850; GT 630; GTX 660Ti; Integrated Radeon HD Graphics
Benchmark Applications: CPU
- Operating System: Windows 7 Home Premium 64-Bit
- Finalwire AIDA64 Extreme Edition v2.99.2446 (Beta)
- Futuremark PCMark 7
- Maxon CINEBENCH R11.5 64-Bit
- SiSoft Sandra 2013.SP3a
Benchmark Applications: Integrated GPU
- ComputeMark 2.1
- 3DMark 11
- Unigine Heaven 4.0
- BioShock Infinite
- Tomb Raider
Let's start the benchmarking with an AIDA64 run in the next section.
AIDA64 Extreme Edition Tests
AIDA64 is FinalWire's full 64-bit benchmark and test suite utilizing MMX, 3DNow! and SSE instruction set extensions, and will scale up to 32 processor cores. An enhanced 64-bit System Stability Test module is also available to stress the whole system to its limits. For legacy processors all benchmarks and the System Stability Test are available in 32-bit versions as well.

All of the benchmarks used in this test- Queen, Photoworxx, ZLib, hash, and AES- rely on basic x86 instructions, and consume very little system memory while also being aware of Hyper-Threading, multi-processors, and multi-core processors. Of all the tests in this review, AIDA64 is the one that best isolates the processor's performance from the rest of the system. While this is useful in that it more directly compares processor performance, readers should remember that virtually no "real world" programs will mirror these results.

The Queen and Photoworxx tests are synthetic benchmarks that iterate the function many times and over-exaggerate what the real-world performance would be like. The Queen benchmark focuses on the branch prediction capabilities and misprediction penalties of the CPU. It does this by finding possible solutions to the classic queen problem on a chessboard. At the same clock speed theoretically the processor with the shorter pipeline and smaller misprediction penalties will attain higher benchmark scores.
Like the Queen benchmark, the Photoworxx tests for penalties against pipeline architecture. The synthetic Photoworxx benchmark stresses the integer arithmetic and multiplication execution units of the CPU and also the memory subsystem. Due to the fact that this test performs high memory read/write traffic, it cannot effectively scale in situations where more than two processing threads are used, so quad-core processors with Hyper-Threading have no real advantage. The AIDIA64 Photoworxx benchmark performs the following tasks on a very large RGB image:
- Fill
- Flip
- Rotate90R (rotate 90 degrees CW)
- Rotate90L (rotate 90 degrees CCW)
- Random (fill the image with random colored pixels)
- RGB2BW (color to black & white conversion)
- Difference
- Crop
Finally, the floating point tests.
Let's move on to the PCMark 7benchmark.
PCMark 7 Tests
PCMark 7 is Futuremark's successor to PCMark Vantage. The full suite of tests comprises seven different sequences with more than 25 sub-tests that exercise your system's abilities in storage, computation, image and video manipulation, web browsing and gaming. It was developed with input from the designers, engineers and product managers at AMD, Compal, Dell, Hitachi GST, HP, Intel, NVIDIA, Samsung, Seagate, Western Digital and many other well-known companies.
For this benchmark I chose the PCMark test, which provides a number indicating total system performance, as well as the Productivity, Creativity, Entertainment, and Computation test suites.
Creativity Test
The Creativity test contains a collection of workloads to measure the system performance in typical creativity scenarios. Individual tests include viewing, editing, transcoding and storing photos and videos. At the end of the benchmark run the system is given a Creativity test score.
- Storage
- importing pictures
- video editing
- Image manipulation
- Video transcoding - high quality
Computation Test
The Computation test contains a collection of workloads that isolate the computation performance of the system. At the end of the benchmark run the system is given a Computation test score.
- Video transcoding - downscaling
- Video transcoding - high quality
- Image manipulation

Productivity Test
The Productivity test is a collection of workloads that measure system performance in typical productivity scenarios. Individual workloads include loading web pages and using home office applications. At the end of the benchmark run the system is given a Productivity test score. The Productivity test consists of:
- Storage
- Windows Defender
- Starting applications
- Web browsing and decrypting
- Productivity
- Data decryption
- Text editing
Entertainment Test
The Entertainment test measures your PC performance in common entertainment scenarios such as recording, viewing, streaming and transcoding TV shows and movies, importing, organizing and browsing new music and playing games. Some workloads require DirectX 10.
It's important to note that since PCMark 7 was designed as a system test, the scores are dependent on the configuration of the entire system being tested, including things like the memory, hard disk, and graphics cards used: it's not an isolated CPU test like most of the other benchmarks I'm using in this review. However, since all other hardware (motherboard, video card, memory, hard disk, etc.) was identical, with only the CPUs being changed, any performance differences here can be attributed to differences in CPU performance.
In the next section I run everyone's favorite benchmark: CINEBENCH!
CINEBENCH 11.5
Maxon CINEBENCH is a real-world test suite that assesses the computer's performance capabilities. CINEBENCH is based on Maxon's award-winning animation software, Cinema 4D, which is used extensively by studios and production houses worldwide for 3D content creation. Maxon software has been used in blockbuster movies such as Spider-Man, Star Wars, The Chronicles of Narnia, and many more. CINEBENCH Release 11.5 includes the ability to more accurately test the industry's latest hardware, including systems with up to 64 processor threads, and the testing environment better reflects the expectations of today's production demands. A more streamlined interface makes testing systems and reading results incredibly straightforward.
The CINEBENCH R11.5 test scenario comprises three tests: an OpenGL-based test that models a simple car chase (which I didn't use for this test), and single-core and multi-core versions of a CPU-bound computation using all of a system's processing power to render a photo-realistic 3D scene, "No Keyframes", the viral animation by AixSponza. This scene makes use of various algorithms to stress all available processor cores, and all rendering is performed by the CPU: the graphics card is not involved except as a display device. The multi-core version of the rendering benchmark uses as many cores as the processor has, including the "virtual cores" in processors that support Hyper-Threading. The resulting "CineMark" is a dimensionless number only useful for comparisons with results generated from the same version of CINEBENCH.

Next up is SiSoft Sandra's suite of CPU benchmarks.
SiSoft Sandra 2013
SiSoftware Sandra (the System ANalyser, Diagnostic and Reporting Assistant) is an information & diagnostic utility. It should provide most of the information (including undocumented) you need to know about your hardware, software and other devices whether hardware or software. It's available in five versions, ranging from the free "Lite" version to the Sandra Enterprise version. Sandra fully supports and exploits multi-processor and multi-core systems, NUMA memory, Hyper-Threading, and MMX, SSE, SSE2, SSE3, SSSE3, SSE 4.1, SSE 4.2, AVX, and FMA instructions.
It works along the lines of other Windows utilities, however it tries to go beyond them and show you more of what's really going on. Giving the user the ability to draw comparisons at both a high and low-level. You can get information about the CPU, chipset, video adapter, ports, printers, sound card, memory, network, Windows internals, AGP, PCI, PCI-X, PCIe (PCI Express), database, USB, USB2, 1394/Firewire, etc.
CPU Cache Memory Tests
The SANDRA DhryStone and Whetstone tests are CPU tests that run completely within the CPU + cache memory itself. These tests are perfect for seeing general efficiency per processing core. Dhrystone is basically a suite of arithmetic and string manipulating programs and is an older CPU tests. Even so, it remains a simple and accurate way to show RAW CPU processing performance. The whetstone benchmark primarily measures floating-point arithmetic performance.

CPU MultiMedia and Cryptography Tests
This benchmark generates a picture (640x480) of the well-known Mandelbrot fractal, using 255 iterations for each data pixel, in 32 colours. It is a real-life benchmark rather than a synthetic benchmark, designed to show the improvements MMX/Enhanced, 3DNow!/Enhanced, SSE(2) bring to such an algorithm. The benchmark is multi-threaded for up to 64 CPUs maximum on SMP systems. This works by interlacing, i.e. each thread computes the next column not being worked on by other threads. Sandra creates as many threads as there are CPUs in the system and assignes each thread to a different CPU.
The benchmark contains many versions (ALU, MMX, (Wireless) MMX, SSE, SSE2, SSSE3) that use integers to simulate floating point numbers, as well as many versions that use floating point numbers (FPU, SSE, SSE2, SSSE3). This illustrates the difference between ALU and FPU power. The SIMD versions compute 2/4/8 Mandelbrot point iterations at once - rather than one at a time - thus taking advantage of the SIMD instructions. Even so, 2/4/8x improvement cannot be expected (due to other overheads), generally a 2.5-3x improvement has been achieved. The ALU & FPU of 6/7 generation of processors are very advanced (e.g. 2+ execution units) thus bridging the gap as well.
Financial Operations, Multi-Core Efficiency, and Floating Point Tests
These final three tests measure the ability of the CPU to conduct various other operations. Financial-esque operations, including highly detailed mathematical algorithms are measured in thousands of operations per second (kOPT/s). The speed at which information is transmitted in multi-core setups is tested as well. Finally, SiSoft Sandra has its own suite of ALU Floating Point tests to test out the floating point operations of the CPU.

Next up we'll take a look at the GPU capabilities of the A10-6800K.
DX11 performance
ComputeMark 2.1
ComputeMark is a DirectX 11 Compute Shader Benchmark designed specifically with GPU punishing in mind. It attacks the compute power of your graphics card and spits out a benchmark score. The ComputeMark 2.1 benchmark is a free, downloadable benchmark that is available to everyone. I've included it here so that anyone can try it out and compare their scores to something they see here.

3DMark 11
3DMark11 is Futuremark's latest iteration of the video card software benchmark suite, building on the features of 3DMark Vantage and 3DMark 06 as well as earlier version. It's optimized and intended for testing DirectX-11 capable hardware running under Windows Vista or Windows 7.

Heaven 4.0
The Unigine Heaven 4.0 benchmark is a free publicly available tool that grants the power to unleash the graphics capabilities in DirectX-11 for Windows 7 or updated Vista Operating Systems. It reveals the enchanting magic of floating islands with a tiny village hidden in the cloudy skies. With the interactive mode, emerging experience of exploring the intricate world is within reach. Through its advanced renderer, Unigine is one of the first to set precedence in showcasing the art assets with tessellation, bringing compelling visual finesse, utilizing the technology to the full extend and exhibiting the possibilities of enriching 3D gaming.
The distinguishing feature in the Unigine Heaven benchmark is a hardware tessellation that is a scalable technology aimed for automatic subdivision of polygons into smaller and finer pieces, so that developers can gain a more detailed look of their games almost free of charge in terms of performance. Thanks to this procedure, the elaboration of the rendered image finally approaches the boundary of veridical visual perception: the virtual reality transcends conjured by your hand. The Heaven benchmark excels at providing the following key features:
- Native support of OpenGL, DirectX 9, DirectX-10 and DirectX-11
- Comprehensive use of tessellation technology
- Advanced SSAO (screen-space ambient occlusion)
- Volumetric cumulonimbus clouds generated by a physically accurate algorithm
- Dynamic simulation of changing environment with high physical fidelity
- Interactive experience with fly/walk-through modes
- ATI Eyefinity support
Gaming Benchmarks
For true gaming benchmarks, I've included two of the lastest and most popular titles available at launch; BioShock Infinite and Tomb Raider.
For BioShock, I used the low presets, expecting that it would be hard on the integrated GPUs. According to the press release from AMD, the Radeon HD 8670D did a little better than the results I saw.
For Tomb Raider, I used the normal presets. Again, in the press release I recieved from AMD, it looked as though the integrated graphics could handle the game a little better than what I experienced. Of course, they were also using DDR3-2333 RAM, where I was using DDR3-1600. Generally speaking, though, increased RAM speed doesn't amount to more than a couple of FPS difference.
And there you have it! Is the 35W of potential saved power worth it?
AMD A10-6700 Conclusion
So the question is whether or not the 35W lower TDP on the A10-6700 makes up for 200MHz slower clock speed. The benchmark results are very clear. The A10-6700 performs exactly the same as the A10-6800K when it comes to graphics performance. That makes sense, because the GPU portions of both APUs are identical.
The CPU portions are identical as well, except for the clock speeds. Those clock speeds translate into slightly lower benchmark scores across the board in the CPU tests. But if you look closely, you'll notice that the 200MHz doesn't make all that big of a difference. In fact, I would dare say that you probably wouldn't see any difference in actual performance between the two APUs during normal usage. You'd have to overclock the A10-6800K to see any type of measurable difference in anything other than a benchmark.
So I guess the search for the answer really boils down to a question of whether or not you are planning on overclocking your processor. That brings up other possible questions as well. If you are an enthusiast with a penchant for overclocking, are you going to settle for a $148.99 APU? (Newegg | Amazon) I suppose that's really a question of budget. Either way, if you are planning on overclocking, then I would say that the A10-6800 is certainly the better deal of the two. An extra 200MHz stock, plus the ability to overclock for the same price is well worth the 35W of potential power usage for someone like me. I don't particularly worry about power consumption much.
If you are not going to overclock, on the other hand, then it makes total sense to save the potential power and go for the slightly slower processor. The problem is, I'm not positive that you'll actually ever see that 35W of power saved. It's extremely hard to isolate APU power consumption. Under normal usage and with all other components identical, the APUs used the same amount of power. I used a Kill-a-Watt EZ to measure power consumption and it was nearly identical in every case. Sometimes the A10-6700 used more, sometimes the A10-6800K used more. Under heavy load, of course, the A10-6800K used more, but never 35W more until I overclocked both the CPU and GPU portions of the A10-6800K.
The bottom line is that I am really torn on the value of the A10-6700. I am an enthusiast. I overclock my components. I don't really ever consider power consumption in my decisions. At the same time, I know that power consumption is an ever increasingly important factor for a lot of consumers. For me, it isn't worth it. I would buy the A10-6800K ten times out of ten over the A10-6700 for the same price. But I can't speak for everyone.
Pros:
+ Beats comparatively priced Intel CPUs
+ No Need to get a New Motherboard
+ 35W lower TDP than the A10-6800K
Cons:
- Performance over Trinity doesn't justify pricing
- 200MHz slower for the same price as A10-6800K
- Locked Processor
Ratings:
-
Performance: 8.00
-
Overclock: N/A
-
Construction: 9.00
-
Functionality: 9.50
-
Value: 7.50
Final Score: 8.50 out of 10.
COMMENT QUESTION: How often do you upgrade your PC?
Related Articles:
|


