| HIS Radeon HD 6870 IceQ Video Card |
| Reviews - Featured Reviews: Video Cards | ||||||||||||||||||||||||||||||||||||||||||||||||||||||||||||||||||||||||||||||||||||||||||||||||||||||||||||||||||||||||||||||||||||||||||||||||||||||||||||||||||||||||||||||||||||||||||||||||||||||||||||||||||||||||||||||||||||||||||||||||||||||||||||||||||||||||||||||||||||||||||||||||||||||||||||||||||||||||||||||||||||||||||||||||||||||||||||||||||||||||||||||||||||||||||||||||||||||||||||||||||||||||||||||||||||||||||||||||||||||||||||||||||||||||||||||||||||||||||||||||||||||||||||||||||||||||||||||||||||||||||||||||||||||||||||||||||||||||||||||||||||||||||||||||||||||||||||||||||||||||||||||||||||||||||||||||||||||||||||||||||||||||||||||||||||||||||||||||||||||||||||||||||||||||||||||||||||||||||||||||||||||||||||||||||||||||||||||||||||||
| Written by Steve Hearst | ||||||||||||||||||||||||||||||||||||||||||||||||||||||||||||||||||||||||||||||||||||||||||||||||||||||||||||||||||||||||||||||||||||||||||||||||||||||||||||||||||||||||||||||||||||||||||||||||||||||||||||||||||||||||||||||||||||||||||||||||||||||||||||||||||||||||||||||||||||||||||||||||||||||||||||||||||||||||||||||||||||||||||||||||||||||||||||||||||||||||||||||||||||||||||||||||||||||||||||||||||||||||||||||||||||||||||||||||||||||||||||||||||||||||||||||||||||||||||||||||||||||||||||||||||||||||||||||||||||||||||||||||||||||||||||||||||||||||||||||||||||||||||||||||||||||||||||||||||||||||||||||||||||||||||||||||||||||||||||||||||||||||||||||||||||||||||||||||||||||||||||||||||||||||||||||||||||||||||||||||||||||||||||||||||||||||||||||||||||||
| Wednesday, 09 November 2011 | ||||||||||||||||||||||||||||||||||||||||||||||||||||||||||||||||||||||||||||||||||||||||||||||||||||||||||||||||||||||||||||||||||||||||||||||||||||||||||||||||||||||||||||||||||||||||||||||||||||||||||||||||||||||||||||||||||||||||||||||||||||||||||||||||||||||||||||||||||||||||||||||||||||||||||||||||||||||||||||||||||||||||||||||||||||||||||||||||||||||||||||||||||||||||||||||||||||||||||||||||||||||||||||||||||||||||||||||||||||||||||||||||||||||||||||||||||||||||||||||||||||||||||||||||||||||||||||||||||||||||||||||||||||||||||||||||||||||||||||||||||||||||||||||||||||||||||||||||||||||||||||||||||||||||||||||||||||||||||||||||||||||||||||||||||||||||||||||||||||||||||||||||||||||||||||||||||||||||||||||||||||||||||||||||||||||||||||||||||||||
HIS Radeon HD 6870 IceQ 1GB Video Card
Manufacturer: HIS Digital Full Disclosure: The product sample used in this article has been provided by HIS. The holiday season is fast approaching and there is still no official word on the next generation GPU's other than TSMC starting volume production. What does that mean? Well, it looks like we will be waiting until next year before any more new video cards from either camp are released. This stop gap between generations gives AIB partners a chance to tweak and perfect their designs and introduce some different models to keep the market active. Today Benchmark Reviews will be looking at the HIS Radeon HD6870 IceQ 1GB, a modern video card with a classic HIS design. As aftermarket designs go, this looks like a real beast of a card but there is no factory overclock on this model. The cooler is a mixture of the HIS IceQ X fin array and a shroud that looks similar to a reference card shroud with a twist. HIS have dubbed the radial fan a 'Black Hole Impeller' because it is able to draw in air from both sides as it is raised slightly from the PCB. The main question is what difference will this make to operating temperatures and overclocking potential; and that is exactly what we intend to find out.
A lot of people are speculating that the PC and PC gaming industry is dying but I beg to differ. I think the Tablet/Smartphone era is just a novelty phase. One problem lies with power delivery, and we all know that today's batteries just don't cut it when we want to use our devices for extended periods (as demonstrated beautifully by the iPhone 4S). No matter how many unique apps or games are available, it is all for nothing if you can't run them for more than a few hours before you need to recharge. Then there is the problem of size, scale and control; these devices once again are not going to cut it unless they evolve to become more like a PC. So here we are again, back at square one with the faithful old PC. Don't even get me started on consoles. Enough with the rambling, let's get on with the review, shall we. Closer Look: HIS Radeon HD 6870 IceQ 1GBIn this section we will have a good tour of the HIS Radeon HD6870 1GB video card and discuss its main features.
The HIS Radeon HD6870 1GB is packed in a relatively small package, about the size and shape of a shoe box. In the box you get a fairly standard bundle that includes an installation package (driver disk and manual), two molex to 6-pin power cable converters, a DVI to VGA adapter and a CrossFireX bridge. While supplies last, HIS are also bundling DiRT 3 codes.
The HIS Radeon HD6870 IceQ 1GB video card is large, measuring 13.8 cm tall x 28.7 cm long and is also a dual slot design. The big, in your face, semi-transparent shroud that covers the IceQ cooler is both a metaphor and quite functional at the same time. HIS have dubbed the radial fan on the end a "Black Hole Impeller" as it can take air in from both sides. It sits approximately 1cm raised above the PCB in order to aid in this function.
The IceQ cooler is somewhat larger than I had first suspected. A pair of 8mm and a pair of 6mm heatpipes take the heat from the GPU and into the aluminum fin array where it is met with cool air from the "Black Hole" radial fan. The shroud makes sure that the cool air is evenly distributed and not wasted and also directs 95% of the warmed air out the back of the PCI bracket (allowing for small gaps in shroud).
The HIS HD6870 IceQ X Turbo X video card requires two 6-pin PCI-E power connectors from your PSU. While HIS supply two molex to 6-pin converters, it is strongly recommended that you use a PSU that actually has two 6-pin connectors present to power this card. HIS also recommends using a 500W or greater PSU.
For output we have two mini display port connectors, a HDMI port and two DVI-I connectors (top is single link and bottom is dual link). Bundled with the card you get a DVI to D-SUB adapter, so as far as connectors go HIS have really covered all the bases here. The top half of the PCI bracket has a small vent cut out, the design of the cooler exhausts 95% of the hot air out here. HIS Radeon HD 6870 IceQ 1GB Detailed FeaturesIn this section we like to tear down the video card and see what makes it tick.
Removing the cooler is accomplished by removing four sprung screws from the rear of the card and gently prying it away from the GPU and memory IC's. A pair of 8mm and a pair of 6mm heatpipes take the heat from the GPU and into the aluminum fin array where it is met with cool air from the 'Black Hole Impeller' radial fan. The shroud makes sure that the cool air is evenly distributed and not wasted, apart from a few small gaps most of this air should be vented out the back of the card rather than inside your case. This design of the IceQ cooler should prove to be very effective for CrossFireX setups although it is just speculation as I only have the one card.
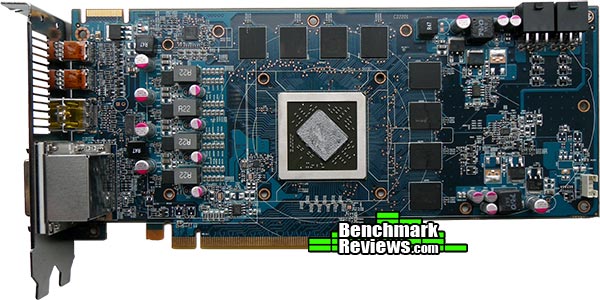
The back of the PCB is utilised mainly for resistors and the soldering quality is excellent for such tiny components. Man loses the war to the machine when it comes to detailed work like this. These days you don't generally see RAM on the reverse side of a 1GB video card design thanks to the smaller manufacturing process that allows more density in a smaller package. We also notice that the HIS Radeon HD6870 IceQ 1GB has a reinforcement bar attached, this stops the PCB flexing out of shape with the weight of the cooler pulling down on it 24/7.
With the cooler assembly and other heatsinks fully removed we can get a better look at the board, The overall layout of all the components is a little different with the 6000 series. The standard layout has moved the power phase/VRM section to the left hand side of the GPU, into an area that is normally left somewhat unoccupied. All in all the PCB looks good with no real waste of space and the soldering quality is of a very high standard.
The HIS Radeon HD6870 IceQ video card uses 1GB of Elpida W1032BBBG-50-F GDDR5 Memory rated 1250MHz (5GHz effective) at 1.5V.
For voltage control HIS have utilized a CHiL CHL82414-01 Dual output 4+1 phase PWM Controller. Below is a snippet from the product description. The CHL8212/13/14 are dual-loop digital multi-phase buck controllers and the CHL8203 is a single-loop digital multiphase buck controller designed for GPU voltage regulation. Dynamic voltage control is provided by registers which are programmed through I2C and then selected using a 3-bit parallel bus for fast access. The CHL8203/12/13/14 include CHiL Efficiency Shaping Technology to deliver exceptional efficiency at minimum cost across the entire load range. CHiL Dynamic Phase Control adds/drops active phases based upon load current and can be configured to enter 1-phase operation and diode emulation mode automatically or by command. SOURCE: chilsemi.com HIS Radeon HD6870 IceQ 1GB Features
|
||||||||||||||||||||||||||||||||||||||||||||||||||||||||||||||||||||||||||||||||||||||||||||||||||||||||||||||||||||||||||||||||||||||||||||||||||||||||||||||||||||||||||||||||||||||||||||||||||||||||||||||||||||||||||||||||||||||||||||||||||||||||||||||||||||||||||||||||||||||||||||||||||||||||||||||||||||||||||||||||||||||||||||||||||||||||||||||||||||||||||||||||||||||||||||||||||||||||||||||||||||||||||||||||||||||||||||||||||||||||||||||||||||||||||||||||||||||||||||||||||||||||||||||||||||||||||||||||||||||||||||||||||||||||||||||||||||||||||||||||||||||||||||||||||||||||||||||||||||||||||||||||||||||||||||||||||||||||||||||||||||||||||||||||||||||||||||||||||||||||||||||||||||||||||||||||||||||||||||||||||||||||||||||||||||||||||||||||||||||


 HIS Radeon HD6870 IceQ 1GB Features
| Product Code | H687Q1G2M | |
| Model Name | HIS 6870 IceQ 1GB GDDR5 PCI-E HDMI/2xDVI/2xMini DP | |
| Cooler | IceQ | |
| Chipset | Radeon HD 6870 PCIe Series | |
| Stream Processors | 1120 units | |
| Core Clock | 900MHz | |
| Memory Clock | 4200MHz | |
| Memory Size | 1024 MB GDDR5 | |
| Memory Bus | 256 bits | |
| Bandwidth | 134.4 GB/s | |
| Interface | PCI Express x16 (PCI Express 2.1) | |
| Output | Mini DisplayPort*2 / HDMI / SL DVI-D / DL DVI-I | |
| Card Dimensions | 13.8 x 4.6 x 28.7 cm (HxWxD) | |
| Max Resolution | 2560*1600 (Single Display) | |
| Power Supply Requirement | 500 Watt or greater power | |
| DirectX | 11 | |
| OpenGL | 4.0 | |
| CrossfireX | Y | |
| Eyefinity | Y | |
| AMD HD3D | Y | |
| AMD Eye Speed | Y | |
| HDCP Support | Y |
Source: hisdigital.com
VGA Testing Methodology
The Microsoft DirectX-11 graphics API is native to the Microsoft Windows 7 Operating System, and will be the primary O/S for our test platform. DX11 is also available as a Microsoft Update for the Windows Vista O/S, so our test results apply to both versions of the Operating System. The majority of benchmark tests used in this article are comparative to DX11 performance, however some high-demand DX10 tests have also been included.
According to the Steam Hardware Survey published for the month ending April 2011, the most popular gaming resolution is 1920x1080 with 1680x1050 hot on its heels, our benchmark performance tests concentrate on these higher-demand resolutions: 1.76MP 1680x1050 and 2.07MP 1920x1080 (22-24" widescreen LCD monitors), as they are more likely to be used by high-end graphics solutions, such as those tested in this article.
In each benchmark test there is one 'cache run' that is conducted, followed by five recorded test runs. Results are collected at each setting with the highest and lowest results discarded. The remaining three results are averaged, and displayed in the performance charts on the following pages.
A combination of synthetic and video game benchmark tests have been used in this article to illustrate relative performance among graphics solutions. Our benchmark frame rate results are not intended to represent real-world graphics performance, as this experience would change based on supporting hardware and the perception of individuals playing the video game.

Intel P55 Test System
- Motherboard: ECS P55H-AK (Intel P55)
- System Memory: 4GB OCZ Blade ST 2000MHz
- Processor: Core i5 760 @ 4.0GHz
- Disk Drive 1: OCZ Vertex 2 60GB
- Disk Drive 2: Seagate Barracuda 7200.12 1TB
- Enclosure: Thermaltake Overseer RX-I
- PSU: Corsair HX750W 750 watt Modular
- Monitor: HKC 22" Widescreen (1920x1080)
- Operating System: Windows 7 Ultimate x64 (SP1)
DirectX-10 Benchmark Applications
- 3DMark Vantage v1.02
- Extreme Settings: (Extreme Quality, 8x Multisample Anti-Aliasing, 16x Anisotropic Filtering, 1:2 Scale)
- Street Fighter IV Benchmark
- Extreme Settings: (Very High Quality, 8x AA, 16x AF, Parallel rendering On, Shadows High)
DirectX-11 Benchmark Applications
- Aliens vs Predator
- Extreme Settings: (Very High Quality, 4x AA, 16x AF, SSAO, Tessellation, Advanced Shadows)
- BattleField: Bad Company 2
- Extreme Settings: (Highest Quality, HBAO, 8x AA, 16x AF, 180s Fraps Single-Player Intro Scene)
- BattleForge v1.2
- Extreme Settings: (Very High Quality, 8x Anti-Aliasing, Auto Multi-Thread)
- Lost Planet 2
- Extreme Settings: (2x AA, Low Shadow Detail, High Texture, High Render, High DirectX 11 Features)
- Tom Clancy's HAWX 2 Benchmark 1.0.4
- Extreme Settings: (Maximum Quality, 8x AA, 16x AF, DX11 Terrain Tessellation)
- Metro 2033
- Extreme Settings: (Very-High Quality, AAA, 16x AF, Advanced DoF, Tessellation, 180s Fraps Chase Scene)
- Unigine Heaven Benchmark 2.1
- Extreme Settings: (High Quality, Normal Tessellation, 16x AF, 4x AA)
Video Card Test Products
| Graphics Card | Radeon HD6850 |
GeForce GTX 460 (OC) |
HIS Radeon HD6870 IceQ 1GB |
HIS Radeon HD6870 X Turbo X |
GeForce GTX 560Ti |
Radeon HD6950 |
| GPU Cores | 960 | 336 | 1120 | 1120 | 384 | 1408 |
| Core Clock (MHz) | 775 | 715 | 900 | 975 | 822 | 800 |
| Shader Clock (MHz) | N/A | 1430 | N/A | N/A | 1645 | N/A |
| Memory Clock (MHz) | 1000 | 900 | 1050 | 1150 | 1002 | 1250 |
| Memory Amount | 1024MB GDDR5 | 1024MB GDDR5 | 1024MB GDDR5 | 1024MB GDDR5 | 1024MB GDDR5 | 2048MB GDDR5 |
| Memory Interface | 256-bit | 256-bit | 256-bit | 256-bit | 256-bit | 256-bit |
DX10: 3DMark Vantage
3DMark Vantage is a PC benchmark suite designed to test the DirectX10 graphics card performance. FutureMark 3DMark Vantage is the latest addition the 3DMark benchmark series built by FutureMark corporation. Although 3DMark Vantage requires NVIDIA PhysX to be installed for program operation, only the CPU/Physics test relies on this technology.
3DMark Vantage offers benchmark tests focusing on GPU, CPU, and Physics performance. Benchmark Reviews uses the two GPU-specific tests for grading video card performance: Jane Nash and New Calico. These tests isolate graphical performance, and remove processor dependence from the benchmark results.
- 3DMark Vantage v1.02
- Extreme Settings: (Extreme Quality, 8x Multisample Anti-Aliasing, 16x Anisotropic Filtering, 1:2 Scale)
3DMark Vantage GPU Test: Jane Nash
Of the two GPU tests 3DMark Vantage offers, the Jane Nash performance benchmark is slightly less demanding. In a short video scene the special agent escapes a secret lair by water, nearly losing her shirt in the process. Benchmark Reviews tests this DirectX-10 scene at 1680x1050 and 1920x1080 resolutions, and uses Extreme quality settings with 8x anti-aliasing and 16x anisotropic filtering. The 1:2 scale is utilized, and is the highest this test allows. By maximizing the processing levels of this test, the scene creates the highest level of graphical demand possible and sorts the strong from the weak.

Cost Analysis: Jane Nash (1680x1050)
Test Summary: In the charts and the cost analysis you will notice that the HIS HD6870 IceQ 1GB does not fare so well. For the same price you can get the slightly faster HIS HD6870 X Turbo X variant, or you could simply push this card to the same clock speeds using MSI Afterburner to match it.
3DMark Vantage GPU Test: New Calico
New Calico is the second GPU test in the 3DMark Vantage test suite. Of the two GPU tests, New Calico is the most demanding. In a short video scene featuring a galactic battleground, there is a massive display of busy objects across the screen. Benchmark Reviews tests this DirectX-10 scene at 1680x1050 and 1920x1080 resolutions, and uses Extreme quality settings with 8x anti-aliasing and 16x anisotropic filtering. The 1:2 scale is utilized, and is the highest this test allows. Using the highest graphics processing level available allows our test products to separate themselves and stand out (if possible).

Cost Analysis: New Calico (1680x1050)
Test Summary: The tables have turned in the New Calico Vantage test, here the results show that the FERMI architecture is the more advanced. The performance scaling is as expected, the HIS Radeon HD6870 IceQ 1GB has a nice performance lead over its 6850 counterpart but fails to offer better value when we analyse the cost per FPS results of the two cards. The HIS HD6870 is unable to meet or match the performance or cost ratio of the HD6950 or the GTX 560Ti, instead performing in line with the GTX 460.
| Graphics Card | Radeon HD6850 |
GeForce GTX 460 (OC) |
HIS Radeon HD6870 IceQ 1GB |
HIS Radeon HD6870 X Turbo X |
GeForce GTX 560Ti |
Radeon HD6950 |
| GPU Cores | 960 | 336 | 1120 | 1120 | 384 | 1408 |
| Core Clock (MHz) | 775 | 715 | 900 | 975 | 822 | 800 |
| Shader Clock (MHz) | N/A | 1430 | N/A | N/A | 1645 | N/A |
| Memory Clock (MHz) | 1000 | 900 | 1050 | 1150 | 1002 | 1250 |
| Memory Amount | 1024MB GDDR5 | 1024MB GDDR5 | 1024MB GDDR5 | 1024MB GDDR5 | 1024MB GDDR5 | 2048MB GDDR5 |
| Memory Interface | 256-bit | 256-bit | 256-bit | 256-bit | 256-bit | 256-bit |
DX10: Street Fighter IV
Capcom's Street Fighter IV is part of the now-famous Street Fighter series that began in 1987. The 2D Street Fighter II was one of the most popular fighting games of the 1990s, and now gets a 3D face-lift to become Street Fighter 4. The Street Fighter 4 benchmark utility was released as a novel way to test your system's ability to run the game. It uses a few dressed-up fight scenes where combatants fight against each other using various martial arts disciplines. Feet, fists and magic fill the screen with a flurry of activity. Due to the rapid pace, varied lighting and the use of music this is one of the more enjoyable benchmarks. Street Fighter IV uses a proprietary Capcom SF4 game engine, which is enhanced over previous versions of the game.
Using the highest quality DirectX-10 settings with 8x AA and 16x AF, a mid to high end card will ace this test, but it will still weed out the slower cards out there.
- Street Fighter IV Benchmark
- Extreme Settings: (Very High Quality, 8x AA, 16x AF, Parallel rendering On, Shadows High)

Cost Analysis: Street Fighter IV (1680x1050)
Test Summary: The Street Fighter IV test comes across a little biased towards the green team, perhaps the good old 'NVIDIA The way it's meant to be played' logo displayed when you launch the benchmark gives that away. As you will see later in the performance analysis, this analogy is turned on its head when a game that was touted as a NVIDIA game (METRO 2033)actually performs better on AMD hardware when PhysX is disabled. Street Fighter IV is a very fast paced game but the HIS Radeon HD6870 IceQ 1GB is simply overkill.
| Graphics Card | Radeon HD6850 |
GeForce GTX 460 (OC) |
HIS Radeon HD6870 IceQ 1GB |
HIS Radeon HD6870 X Turbo X |
GeForce GTX 560Ti |
Radeon HD6950 |
| GPU Cores | 960 | 336 | 1120 | 1120 | 384 | 1408 |
| Core Clock (MHz) | 775 | 715 | 900 | 975 | 822 | 800 |
| Shader Clock (MHz) | N/A | 1430 | N/A | N/A | 1645 | N/A |
| Memory Clock (MHz) | 1000 | 900 | 1050 | 1150 | 1002 | 1250 |
| Memory Amount | 1024MB GDDR5 | 1024MB GDDR5 | 1024MB GDDR5 | 1024MB GDDR5 | 1024MB GDDR5 | 2048MB GDDR5 |
| Memory Interface | 256-bit | 256-bit | 256-bit | 256-bit | 256-bit | 256-bit |
DX11: Aliens vs Predator
Aliens vs. Predator is a science fiction first-person shooter video game, developed by Rebellion, and published by Sega for Microsoft Windows, Sony PlayStation 3, and Microsoft Xbox 360. Aliens vs. Predator utilizes Rebellion's proprietary Asura game engine, which had previously found its way into Call of Duty: World at War and Rogue Warrior. The self-contained benchmark tool is used for our DirectX-11 tests, which push the Asura game engine to its limit.
In our benchmark tests, Aliens vs. Predator was configured to use the highest quality settings with 4x AA and 16x AF. DirectX-11 features such as Screen Space Ambient Occlusion (SSAO) and tessellation have also been included, along with advanced shadows.
- Aliens vs Predator
- Extreme Settings: (Very High Quality, 4x AA, 16x AF, SSAO, Tessellation, Advanced Shadows)

Cost Analysis: Aliens vs Predator (1680x1050)
Test Summary: In the Alien vs Predator benchmark it is the turn of the AMD hardware to show what it is made of. The HIS HD6870 is able to beat a stock GTX 560Ti. If this is your sort of game you would be best to own an AMD card. The HIS Radeon HD6870 IceQ 1GB handles its own, and delivers above average frame rates at both resolutions.
| Graphics Card | Radeon HD6850 |
GeForce GTX 460 (OC) |
HIS Radeon HD6870 IceQ 1GB |
HIS Radeon HD6870 X Turbo X |
GeForce GTX 560Ti |
Radeon HD6950 |
| GPU Cores | 960 | 336 | 1120 | 1120 | 384 | 1408 |
| Core Clock (MHz) | 775 | 715 | 900 | 975 | 822 | 800 |
| Shader Clock (MHz) | N/A | 1430 | N/A | N/A | 1645 | N/A |
| Memory Clock (MHz) | 1000 | 900 | 1050 | 1150 | 1002 | 1250 |
| Memory Amount | 1024MB GDDR5 | 1024MB GDDR5 | 1024MB GDDR5 | 1024MB GDDR5 | 1024MB GDDR5 | 2048MB GDDR5 |
| Memory Interface | 256-bit | 256-bit | 256-bit | 256-bit | 256-bit | 256-bit |
DX11: Battlefield Bad Company 2
The Battlefield franchise has been known to demand a lot from PC graphics hardware. DICE (Digital Illusions CE) has incorporated their Frostbite-1.5 game engine with Destruction-2.0 feature set with Battlefield: Bad Company 2. Battlefield: Bad Company 2 features destructible environments using Frostbit Destruction-2.0, and adds gravitational bullet drop effects for projectiles shot from weapons at a long distance. The Frostbite-1.5 game engine used on Battlefield: Bad Company 2 consists of DirectX-10 primary graphics, with improved performance and softened dynamic shadows added for DirectX-11 users.
At the time Battlefield: Bad Company 2 was published, DICE was also working on the Frostbite-2.0 game engine. This upcoming engine will include native support for DirectX-10.1 and DirectX-11, as well as parallelized processing support for 2-8 parallel threads. This will improve performance for users with an Intel Core-i7 processor. Unfortunately, the Extreme Edition Intel Core i7-980X six-core CPU with twelve threads will not see full utilization.
In our benchmark tests of Battlefield: Bad Company 2, the first three minutes of action in the single-player raft night scene are captured with FRAPS. Relative to the online multiplayer action, these frame rate results are nearly identical to daytime maps with the same video settings. The Frostbite-1.5 game engine in Battlefield: Bad Company 2 appears to equalize our test set of video cards, and despite AMD's sponsorship of the game it still plays well using any brand of graphics card.
- BattleField: Bad Company 2
- Extreme Settings: (Highest Quality, HBAO, 8x AA, 16x AF, 180s Fraps Single-Player Intro Scene)

Cost Analysis: Battlefield: Bad Company 2 (1680x1050)
Test Summary: As DirectX 11 titles go, Battlefield: Bad Company 2 is not the most demanding. Even the lower end GTX 460 and HD6850 can deliver above average frame rates. The good news is that you can rest assured that your video card won't be the cause of your lag in this game.
| Graphics Card | Radeon HD6850 |
GeForce GTX 460 (OC) |
HIS Radeon HD6870 IceQ 1GB |
HIS Radeon HD6870 X Turbo X |
GeForce GTX 560Ti |
Radeon HD6950 |
| GPU Cores | 960 | 336 | 1120 | 1120 | 384 | 1408 |
| Core Clock (MHz) | 775 | 715 | 900 | 975 | 822 | 800 |
| Shader Clock (MHz) | N/A | 1430 | N/A | N/A | 1645 | N/A |
| Memory Clock (MHz) | 1000 | 900 | 1050 | 1150 | 1002 | 1250 |
| Memory Amount | 1024MB GDDR5 | 1024MB GDDR5 | 1024MB GDDR5 | 1024MB GDDR5 | 1024MB GDDR5 | 2048MB GDDR5 |
| Memory Interface | 256-bit | 256-bit | 256-bit | 256-bit | 256-bit | 256-bit |
DX11: BattleForge
BattleForge is free Massive Multiplayer Online Role Playing Game (MMORPG) developed by EA Phenomic with DirectX-11 graphics capability. Combining strategic cooperative battles, the community of MMO games, and trading card gameplay, BattleForge players are free to put their creatures, spells and buildings into combination's they see fit. These units are represented in the form of digital cards from which you build your own unique army. With minimal resources and a custom tech tree to manage, the gameplay is unbelievably accessible and action-packed.
Benchmark Reviews uses the built-in graphics benchmark to measure performance in BattleForge, using Very High quality settings and 8x anti-aliasing with auto multi-threading enabled. BattleForge is one of the first titles to take advantage of DirectX-11 in Windows 7, and offers a very robust color range throughout the busy battleground landscape. The charted results illustrate how performance measures-up between video cards when Screen Space Ambient Occlusion (SSAO) is enabled.
- BattleForge v1.2
- Extreme Settings: (Very High Quality, 8x Anti-Aliasing, Auto Multi-Thread)

Cost Analysis: BattleForge (1680x1050)
Test Summary: Battleforge with all the settings cranked up looks very nice indeed, once again the GTX 560Ti result sticks out like a sore thumb. The HIS Radeon HD6870 IceQ 1GB delivers some respectable frame rates and cost per FPS is right on the money, the question now is... How much power does one need?
| Graphics Card | Radeon HD6850 |
GeForce GTX 460 (OC) |
HIS Radeon HD6870 IceQ 1GB |
HIS Radeon HD6870 X Turbo X |
GeForce GTX 560Ti |
Radeon HD6950 |
| GPU Cores | 960 | 336 | 1120 | 1120 | 384 | 1408 |
| Core Clock (MHz) | 775 | 715 | 900 | 975 | 822 | 800 |
| Shader Clock (MHz) | N/A | 1430 | N/A | N/A | 1645 | N/A |
| Memory Clock (MHz) | 1000 | 900 | 1050 | 1150 | 1002 | 1250 |
| Memory Amount | 1024MB GDDR5 | 1024MB GDDR5 | 1024MB GDDR5 | 1024MB GDDR5 | 1024MB GDDR5 | 2048MB GDDR5 |
| Memory Interface | 256-bit | 256-bit | 256-bit | 256-bit | 256-bit | 256-bit |
DX11: Lost Planet 2
Lost Planet 2 is the second instalment in the saga of the planet E.D.N. III, ten years after the story of Lost Planet: Extreme Condition. The snow has melted and the lush jungle life of the planet has emerged with angry and luscious flora and fauna. With the new environment comes the addition of DirectX-11 technology to the game.
Lost Planet 2 takes advantage of DX11 features including tessellation and displacement mapping on water, level bosses, and player characters. In addition, soft body compute shaders are used on 'Boss' characters, and wave simulation is performed using DirectCompute. These cutting edge features make for an excellent benchmark for top-of-the-line consumer GPUs.
The Lost Planet 2 benchmark offers two different tests, which serve different purposes. This article uses tests conducted on benchmark B, which is designed to be a deterministic and effective benchmark tool featuring DirectX 11 elements.
- Lost Planet 2 Benchmark 1.0
- Moderate Settings: (2x AA, Low Shadow Detail, High Texture, High Render, High DirectX 11 Features)

Cost Analysis: Lost Planet 2 (1680x1050)
Test Summary: Lost Planet 2 is a tough cookie to crack, in our tests we had to use relatively moderate settings just to get some acceptable numbers. This game wants high level hardware to play maxed out. The overclocked HIS Radeon HD6870 IceQ 1GB delivers average frame rates at a mid/high cost/performance ratio.
| Graphics Card | Radeon HD6850 |
GeForce GTX 460 (OC) |
HIS Radeon HD6870 IceQ 1GB |
HIS Radeon HD6870 X Turbo X |
GeForce GTX 560Ti |
Radeon HD6950 |
| GPU Cores | 960 | 336 | 1120 | 1120 | 384 | 1408 |
| Core Clock (MHz) | 775 | 715 | 900 | 975 | 822 | 800 |
| Shader Clock (MHz) | N/A | 1430 | N/A | N/A | 1645 | N/A |
| Memory Clock (MHz) | 1000 | 900 | 1050 | 1150 | 1002 | 1250 |
| Memory Amount | 1024MB GDDR5 | 1024MB GDDR5 | 1024MB GDDR5 | 1024MB GDDR5 | 1024MB GDDR5 | 2048MB GDDR5 |
| Memory Interface | 256-bit | 256-bit | 256-bit | 256-bit | 256-bit | 256-bit |
DX11: Tom Clancy's HAWX 2
Tom Clancy's H.A.W.X.2 has been optimized for DX11 enabled GPUs and has a number of enhancements to not only improve performance with DX11 enabled GPUs, but also greatly improve the visual experience while taking to the skies. The game uses a hardware terrain tessellation method that allows a high number of detailed triangles to be rendered entirely on the GPU when near the terrain in question. This allows for a very low memory footprint and relies on the GPU power alone to expand the low resolution data to highly realistic detail.
The Tom Clancy's HAWX2 benchmark uses normal game content in the same conditions a player will find in the game, and allows users to evaluate the enhanced visuals that DirectX-11 tessellation adds into the game. The Tom Clancy's HAWX2 benchmark is built from exactly the same source code that's included with the retail version of the game. HAWX2's tessellation scheme uses a metric based on the length in pixels of the triangle edges. This value is currently set to 6 pixels per triangle edge, which provides an average triangle size of 18 pixels.
The end result is perhaps the best tessellation implementation seen in a game yet, providing a dramatic improvement in image quality over the non-tessellated case, and running at playable frame rates across a wide range of graphics hardware.
- Tom Clancy's HAWX 2 Benchmark 1.0.4
- Extreme Settings: (Maximum Quality, 8x AA, 16x AF, DX11 Terrain Tessellation)

Cost Analysis: HAWX 2 (1680x1050)
Test Summary: HAWX 2 is a strange game in that you need to look very close to see the difference in quality settings, the main difference is in the terrain but this is easily overlooked as you are busy fighting with the controls just to fly in a straight line. The GTX 560Ti pummels on all of the video cards in this line up, beating them in both FPS performance and price per FPS, but all of the other cards also deliver excellent frame rates. The landscapes are beautifully rendered making the game scenery pleasurable, now I just need to master the controls.
| Graphics Card | Radeon HD6850 |
GeForce GTX 460 (OC) |
HIS Radeon HD6870 IceQ 1GB |
HIS Radeon HD6870 X Turbo X |
GeForce GTX 560Ti |
Radeon HD6950 |
| GPU Cores | 960 | 336 | 1120 | 1120 | 384 | 1408 |
| Core Clock (MHz) | 775 | 715 | 900 | 975 | 822 | 800 |
| Shader Clock (MHz) | N/A | 1430 | N/A | N/A | 1645 | N/A |
| Memory Clock (MHz) | 1000 | 900 | 1050 | 1150 | 1002 | 1250 |
| Memory Amount | 1024MB GDDR5 | 1024MB GDDR5 | 1024MB GDDR5 | 1024MB GDDR5 | 1024MB GDDR5 | 2048MB GDDR5 |
| Memory Interface | 256-bit | 256-bit | 256-bit | 256-bit | 256-bit | 256-bit |
DX11: Metro 2033
Metro 2033 is an action-oriented video game with a combination of survival horror, and first-person shooter elements. The game is based on the novel Metro 2033 by Russian author Dmitry Glukhovsky. It was developed by 4A Games in Ukraine and released in March 2010 for Microsoft Windows. Metro 2033 uses the 4A game engine, developed by 4A Games. The 4A Engine supports DirectX-9, 10, and 11, along with NVIDIA PhysX and GeForce 3D Vision.
The 4A engine is multi-threaded in such that only PhysX had a dedicated thread, and uses a task-model without any pre-conditioning or pre/post-synchronizing, allowing tasks to be done in parallel. The 4A game engine can utilize a deferred shading pipeline, and uses tessellation for greater performance, and also has HDR (complete with blue shift), real-time reflections, color correction, film grain and noise, and the engine also supports multi-core rendering.
Metro 2033 featured superior volumetric fog, double PhysX precision, object blur, sub-surface scattering for skin shaders, parallax mapping on all surfaces and greater geometric detail with a less aggressive LODs. Using PhysX, the engine uses many features such as destructible environments, and cloth and water simulations, and particles that can be fully affected by environmental factors.
NVIDIA has been diligently working to promote Metro 2033, and for good reason: it's one of the most demanding PC video games we've ever tested. When their flagship GeForce GTX 480 struggles to produce 27 FPS with DirectX-11 anti-aliasing turned to to its lowest setting, you know that only the strongest graphics processors will generate playable frame rates. All of our tests enable Advanced Depth of Field and Tessellation effects, but disable advanced PhysX options.
- Metro 2033
- Moderate Settings: (Very-High Quality, AAA, 16x AF, Advanced DoF, Tessellation, 180s Fraps Chase Scene)

Cost Analysis: Metro 2033 (1680x1050)
Test Summary: Metro 2033 is hard on all video cards, and in our tests only the factory overclocked video cards delivered acceptable frame rates. It is also rather apparent that the AMD GPU's deliver better performance across the board when compared to their theoretical rivals, another win for the overclocked HIS Radeon HD6870 IceQ 1GB. This game was intended to be played with PhysX enabled and we all know this is something only NVIDIA cards can do well at the moment, hopefully in the future we might see PhysX code that is better optimized for multi-core CPU's.
| Graphics Card | Radeon HD6850 |
GeForce GTX 460 (OC) |
HIS Radeon HD6870 IceQ 1GB |
HIS Radeon HD6870 X Turbo X |
GeForce GTX 560Ti |
Radeon HD6950 |
| GPU Cores | 960 | 336 | 1120 | 1120 | 384 | 1408 |
| Core Clock (MHz) | 775 | 715 | 900 | 975 | 822 | 800 |
| Shader Clock (MHz) | N/A | 1430 | N/A | N/A | 1645 | N/A |
| Memory Clock (MHz) | 1000 | 900 | 1050 | 1150 | 1002 | 1250 |
| Memory Amount | 1024MB GDDR5 | 1024MB GDDR5 | 1024MB GDDR5 | 1024MB GDDR5 | 1024MB GDDR5 | 2048MB GDDR5 |
| Memory Interface | 256-bit | 256-bit | 256-bit | 256-bit | 256-bit | 256-bit |
DX11: Unigine Heaven 2.1
The Unigine Heaven 2.1 benchmark is a free publicly available tool that grants the power to unleash the graphics capabilities in DirectX-11 for Windows 7 or updated Vista Operating Systems. It reveals the enchanting magic of floating islands with a tiny village hidden in the cloudy skies. With the interactive mode, emerging experience of exploring the intricate world is within reach. Through its advanced renderer, Unigine is one of the first to set precedence in showcasing the art assets with tessellation, bringing compelling visual finesse, utilizing the technology to the full extent and exhibiting the possibilities of enriching 3D gaming.
The distinguishing feature in the Unigine Heaven benchmark is a hardware tessellation that is a scalable technology aimed for automatic subdivision of polygons into smaller and finer pieces, so that developers can gain a more detailed look of their games almost free of charge in terms of performance. Thanks to this procedure, the elaboration of the rendered image finally approaches the boundary of veridical visual perception: the virtual reality transcends conjured by your hand.
Although Heaven-2.1 was recently released and used for our DirectX-11 tests, the benchmark results were extremely close to those obtained with Heaven-1.0 testing. Since only DX11-compliant video cards will properly test on the Heaven benchmark, only those products that meet the requirements have been included.
- Unigine Heaven Benchmark 2.1
- Extreme Settings: (High Quality, Normal Tessellation, 16x AF, 4x AA)

Cost Analysis: Unigine Heaven (1680x1050)
Test Summary: Unigine heaven is also quite hard on video cards; only the best video cards will be able to run it smooth at the highest settings, certain parts of this benchmark put more work on the GPU than others. With the exception of the GTX 460 and GTX 560Ti results we see nearly perfect scaling in the line-up. The higher core count of the HD6950 GPU certainly makes a lot of difference in our tests.
In the following sections we will report our findings on power consumption and overclocking.
| Graphics Card | Radeon HD6850 |
GeForce GTX 460 (OC) |
HIS Radeon HD6870 IceQ 1GB |
HIS Radeon HD6870 X Turbo X |
GeForce GTX 560Ti |
Radeon HD6950 |
| GPU Cores | 960 | 336 | 1120 | 1120 | 384 | 1408 |
| Core Clock (MHz) | 775 | 715 | 900 | 975 | 822 | 800 |
| Shader Clock (MHz) | N/A | 1430 | N/A | N/A | 1645 | N/A |
| Memory Clock (MHz) | 1000 | 900 | 1050 | 1150 | 1002 | 1250 |
| Memory Amount | 1024MB GDDR5 | 1024MB GDDR5 | 1024MB GDDR5 | 1024MB GDDR5 | 1024MB GDDR5 | 2048MB GDDR5 |
| Memory Interface | 256-bit | 256-bit | 256-bit | 256-bit | 256-bit | 256-bit |
HIS Radeon HD6870 IceQ 1GB Temperatures
Benchmark tests are always nice, so long as you care about comparing one product to another. But when you're an overclocker, gamer, or merely a PC hardware enthusiast who likes to tweak things on occasion, there's no substitute for good information. Benchmark Reviews has a very popular guide written on Overclocking Video Cards, which gives detailed instruction on how to tweak graphics cards for better performance. Of course, not every video card has overclocking head room. Some products run so hot that they can't suffer any higher temperatures than they already do. This is why we measure the operating temperature of the video card products we test.
To begin my testing, I use GPU-Z to measure the temperature at idle as reported by the GPU. Next I use FurMark's "Torture Test" to generate maximum thermal load and record GPU temperatures at high-power 3D mode. The ambient room temperature remained at a stable 25°C throughout testing. FurMark does two things extremely well: drive the thermal output of any graphics processor higher than applications of video games realistically could, and it does so with consistency every time. Furmark works great for testing the stability of a GPU as the temperature rises to the highest possible output. The temperatures discussed below are absolute maximum values, and not representative of real-world performance.

As previously stated my ambient temperature remained at a stable 25°C throughout the testing procedure, the cooler is quite efficient and a heavy load from FurMark raises the temperature from 41°C idle (45% fan speed) to only 64°C load with an automatic fan speed of 61%. Putting the fan on manual and cranking it up to 100% saw the temperature drop to 61°C. The noise level at max speed is still bearable but for 3°C improvement in temperature I would just stick to the auto fan profile.
In the next section we will look at power consumption figures, let's go.
VGA Power Consumption
Life is not as affordable as it used to be, and items such as gasoline, natural gas, and electricity all top the list of resources which have exploded in price over the past few years. Add to this the limit of non-renewable resources compared to current demands, and you can see that the prices are only going to get worse. Planet Earth is needs our help, and needs it badly. With forests becoming barren of vegetation and snow capped poles quickly turning brown, the technology industry has a new attitude towards turning "green". I'll spare you the powerful marketing hype that gets sent from various manufacturers every day, and get right to the point: your computer hasn't been doing much to help save energy... at least up until now.
For power consumption tests, Benchmark Reviews utilizes an 80-Plus Gold rated Corsair HX750w (model: CMPSU-750HX) This power supply unit has been tested to provide over 90% typical efficiency by Ecos Plug Load Solutions. To measure isolated video card power consumption, I used the energenie ENER007 power meter made by Sandal Plc (UK).
A baseline test is taken without a video card installed inside our test computer system, which is allowed to boot into Windows-7 and rest idle at the login screen before power consumption is recorded. Once the baseline reading has been taken, the graphics card is installed and the system is again booted into Windows and left idle at the login screen. Our final loaded power consumption reading is taken with the video card running a stress test using FurMark. Below is a chart with the isolated video card power consumption (not system total) displayed in Watts for each specified test product:
VGA Product Description(sorted by combined total power) |
Idle Power |
Loaded Power |
|---|---|---|
NVIDIA GeForce GTX 480 SLI Set |
82 W |
655 W |
NVIDIA GeForce GTX 590 Reference Design |
53 W |
396 W |
ATI Radeon HD 4870 X2 Reference Design |
100 W |
320 W |
AMD Radeon HD 6990 Reference Design |
46 W |
350 W |
NVIDIA GeForce GTX 295 Reference Design |
74 W |
302 W |
ASUS GeForce GTX 480 Reference Design |
39 W |
315 W |
ATI Radeon HD 5970 Reference Design |
48 W |
299 W |
NVIDIA GeForce GTX 690 Reference Design |
25 W |
321 W |
ATI Radeon HD 4850 CrossFireX Set |
123 W |
210 W |
ATI Radeon HD 4890 Reference Design |
65 W |
268 W |
AMD Radeon HD 7970 Reference Design |
21 W |
311 W |
NVIDIA GeForce GTX 470 Reference Design |
42 W |
278 W |
NVIDIA GeForce GTX 580 Reference Design |
31 W |
246 W |
NVIDIA GeForce GTX 570 Reference Design |
31 W |
241 W |
ATI Radeon HD 5870 Reference Design |
25 W |
240 W |
ATI Radeon HD 6970 Reference Design |
24 W |
233 W |
NVIDIA GeForce GTX 465 Reference Design |
36 W |
219 W |
NVIDIA GeForce GTX 680 Reference Design |
14 W |
243 W |
Sapphire Radeon HD 4850 X2 11139-00-40R |
73 W |
180 W |
NVIDIA GeForce 9800 GX2 Reference Design |
85 W |
186 W |
NVIDIA GeForce GTX 780 Reference Design |
10 W |
275 W |
NVIDIA GeForce GTX 770 Reference Design |
9 W |
256 W |
NVIDIA GeForce GTX 280 Reference Design |
35 W |
225 W |
NVIDIA GeForce GTX 260 (216) Reference Design |
42 W |
203 W |
ATI Radeon HD 4870 Reference Design |
58 W |
166 W |
NVIDIA GeForce GTX 560 Ti Reference Design |
17 W |
199 W |
NVIDIA GeForce GTX 460 Reference Design |
18 W |
167 W |
AMD Radeon HD 6870 Reference Design |
20 W |
162 W |
NVIDIA GeForce GTX 670 Reference Design |
14 W |
167 W |
ATI Radeon HD 5850 Reference Design |
24 W |
157 W |
NVIDIA GeForce GTX 650 Ti BOOST Reference Design |
8 W |
164 W |
AMD Radeon HD 6850 Reference Design |
20 W |
139 W |
NVIDIA GeForce 8800 GT Reference Design |
31 W |
133 W |
ATI Radeon HD 4770 RV740 GDDR5 Reference Design |
37 W |
120 W |
ATI Radeon HD 5770 Reference Design |
16 W |
122 W |
NVIDIA GeForce GTS 450 Reference Design |
22 W |
115 W |
NVIDIA GeForce GTX 650 Ti Reference Design |
12 W |
112 W |
ATI Radeon HD 4670 Reference Design |
9 W |
70 W |
At Idle the HIS Radeon HD6870 IceQ 1GB consumes 42 (161-119) watts at idle and 169 (288-119) watts when running full load using the test method outlined above. As we can see in the GPU-Z screenshot below the HIS Radeon HD6870 IceQ 1GB uses 0.945v when idle, when under load it uses 1.174v.

In the next section we will be discussing our overclocking session with the HIS Radeon HD6870 IceQ 1GB video card.
HIS Radeon HD6870 IceQ 1GB Overclocking
Before I start overclocking, I like to get a little bit of information. Firstly, I like to establish operating temperatures and since we know the IceQ cooler is quite capable we can quickly move forward. Next, I like to know what the voltage and clock limits are, so I fired up the MSI's Afterburner utility. I established that vCore was adjustable between 800mV and 1.30V. Clock speeds were limited to 1000MHz max on the GPU and 1250MHz (5GHz effective) maximum frequency for the memory. This is more than enough range to move forward with and I know I can squeeze every last drop of performance out of the HIS Radeon HD6870 IceQ 1GB. My preferred weapons are MSI Afterburner (v2.2.0 Beta 8) for fine tuning while using FurMark (v1.9.1) to heat the GPU.
More overclocking headroom could be unlocked for the GPU Core and Memory speeds using the unofficial overclocking method in MSI Afterburner, but I wasn't able to keep this card stable during testing when I went past the previous limits. I bumped the vCore to the max 1.30V and was able to push the clock speeds to 1000MHz GPU and 1250MHz (5GHz effective) Memory and still remain stable during the benchmarking run.
| Test Item | Standard GPU/RAM | Overclocked GPU/RAM | Improvement | |||
| HIS Radeon HD6870 IceQ 1GB | 900/1050 MHz | 1000/1250 MHz | 100/200 MHz | |||
| DX10: 3dMark Jane Nash | 27.60 | 32.17 |
4.57 FPS (16.55%) |
|||
| DX10: 3dMark Calico | 20.78 | 23.18 | 2.39 FPS (11.53%) | |||
| DX10: Street Fighter IV | 123.52 | 139.56 | 16.04 FPS (12.98%) | |||
| DX11: Aliens vs Predator | 34.13 | 39.03 | 4.89 FPS (14.34%) | |||
| DX11: Battlefield BC2 | 61.68 | 71.51 | 9.82 FPS (15.93%) | |||
| DX11: Lost Planet 2 | 30.70 | 36.70 | 6 FPS (19.54%) | |||
| DX11: Metro 2033 | 24.88 | 28.89 | 4 FPS (16.07%) | |||
| DX11: HAWX 2 | 76.66 | 82 | 5.33 FPS (6.95%) | |||
| DX11: Battle Forge | 41.80 | 47.93 | 6.13 FPS (14.66%) | |||
| DX11: Heaven 2.1 | 27.13 | 30.60 | 3.46 FPS (12.77%) |
With a 100MHz GPU overclock and a 200MHz memory overclock we went back to the bench and ran through the entire test suite. Overall there is an average 14.13% increase in scores (at 1920x1080 resolution). We also re-ran temperature tests at the overclocked speeds with an ambient temperature of 25°C. The IceQ cooler on the HIS HD6870 IceQ 1GB once again pulled through and gave some decent temperatures. At idle the GPU sat at 46°C (49% fan speed). Pushing the temperature up with FurMark saw the GPU load temperature rise to 78°C (76% fan speed) and cranking the fan on manual to 100% saw the temperature drop to 74°C.

Relative performance of HIS HD6870 IceQ X Turbo X
HIS HD6870 IceQ 1GB Final Thoughts
In the benchmark tests the HIS Radeon HD6870 IceQ 1GB was compared along side the faster HIS HD6870 IceQ X Turbo X reviewed earlier this year by us, which currently sells at the same price. In our review of the X Turbo X variant we noted that there were some issues with the GPU crashing due to a very relaxed fan profile. I am glad to say that these issues are not present with the HD6870 IceQ 1GB and the fan spins at the most optimal level possible, even under overclocking conditions.
The PCB design of the two HIS HD6870's are identical with a few minor variances in IC's, as such the overclocks are the extremely close between the two. There is 20MHz between core speeds and 10MHz between memory speeds, this means that for those who aren't afraid to venture then the choice only comes down to looks as both perform the same as each other when overclocked.

HIS Radeon HD6870 IceQ 1GB Conclusion
Important: In this section I am going to write a brief five point summary on the following categories; Performance, Appearance, Construction, Functionality and Value. These views are my own and help me to give the HIS Radeon HD6870 IceQ 1GB a rating out of 10. A high or low score does not necessarily mean that it is better or worse than a similar video card that has been reviewed by another writer here at Benchmark Reviews, which may have received a higher or lower score. It is however a good indicator of whether the HIS Radeon HD6870 IceQ 1GB is good or not. I would strongly urge you to read the entire review, if you have not already, so that you can make an educated decision for yourself.
The graphics performance of the HIS Radeon HD6870 1GB is good but it's real potential is only realised when you overclock it. In some of our tests it was able to match or come very close to the performance of the stock GTX 560Ti and then more so when it was overclocked. This card comes with reference card clock speeds but pushing it further requires little effort and the gains are plenty. Overclocking is always uncertain territory so we should be thankful that there is any headroom at all.
The HIS Radeon HD6870 IceQ 1GB looks like something from the past. As soon as I saw it I remembered my old ATI X1950 XTX. Thankfully though, it's not all for looks this time round (the X1950 XTX was a proper cooker) and the IceQ cooler works really well. I have long since thrown my UV lights in the trash so I couldn't tell you if this modern day shroud is UV reactive like the ones of yesteryear but being white will have an effect in itself anyway (if UV is your thing).
Construction is excellent as you would expect from a company with a good reputation like HIS, despite the use of plastic for the shroud the whole package feels quite solid. Taking the card to pieces and reconstructing it was a breeze and everything lined up perfectly, the IceQ heatsink is solid and really adds some weight and girth to the card which reassures you that it is no fragile piece of hardware.
Functionality-wise the HIS HD6870 IceQ 1GB acts as you would expect. The fan speed follows temperature changes promptly and delivers good and quiet cooling performance. The other great thing is that this model clocks up nicely too; +100MHz GPU core and +200MHz Memory is a very good overclock and the HIS HD6870 IceQ 1GB produced an excellent 14% average increase in benchmark scores becausee of this.
The HIS Radeon HD6870 IceQ 1GB video card model H687Q1G2M will cost you $199.99 at NewEgg and Amazon retailers. At this price point it sits directly between the good old NVIDIA GTX460 and the GTX 560Ti and falls between them performance-wise too. On average the HIS HD6870 IceQ X Turbo X costs $5.69/FPS in our benchmark tests, and I believe this to be a reasonable price to pay for a performance card like this.
I have no problems recommending this card to anyone who is in the market for a mid/high end card. For those that are worried about overclocking there is always the factory overclocked HIS HD6870 IceQ X Turbo X available at the same price.
Pros:
+ IceQ cooler is very good
+ Fan at 100% is not too loud
+ Excellent build quality
+ Exhausts out the PCI bracket not inside the case
+ Good value for money
+ CrossFireX Support
+ Clocks to 1GHz with ease
+ Variety of outputs: Display Port, DVI-I and HDMI
Cons:
- Very long for a HD6870 (287mm)
- Old school looking video card
- Bare copper heatpipes look out of place
- No factory overclock
Ratings:
- Performance: 8.50
- Appearance: 7.75
- Construction: 9.50
- Functionality: 9.50
- Value: 8.25
Final Score: 8.70 out of 10.
Recommended: Benchmark Reviews Seal of Approval.
Benchmark Reviews invites you to leave constructive feedback below, or ask questions in our Discussion Forum.
Related Articles:
- CM Storm Sentinel Advance II Gaming Mouse
- ADATA DashDrive Air AE400 Wireless Storage
- ASUS Eee 8G PC 8GB SSD Notebook
- Xigmatek Red Scorpion S1283 HDT CPU Cooler
- 6GB Kingston HyperX 2000MHz DDR3 Memory Kit
- Benchmark Reviews Has Moved To WordPress CMS!
- Silicon Power 64GB SATA Solid State Drive
- Antec Lanboy Air Open-Frame Case
- MSI 990FXA-GD80 AM3+ Motherboard
- Thermaltake Toughpower W0133RU 1200W Modular PSU

Comments
"A lot of people are speculating that the PC and PC gaming industry is dying but I beg to differ. I think the Tablet/Smartphone era is just a novelty phase. One problem lies with power delivery, and we all know that today's batteries just don't cut it when we want to use our devices for extended periods..."
Nowhere did he say that he himself agreed and actually said he disagreeed.
##gigabyte.com/products/product-page.aspx?pid=1928#sp
I wanted to put this graphics card on my system with full 4gb of RAM. I already updated the bios system to hande 2.1 PCIe. Would it work on my motherboard? How would it run if so?
Thank you
I was thinking about this HIS ice 6870 or this:
#newegg.com/Product/Product.aspx?Item=N82E16814102924
Which would you prefer? Or what other card would you consider?
Thanks
This is what I found that I think would go well:
#newegg.com/Product/Product.aspx?Item=N82E16814127608
"More overclocking headroom could be unlocked for the GPU Core and Memory speeds using the unofficial overclocking method in MSI Afterburner, but I wasn't able to keep this card stable during testing when I went past the previous limits. I bumped the vCore to the max 1.30V and was able to push the clock speeds to 1000MHz GPU and 1250MHz (5GHz effective) Memory and still remain stable during the benchmarking run."
#in.asus.com/Motherboards/Intel_Socket_1155/P8H67M_LX/
and wanted to know whether this graphics card would work on it .So will it work ?