| Overclocking the MSI N680GTX Lightning |
| Articles - Featured Guides | |||||||||||||||||||||||||||||||||||||||||||||||||||||||||||||||||||||||||||||||||||||||||||||||||||||||||||||||||||||||||||||||||||||||||||||||||||||||||||||||||||||||||||||||||||||||||||||||||||||||||||||||||||||||||||||||||||||||||||||||||||||||||||||||||||||||||||||||||||||||||||||||||||||||||||||||||||||||||||||||||||||
| Written by David Ramsey | |||||||||||||||||||||||||||||||||||||||||||||||||||||||||||||||||||||||||||||||||||||||||||||||||||||||||||||||||||||||||||||||||||||||||||||||||||||||||||||||||||||||||||||||||||||||||||||||||||||||||||||||||||||||||||||||||||||||||||||||||||||||||||||||||||||||||||||||||||||||||||||||||||||||||||||||||||||||||||||||||||||
| Wednesday, 01 August 2012 | |||||||||||||||||||||||||||||||||||||||||||||||||||||||||||||||||||||||||||||||||||||||||||||||||||||||||||||||||||||||||||||||||||||||||||||||||||||||||||||||||||||||||||||||||||||||||||||||||||||||||||||||||||||||||||||||||||||||||||||||||||||||||||||||||||||||||||||||||||||||||||||||||||||||||||||||||||||||||||||||||||||
Overclocking the MSI GeForce N680GTX Lightning
Manufacturer: Micro-Star International (MSI) Full Disclosure: MSI provided the product sample used in this article. Any overclocker knows that cranking the clock speed means that power usage goes up, and in many cases to get the best overclock it's necessary to increase the voltage as well. While enthusiast motherboards with modern digital power circuits make increasing the voltage to the CPU and motherboard components easy, it's not at all easy to do with most video cards. In fact to increase voltage to a video card's GPU generally requires some soldering skills. 
MSI's GTX680 Lightning is one of the first Kepler-based video cards built on a fully custom PCB, and MSI included the ability to adjust the voltage for the GPU, memory, and DLLs on the card. However, the software required to do this wasn't available at the time of my original review, so I decided not to waste time on benchmarking based on the limited overclocking I could achieve without voltage adjustment. Now that MSI Afterburner 2.2.3 is available, it's time for a full-bore overclocking run! Closer Look: Under the CoolerSeveral readers commented that in my original review of this card I didn't remove the cooler to show the custom PCB underneath. I didn't want to do that at the time because removing and reinstalling the cooler brings with it the possibility, albeit small, of damage to the card, and since I hadn't run the overclocking benchmarks yet, I wanted to wait. Well, now I've run the benchmarks, so here's the card in all its glory. Looking at the gold-colored solid state chokes (SSCs) you can see the 8 power phases for the GPU and 3 power phases for the RAM. 
As is all too common these days, even on premium cards like this, there's far too much thermal paste used. To be fair, though, when I cleaned the old paste off and applied a much thinner layer, then retested the card, the temperatures did not improve, so the excess thermal paste doesn't appear to have any bad consequences. The 2GB of video RAM is implemented with the ubiquitous Hynix memory chips. Of more interest is the CHIL CHL8318 controller: among other things, it endows the card with its ability to change voltages.
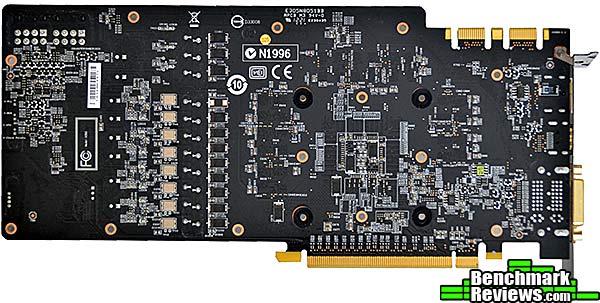
Additional power regulation components are visible on the back of the card.
The Twin Frozr cooler comprises two fans, five heat pipes, the heat plate for the GPU, and the array of fins that dissipate the heat from the heat pipes..
Below are the back (top) and front (bottom) plates. They're secured with screws that insert from the back of the card into taps on the front plate. Tightening the screws pulls the plates together, clamping the PCB between them and ensuring good contact for the thermal pads for the RAM and voltage regulators.
OK, now that we've got Afterburner 2.2.3, let's see what we can do. Overclocking DetailsWhile other video cards underclock themselves, Kepler both underclocks and overclocks itself. NVIDIA calls the overclock frequency the "boost clock", and one thing that's really important to keep in mind is that the boost clock does not represent a hard-and-fast number. Rather, it's the average frequency the card runs at under NVIDIA's test suite. The 1,058MHz boost clock of a stock 680 GTX is both this average as well as a guaranteed figure-- that is, the reference design 680 is guaranteed to boost to at least 1,058MHz. It might boost higher. It might not. Kepler-based GPUs adjust the boost frequency based on temperature and power load as well as "other factors" that NVIDIA won't talk about, so depending on the luck of the draw, different reference design 680s will have slightly different performances under load. Overclocking a Kepler consists of adding a fixed offset to the GPU frequency. The MSI GTX680 Lighting comes with a moderate factory overclock that sets the base frequency to 1,110MHz with a boost frequency of 1,176MHz, as compared to a reference card's 1,006/1,058MHz. MSI's Afterburner utility allows you to specify separate offsets added to the GPU frequency and the memory frequency. After some hours of experimentation I settled on a +190MHz boost to the GPU and a +450MHz boost to the memory. I set the power draw to 300% of maximum and added the full 100mvV extra to the GPU allowed by Afterburner (some "early" versions of Afterburner 2.2.3 allow up to 300mV, but MSI decided to restrict this to prevent possible damage to the card). Note that you must have the little BIOS switch on the top of the card set to the right (this position is marked "LN2", giving you some idea of what MSI had in mind) to set the maximum power draw past 100%. There's another complication: Kepler GPUs automatically vary their voltage as well as their frequency, and an NVIDIA-defined maximum voltage of 1.175 volts is enforced at the driver level. This makes it difficult for for changes to the voltage above this prescribed level to "stick" long term. Note in the image below that the core voltage offset is +93mV, even though I'd set it to +100mV just a few minutes previously. Also, you'll want to reset the voltage offset every time you run Afterburner, because as of now changes you make won't persist between runs. This is annoying since you can't depend on your card's maintaining its settings between boots. Hopefully there will be a more elegant solution to the voltage offset feature in the future, but NVIDIA is not making it easy.
You can adjust the voltage to the memory and "Aux" by clicking the very subtle arrow to the right of the core voltage adjustment. I wasn't able to increase the GPU or memory frequencies with adjustments to these voltages, so perhaps they work better with extreme cooling setups.
EVGA's Precision utility can't adjust the voltages of this card, but it does have a nice real-time frequency readout. Here you can see that the card's GPU is running at 1,392MHz under load! Note that no utility, including GPU-Z, can read the NGTX680 Lightning's voltage as yet; the only way to accurately determine the voltage is to use the voltage test points MSI has built onto the front of the card. At the overclocked settings, my $10 Radio Shack multimeter showed 1.4V on the GPU under load and 1.1V at idle.
This was the hairy edge of what this particular card could achieve with its stock cooler. Temperatures under load with 100% fans leveled off at 72 degrees Celsius, and I saw one or two flickers of visual artifacts in Heaven 3.0. More problematically, although the card would sail through MSI's Kombustor stress test with no problem, it would die in under a minute running Furmark, with indicated GPU temperatures exceeding 85 degrees and still climbing at the time of the crash. Normally, I would crank the clock settings down until Furmark was stable, but in this case I decided to go with these settings anyway. The whole point of this card is extreme overclocking, and really, what are you going to do with it? Play games or watch Furmark runs? On the power consumption front, overclocking and overvolting the card had a dramatic effect on power consumption. With the card running at its stock settings, the maximum power draw on my test system (the same Intel DZ77GA-70K motherboard and Core i7-3770K CPU as I used previously) was 330 watts. With the overclocked settings this rocketed to 480 watts in Furmark (albeit not for long)! OK, let's get onto the benchmarks. VGA Testing MethodologyThe Microsoft DirectX-11 graphics API is native to the Microsoft Windows 7 Operating System, and will be the primary OS for our test platform. DX11 is also available as a Microsoft Update for the Windows Vista OS, so our test results apply to both versions of the operating system. All of the tests in this review were run with DX11 graphics. According to the Steam hardware survey, as of December 2011 the most popular desktop resolution (for Steam users) is 1680x1050 pixels, with a 17.59% share, with 1920x1080 pixels coming in second with only 7.7%. I ran most tests at both 1680x1050 and 1920x1080 or 1920x1200 (I continue to prefer the 16:10 ratio of 1920x1200 to the mysteriously more popular 1920x1080 resolution). I used a combination of synthetic and video game benchmark tests in this article to illustrate relative performance among graphics solutions. Our benchmark frame rate results are not intended to represent real-world graphics performance, as this experience would change based on supporting hardware and the perception of individuals playing the video game. These are the same benchmarks and charts I included in my original review of the card, with the addition of a final score for the overclocked performance. DX11 Cost to Performance RatioFor this article Benchmark Reviews has included cost per FPS for graphics performance results. Only the least expensive product price is calculated, and does not consider tax, freight, promotional offers, or rebates into the cost. All prices reflect product series components, and do not represent any specific manufacturer, model, or brand (except for the XFX cards). These retail prices for each product were obtained from NewEgg.com on 29-July-2012:
Intel Z77-Express Test System
DirectX-11 Benchmark Applications
Video Card Test Products
DX11: 3DMark113DMark11 is Futuremark's latest iteration of the video card software benchmark suite, building on the features of 3DMark Vantage and 3DMark 06 as well as earlier version. It's optimized and intended for testing DirectX-11 capable hardware running under Windows Vista or Windows 7.
3DMark Vantage offers benchmark tests focusing on GPU, CPU, and Physics performance. For this review I concentrated on the four GPU-specific tests. The first two tests take you through an undersea scene with small submarines exploring the sea floor and sunken ships. In the GT1 test, there's no tessellation, but there are extensive lighting and shadow effects. In the GT2 test, the same scene is repeated but with moderate tessellation and fewer lighting effects. 
This benchmark reveals some nice scaling, albeit with a bump as the Radeon 7970 jumps ahead of the GTX670 in the GT2 test. The overclock adds 4.8% and 11.32%, respectively, to the Lightning's stock scores. Cost Analysis: GT1+GT2The second pair of graphics tests explore an abandoned temple deep in a tropical jungle. The GT3 test has medium tessellation and one shadow-casting light, while the GT4 test ups the ante with heavy tessellation and many shadow-casting lights. The GT4 test is by far the most demanding of this test suite. 
Cost Analysis: GT3+GT4Test Summary: The MSI N680GTX Lightning handily wins each test, although at a high cost per FPS. Overclocking adds little here.
DX11: F1 2010Codemasters' F1 2010 is officially licensed by Formula One World Championship Limited, the folks who run the actual Formula One franchise. As a racer, you must sign with a team and work to build your career, which consists of more than simply driving...although, to be honest, driving's most of it! F1 2010 is really more of a simulator than anything else. You have to contend with everything from engine overheating to aerodynamics to dirt and rubber on the track affecting your traction in real time. Codemasters game designers and programmers spent time with Formula One race engineers, mechanics, and drivers to build the most realistic game possible.
Cost Analysis: F1 2010 (1920x1200)Test Summary: The XFX Radeon 7970 beats every other card in this test, if only by a smidgen...except the N680GTX Lightning. Even then it's very close. Overclocking picks up 8.16% at 1920x1200.
DX11: Batman: Arkham CityIf there was ever a game that showcased the growing gap between game consoles and high-end gaming PCs, Batman: Arkham City is it. In this dystopian near-future, part of Gotham City has been walled off as an enclave for criminals (rather like Escape from New York). It's a 3rd-person action game that adheres to story line previously set forth in Batman: Arkham Asylum, and is based on an updated Unreal Engine 3 game engine. Batman: Arkham City is a DirectX 11 title that uses multi-threaded rendering to produce life-like tessellation effects. One annoyance with the game is that all game settings must be made through a hidden application called "BMLauncher". Once you've made your settings, though, an in-game benchmark provides the feedback you'll need to tune your system's performance.
The AMD Radeon graphics cards are at a disadvantage here, since, like Arkham Asylum, Arkham City is a showcase of PhysX effects, which can be directly accelerated by NVIDIA cards but not by AMD cards. I left PhysX turned off for this test but if your Radeon-equipped rig is running an Intel 2500K or higher processor, consider turning it on: the PhysX will run on the CPU but modern multi-core CPUs have enough power to do a credible job, and you'll miss out on some really cool effects otherwise. Overclocking the GTX680 Lightning is a real win here, with a 12.5% improvement at 1680x1050 and a 13.4% improvement at 1920x1080. Cost Analysis: Arkham City (1920x1080)Test Summary: If you don't overclock the Lightning, the XFX Radeon 7970 would waltze to a win here. The luster on AMD's Southern Islands GPUs dimmed somewhat when NVIDIA's Kepler-based cards were introduced, but enthusiasts should remember that these are very fast cards, and now have a $-per-FPS advantage in many cases.
DX11: Aliens vs PredatorAliens vs. Predator is a science fiction first-person shooter video game, developed by Rebellion, and published by Sega for Microsoft Windows, Sony PlayStation 3, and Microsoft Xbox 360. Aliens vs. Predator utilizes Rebellion's proprietary Asura game engine, which had previously found its way into Call of Duty: World at War and Rogue Warrior. The self-contained benchmark tool is used for our DirectX-11 tests, which push the Asura game engine to its limit. I configured Aliens vs. Predator to use the highest quality settings with 4x AA and 16x AF, as well as turning on DirectX-11 features such as Screen Space Ambient Occlusion (SSAO) and tessellation, along with advanced shadows.
Cost Analysis: Aliens vs Predator (1920x1080)Test Summary: Overclocking the MSI GTX680 Lightning just managed to drag it ahead of AMD's Radeon 79xx cards here. This is another test where the overclock yields large benfits: 16.5% and 14.9%, respectively, at the test resolutions.
DX11: Lost Planet 2Capcom provides a stand-alone benchmark tool for Lost Planet 2. Reviewers love stand alone benchmarks, and users should, too, since they allow the evaluation of a system without the trouble and expense of purchasing and configuring the actual game. Lost Planet 2 takes place on E.D.N. III, the same planet in the original Lost Planet game, but ten years later. The snow has melted and somehow giant tropical jungles have grown to fill the landscape. Lost Planet 2 takes advantage of DX11 features including tessellation and displacement mapping on water, level bosses, and player characters. In addition, soft body compute shaders are used on 'Boss' characters, and wave simulation is performed using DirectCompute. These cutting edge features make for an excellent benchmark for top-of-the-line consumer GPUs. There are two parts to the benchmark: Test A, which is a semi-random script that's a good example of normal game play, and Test B, which is a deterministic script that places a significantly heavier load on the card being tested.
Cost Analysis: Lost Planet 2 (1920x1200, Test B)Test Summary: Nice scaling here produces the results you'd expect if you were guessing how these cards would do. NVIDIA dominates here, but the overclock doesn't help the GTX680 Lightning much in this test.
DX11: Metro 2033Metro 2033 is an action-oriented video game with a combination of survival horror, and first-person shooter elements. The game is based on the novel Metro 2033 by Russian author Dmitry Glukhovsky. It was developed by 4A Games in Ukraine and released in March 2010 for Microsoft Windows. Metro 2033 uses the 4A game engine, developed by 4A Games. The 4A Engine supports DirectX-9, 10, and 11, along with NVIDIA PhysX and GeForce 3D Vision. The 4A engine is multi-threaded in such that only PhysX had a dedicated thread (although PhysX is disabled for this test), and uses a task-model without any pre-conditioning or pre/post-synchronizing, allowing tasks to be done in parallel. The 4A game engine can utilize a deferred shading pipeline, and uses tessellation for greater performance, and also has HDR (complete with blue shift), real-time reflections, color correction, film grain and noise, and the engine also supports multi-core rendering. Metro 2033 features superior volumetric fog, double PhysX precision, object blur, sub-surface scattering for skin shaders, parallax mapping on all surfaces and greater geometric detail with a less aggressive LODs. Using PhysX, the engine uses many features such as destructible environments, and cloth and water simulations, and particles that can be fully affected by environmental factors.
NVIDIA has been diligently working to promote Metro 2033, and for good reason: it is the most demanding PC video game we've ever tested. When their flagship GeForce GTX 580 struggles to produce 26 FPS at 1920x1200 with DirectX-11 anti-aliasing turned two to its lowest setting, you know that only the strongest graphics processors will generate playable frame rates. All our tests disable advanced PhysX options. Again, the overclock helps the MSI video card, but not enough to catch up with the AMD Tahiti cards. Note that even the XFX 7950 essentially equals the overclocked Lightning. Cost Analysis: Metro 2033 (1920x1080)Test Summary: There's no doubt that this is a very demanding game. What Crysis was to top-end video cards a few years ago, Metro 2033 is now, with even the strongest single-GPU cards struggling to break 30 frames per second at 1920x1080. And note that this is with PhysX features turned off! At these settings, MSI's Lightning was the only NVIDIA card that could break 30FPS, but even it was handily beaten by both AMD Radeon cards, even with its overclock.
DX11: Unigine Heaven 3.0The Unigine Heaven 3.0 benchmark is a free publicly available tool that grants the power to unleash the graphics capabilities in DirectX-11 for Windows 7 or updated Vista Operating Systems. It reveals the enchanting magic of floating islands with a tiny village hidden in the cloudy skies. With the interactive mode, emerging experience of exploring the intricate world is within reach. Through its advanced renderer, Unigine is one of the first to set precedence in showcasing the art assets with tessellation, bringing compelling visual finesse, utilizing the technology to the full extend and exhibiting the possibilities of enriching 3D gaming. The distinguishing feature in the Unigine Heaven benchmark is a hardware tessellation that is a scalable technology aimed for automatic subdivision of polygons into smaller and finer pieces, so that developers can gain a more detailed look of their games almost free of charge in terms of performance. Thanks to this procedure, the elaboration of the rendered image finally approaches the boundary of veridical visual perception: the virtual reality transcends conjured by your hand. The Heaven benchmark excels at providing the following key features:
Cost Analysis: Unigine Heaven (1920x1080)Test Summary: The N680GTX Lightning wins this one, but its performance advantage over the reference design GTX680 is small...until you overclock it even more. Then you get 20% and 21% more frames per second, respectively, at the two test resolutions.
DX11: Battlefield 3In Battlefield 3, players step into the role of the Elite U.S. Marines. As the first boots on the ground, players will experience heart-pounding missions across diverse locations including Paris, Tehran and New York. As a U.S. Marine in the field, periods of tension and anticipation are punctuated by moments of complete chaos. As bullets whiz by, walls crumble, and explosions force players to the grounds, the battlefield feels more alive and interactive than ever before. The graphics engine behind Battlefield 3 is called Frostbite 2, which delivers realistic global illumination lighting along with dynamic destructible environments. The game uses a hardware terrain tessellation method that allows a high number of detailed triangles to be rendered entirely on the GPU when near the terrain. This allows for a very low memory footprint and relies on the GPU alone to expand the low res data to highly realistic detail. Using Fraps to record frame rates, our Battlefield 3 benchmark test uses a three-minute capture on the 'Secure Parking Lot' stage of Operation Swordbreaker. Relative to the online multiplayer action, these frame rate results are nearly identical to daytime maps with the same video settings.
Cost Analysis: Battlefield 3 (1920x1200)Test Summary: The surprise here is the high score returned by the reference design GTX670 at 1920x1200. As multiple reviews have shown, the 670 frequently performs almost as well as a 680, but this score even beats the Lightning, so I'm inclined to dismiss it as an error...although the frame rates I recorded over multiple runs were consistent. At 1680x1050, the overclock adds a substantial 13.5% more FPS, with a smaller 8% improvement at 1920x1200.
Overclocked N680GTX Lightning Final ThoughtsMSI's Lightning series products have always been aimed at the true-blue enthusiast: the one that was willing to pay extra-- sometimes much extra-- to own the fastest, bestest version of a motherboard or video card. To this end MSI uses custom PC board designs slathered with high-end mil-spec components, all the better for the user to push to extreme levels of performance. With the release of Afterburner 2.2.3, more of this performance potential is finally unlocked via the voltage adjustments that now possible. Tweaking the voltages enabled a stunning boost clock of almost 1.4GHz, by far the highest I've ever seen on an air-cooled video card. The potential for even more performance exists if you replace the air cooler with water or more exotic cooling. Still, the performance on air's pretty good. The overclock bumped my benchmark scores an average of just over 10% over the scores achieved by the already-overclocked stock card. If you look at these benchmarks, you'll see that the performance gain tended to be either rather small or rather large, depending on the game. I suspect I would have seen a greater degree of performance improvement with a multi-screen setup, because honestly this card is really overkill for single monitor systems, and I think I was hitting CPU limitations on some of the programs I was using. 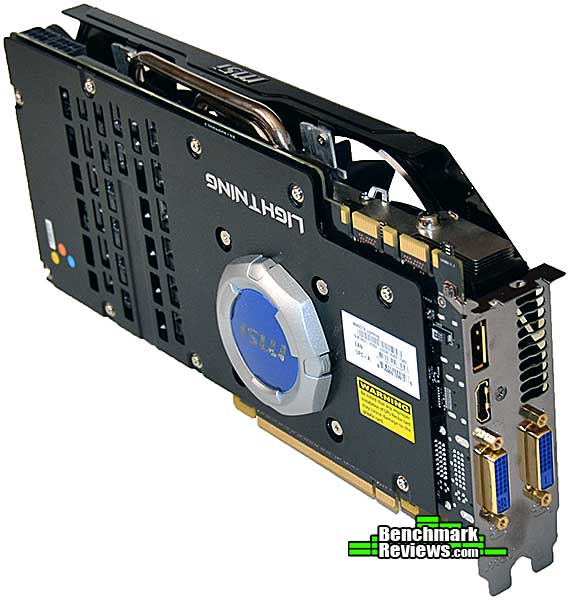
So it's fast, really fast; but NVIDIA's heavy hand places some significant limitations on what you can do. The driver (and, allegedly, even the GPU silicon itself) tries to enforce limits to the voltage you can use, and you can't just "set it and forget it", especially between boots. So to get the maximum overclock from this card you're going to have to reset the voltage in Afterburner rather frequently. Here's what MSI has to say about things: "MSI is currently the only vendor to offer adjustment of voltages on the Lightning series video cards for the GTX680 via the Afterburner overclocking interface. We are constantly working on improving Afterburner and the overclocking experience for enthusiasts, and we expect to have regular updates to Afterburner in the future." There's no doubt that the MSI N680GTX Lighting is a fabulously fast video card that begs to be overclocked, especially with some exotic cooling. Right now, though, it's rather a pain to do so, and we can only hope the situation improves in the future. Benchmark Reviews invites you to leave constructive feedback below, or ask questions in our Discussion Forum.
Related Articles:
|
|||||||||||||||||||||||||||||||||||||||||||||||||||||||||||||||||||||||||||||||||||||||||||||||||||||||||||||||||||||||||||||||||||||||||||||||||||||||||||||||||||||||||||||||||||||||||||||||||||||||||||||||||||||||||||||||||||||||||||||||||||||||||||||||||||||||||||||||||||||||||||||||||||||||||||||||||||||||||||||||||||||


Comments
It appears only MSI can bring out the very best in these gpu's. If only Nvidia would give these boutique card makers a freer rein to make these cards live up to their utmost potential.
We overclockers know the dangers of running these at the bleeding edge of high-performance and accept the responsibility of any consequences.
Nvidia should allow us to sign away their warranty and then give us the freedom to tweak these cards to the very edge of destruction. It's our cards and our risk and Nvidia needs to quit babying us.
____________________ ___________
I'd love to be saddled with such pain. Honestly, I'd probably leave it stock except for special gaming sessions.
NVIDIA probably doesn't want to deal with folks who OC these cards ~too~ much and destroy them, then proclaim the card to be junk and ask for another one. So they attempt to keep them throttled down to acceptable levels.
For now, I'm happy with my two GTX570s in SLI, and my two XFX Radeon R7770 Core Editions in crossfire. Being retired, I no longer have the bucks to buy the best.
Both are quite acceptable playing my favorite shooters, and the R7770s are better than what I though they would be.
Benchmarks really tell the difference between the two setups, but usage does not.