| AMD FX-8350 Vishera Desktop Processor |
| Reviews - Featured Reviews: Processors | |||||||||||||||||||||||||||||||||||||||||||||||||||||||||||||||||||||||||||||||||||||||||||||||||||||||||||||||||||||||||||||||||||||||||||||||||||||||||||||||||||||||||||||||||||||||||||||||||||||||||||||||||||||||||||||||||||||||||||||||||||
| Written by David Ramsey | |||||||||||||||||||||||||||||||||||||||||||||||||||||||||||||||||||||||||||||||||||||||||||||||||||||||||||||||||||||||||||||||||||||||||||||||||||||||||||||||||||||||||||||||||||||||||||||||||||||||||||||||||||||||||||||||||||||||||||||||||||
| Tuesday, 23 October 2012 | |||||||||||||||||||||||||||||||||||||||||||||||||||||||||||||||||||||||||||||||||||||||||||||||||||||||||||||||||||||||||||||||||||||||||||||||||||||||||||||||||||||||||||||||||||||||||||||||||||||||||||||||||||||||||||||||||||||||||||||||||||
AMD FX-8350 Desktop Processor Review
Manufacturer: Advanced Micro Devices Full Disclosure: AMD provided the product sample used in this article. Ask any AMD fan how they feel about the FX-8150 "Bulldozer" CPU, and you'll get one of two responses: massive disappointment or frenzied rationalizations (you can check out the comments section of Benchmark Review's FX-8150 review to see examples of both). The "massive disappointment" crowd points to the fact that in most benchmarks, less expensive Intel processors performed better than Bulldozer; while the "frenzied rationalization" folks claim that there's some sort of impossible-to-quantify-but-nonetheless-very-real advantage to the AMD CPUs: that they provide a better, smoother experience in heavy multitasking situations. The market response might be best summarized by this little chart of Newegg prices of the AMD and Intel processors I used in my review of the FX-8150:
While the price of the AMD CPU has dropped by 30% in the last year, the price of the Intel processor has increased slightly. Granted, there's more to a CPU than its raw performance, and the FX-8150 at its current price provides more bang for the buck than does the 2500K. But everyone loves a winner, and AMD is seeking to bolster its bragging rights with the new iteration of their original Bulldozer architecture in the form of the FX-8350.
I count myself among the AMD fans; this probably stems from the time a decade or so ago when I built a dual-core AMD computer to do video processing work. At the time, AMD's true dual-core design easily outperformed Intel's quasi-dual core, in which two separate Pentium cores on a chip were forced to use the front side bus to communicate. But Intel came roaring back and has dominated the performance charts ever since, forcing AMD to compete on price. AMD says that the FX-8350, based on the Piledriver architecture, offers 10-15% better IPC (instructions per clock) performance, and higher clock speeds as well. AMD FX-8350 FeaturesThe following information is courtesy of AMD
AMD FD8350FRW8KHK SpecificationsThere are four desktop CPUs in the new Vishera product line: the 8350, the 8320, the 6300, and the 4300. This is fewer than the seven new CPUs in the original Zambezi product line. As you can see from the chart below, the basic specifications of the FX-8350 are almost identical to those of last year's FX-8150. The only notable difference is an increase in the base clock speed from 3.6GHz to 4.0GHz; even the maximum turbo clock is the same at 4.2GHz.
As with the Bulldozer CPUs, all of the Piledriver chips are similar, with AMD using core count, clock speed, and amount of L2 and L3 cache to distinguish them. All FX CPUs are unlocked, so you'll be able to tweak clock speeds to the limits your hardware can handle. AMD's Turbo Core technology will use the maximum speed if only half or fewer of the cores are in use; if all cores are in use, Turbo Core is dialed back to keep the CPU within its thermal limits. Although AMD has introduced a new Socket FM2 for its Piledriver-based APUs, thankfully the existing AM3+ socket is used for the FX series, so a BIOS update is all you'll need for your existing AM3+ motherboard to use these chips. The supporting chipsets remain the same: the 990FX, the 990X, and the 970X, all paired with the SB950 south bridge. All these chipsets provide six SATA 6G ports, 12 USB 2.0 ports, and RAID levels 0, 1, 5, and 10. The only difference is in the supported PCI-E configuration: 2x16 or 4x8 for the 990FX, 2x8 for the 990X, and 1x16 for the 970X. Benchmark Reviews covered the 990FX chipset in our review of the ASUS Crosshair V Formula motherboard. Since no new support chipsets have been introduced for the Vishera CPUs, there's still no native USB 3.0. The original FX-8150 was the first consumer-level eight core CPU. This led to some arguments over what, exactly, constitutes a "core". AMD said that each Bulldozer module comprised two cores, and thus the four modules in an FX-8150 made it an eight-core chip. Detractors pointed out that each module shared its Level 2 cache and floating point unit with the two integer cores, arguably making each "core" less capable than the cores in older designs like the 6-core Thuban CPUs such as the 1100T. Benchmark Reviews discussed the Bulldozer core architecture in detail here. Obviously, the exciting thing about the FX-8150 is that it was the first consumer eight core processor. Prior to the AMD FX, if you wanted an eight-core CPU you had to buy a very expensive server-level Xeon or Opteron chip, and then you'd have to deal with things like the special "registered" memory these CPUs require, and an expensive server motherboard lacking many of the features expected in enthusiast-level motherboards...like, say, overclocking. (Yes, I know about the Intel Skulltrail and EVGA SR2 motherboards. But they're the exception.) But as it turned out, there were few situations in which eight cores really made a noticeable difference. If you did a lot of video transcoding, for example, eight cores was great. Otherwise, you might never notice. The Piledriver architecture brings some IPC improvements to the table. Let's see how much of a difference they, and the higher Piledriver clocks speeds, make in our benchmark tests. Processor Testing MethodologyFor this test I used the same ASUS Crosshair V Formula AMD 990FX motherboard that I used in our original Bulldozer FX-8150 review, updated with a new BIOS to support the FX-8350. Representing the Intel camp is the same Core i5-2500K CPU I used in the previous review, this time installed in an MSI Z77 MPOWER motherboard. AMD presents the FX-8350's Intel competitor as the Ivy Bridge based Core i5-3750K, which replaces the Sandy Bridge based 2500K in Intel's lineup, but I didn't have one of these CPUs available. In each case, I used the same 8GB (2x4GB) kit of DDR3-1600 memory, running at 9-9-9-24 timings; the same AMD Radeon HD7970 video card, and the same hard disk. In my FX-8150 review, the Intel 2500K turned in superior benchmark scores overall (if just barely) at stock clock speeds. Will things be different this time? AMD is very proud of their CPU's overclocking prowess. When the FX-8150 came out, they actually managed to get it to boot into Windows at over 8GHz (on one core) when cooled with liquid helium. I managed to get a stable 5GHz overclock on the FX-8350 using a Corsair H100 closed loop water cooler, which is still pretty impressive and certainly the highest overclock I've ever managed to hit personally. Intel Z77 Test Platform
AMD 990FX Test Platform
Benchmark Applications
AIDA64 Extreme Edition TestsAIDA64 Extreme Edition is the evolution of Lavalys' "Everest Ultimate Edition". Hungarian developer FinalWire acquired the rights to Everest in late November 2010, and renamed the product "AIDA64". The Everest product was discontinued and FinalWire is offering 1-year license keys to those with active Everest keys. AIDA64 is a full 64-bit benchmark and test suite utilizing MMX, 3DNow! and SSE instruction set extensions, and will scale up to 32 processor cores. An enhanced 64-bit System Stability Test module is also available to stress the whole system to its limits. For legacy processors all benchmarks and the System Stability Test are available in 32-bit versions as well. Additionally, AIDA64 adds new hardware to its database, including 300 solid-state drives. On top of the usual ATA auto-detect information the new SSD database enables AIDA64 to display flash memory type, controller model, physical dimensions, and data transfer performance data. AIDA64 v1.00 also implements SSD-specific SMART disk health information for Indilinx, Intel, JMicron, Samsung, and SandForce controllers. All of the benchmarks used in this test— Queen, Photoworxx, ZLib, hash, and AES— rely on basic x86 instructions, and consume very little system memory while also being aware of Hyper-Threading, multi-processors, and multi-core processors. Of all the tests in this review, AIDA64 is the one that best isolates the processor's performance from the rest of the system. While this is useful in that it more directly compares processor performance, readers should remember that virtually no "real world" programs will mirror these results. 
The Queen and Photoworxx tests are synthetic benchmarks that iterate the function many times and over-exaggerate what the real-world performance would be like. The Queen benchmark focuses on the branch prediction capabilities and misprediction penalties of the CPU. It does this by finding possible solutions to the classic queen problem on a chessboard. At the same clock speed theoretically the processor with the shorter pipeline and smaller misprediction penalties will attain higher benchmark scores. Like the Queen benchmark, the Photoworxx tests for penalties against pipeline architecture. The synthetic Photoworxx benchmark stresses the integer arithmetic and multiplication execution units of the CPU and also the memory subsystem. Due to the fact that this test performs high memory read/write traffic, it cannot effectively scale in situations where more than two processing threads are used, so quad-core processors with Hyper-Threading have no real advantage. The AIDIA64 Photoworxx benchmark performs the following tasks on a very large RGB image:
The AMD FX-8350 wins the Queen benchmark, but the Intel CPU takes a decisive (by more than 30%) victory in the PhotoWorxx test. Interestingly the AMD CPUs all return virtually the same PhotoWorxx score, even when overclocked. 
In the ZLib test, the AMD CPUs leap ahead of the Intel 2500K, with even last years' FX-8150 beating it by 20%. In the Hash test, the difference is even more profound: the Intel CPU simply can't keep up with the AMD CPUs here. Intel's Clarksdale and subsequent CPUs have dominated the AES test due to their Advanced Encryption Standard New Instructions (AES-NI), which dramatically accelerate AES code. AMD's own implementation of AES-NI made its first appearance in last year's Bulldozer-based CPUs, and although in last year's FX-8150 review it beat the 2500K, in this year's test the 2500K wins decisively. What's even weirder is that overclocking the FX-8350 significantly reduces its score! Why the odd results? The main difference this time around is the new version of AIDA64, which at 2.60.2100 is many revisions beyond the 1.85.1600 I used previously. As they say, results from different versions of the benchmark cannot be compared, but it's still weird. 
So far, we've seen the Intel and AMD CPUs slug it out and swap wins in these tests. Let's move on to the PCMark 7 Pro benchmark. PCMark 7 Pro TestsPCMark 7 is Futuremark's successor to PCMark Vantage. The full suite of tests comprises seven different sequences with more than 25 sub-tests that exercise your system's abilities in storage, computation, image and video manipulation, web browsing and gaming. It was developed with input from the designers, engineers and product managers at AMD, Compal, Dell, Hitachi GST, HP, Intel, NVIDIA, Samsung, Seagate, Western Digital and many other well-known companies. For this benchmark I chose the PCMark test, which provides a number indicating total system performance, as well as the Productivity, Creativity, and Computation test suites. Productivity TestThe Productivity test is a collection of workloads that measure system performance in typical productivity scenarios. Individual workloads include loading web pages and using home office applications. At the end of the benchmark run the system is given a Productivity test score. The Productivity test consists of:
Creativity TestThe Creativity test contains a collection of workloads to measure the system performance in typical creativity scenarios. Individual tests include viewing, editing, transcoding and storing photos and videos. At the end of the benchmark run the system is given a Creativity test score.
Computation TestThe Computation test contains a collection of workloads that isolate the computation performance of the system. At the end of the benchmark run the system is given a Computation test score.
It's important to note that since PCMark 7 was designed as a system test, the scores are dependent on the configuration of the entire system being tested, including things like the memory, hard disk, and graphics cards used: it's not an isolated CPU test like most of the other benchmarks I'm using in this review. However, since all other hardware ( video card, memory, hard disk, etc.) was identical, with only the CPUs and motherboards being changed, any performance differences here can be attributed to differences in CPU performance. 
It's pretty much an Intel rout here. The heavily overclocked FX-8350 can barely pull ahead of the Core i5-2500K in two out of three benchmarks. On the other hand, the differences between the Intel and AMD chips aren't all that great; certainly nothing you'd notice outside of benchmark-land. Let's move on to CINEBENCH. CINEBENCH R11.5 BenchmarksMaxon CINEBENCH is a real-world test suite that assesses the computer's performance capabilities. CINEBENCH is based on Maxon's award-winning animation software, Cinema 4D, which is used extensively by studios and production houses worldwide for 3D content creation. Maxon software has been used in blockbuster movies such as Spider-Man, Star Wars, The Chronicles of Narnia, and many more. CINEBENCH Release 11.5 includes the ability to more accurately test the industry's latest hardware, including systems with up to 64 processor threads, and the testing environment better reflects the expectations of today's production demands. A more streamlined interface makes testing systems and reading results incredibly straightforward. The CINEBENCH R11.5 test scenario comprises three tests: an OpenGL-based test that models a simple car chase, and single-core and multi-core versions of a CPU-bound computation using all of a system's processing power to render a photo-realistic 3D scene, "No Keyframes", the viral animation by AixSponza. This scene makes use of various algorithms to stress all available processor cores, and all rendering is performed by the CPU: the graphics card is not involved except as a display device. The multi-core version of the rendering benchmark uses as many cores as the processor has, including the "virtual cores" in processors that support Hyper-Threading. The resulting "CineMark" is a dimensionless number only useful for comparisons with results generated from the same version of CINEBENCH. For this test I used only the rendering benchmarks. Let's check out the results.
Intel's much stronger single-core performance shows to its advantage in the single core rendering test. The AMD CPUs pull away-- dramatically so in the case of the FX-8350-- in the multi-core rendering test, perhaps unsurprisingly since they have twice as many cores as the Intel CPU. Still, the multi-core performance advantage we see here isn't of the magnitude you'd expect given that the FX-8350 has twice as many cores as the i5-2500K. Were the single-core performance more equal, you'd expect the multi-core rendering scores to be even more lopsided. PassMark PerformanceTest 7.0The PassMark PerformanceTest allows you to objectively benchmark a PC using a variety of different speed tests and compare the results to other computers. PassMark comprises a complete suite of tests for your computer, including CPU tests, 2D and 3D graphics tests, disk tests, memory tests, and even tests to determine the speed of your system's optical drive. PassMark tests support Hyper-Threading and systems with multiple CPUs, and allow you to save benchmark results to disk (or to export them to HTML, text, GIF, and BMP formats). Knowledgeable users can use the Advanced Testing section to alter the parameters for the disk, network, graphics, multitasking, and memory tests, and created individual, customized testing suites. But for this review I used only the built-in CPU tests, which aren't configurable. The CPU tests comprise a number of different metrics. The first three I'll look at are integer performance, floating point performance, and a benchmark that finds prime numbers.
The FX-8350's performance on the Integer section of the benchmark is amazing...so much so that I must chalk it up to a problem or compatibility issue between the FX-8350 and this particular benchmark. The Float and Prime benchmark results mirror what we saw in the FX-8150 review, with the AMD CPUs racking up substantial wins.
SSE stands for "Streaming SIMD Extensions", and are instructions that handle multiple chuncks of data per instruction (SIMD = Single Instruction Multiple Data). SSE instructions work on single-precision floating point data and are typically used in graphical computations. SSE was Intel's response to AMD's "3D Now", which itself was a response to Intel's MMX instructions. Don't you love competition? AMD's current implementation still wins in this benchmark; probably since each two-core "module" in the CPU has two 128-bit floating point units. The Encryption benchmark has historically been AMD's to win, and AMD does dominate here as well.
The Compress and String benchmarks are both integer-based, and the AMD CPUs rack up a substantial win in both benchmarks. But enough with the synthetic benchmarks; let's move onto some more real-world applications. Handbrake Media EncodingIt's a truism that consumer-level computer performance reached the "fast enough" point years ago, where increases in system performance don't make thing any faster for most people. Web browsing, e-mail, word processing, and even most games won't benefit dramatically from a super-fast CPU. There are some exceptions, though, and media encoding is one of them: transcoding video, especially high-definition video, can bring the strongest system to its knees. Fortunately, media transcoding is one of those things that (depending on the design of the code, of course) that scales really well with both clock speed and the number of cores, so the more you have of both, the better your results will be. The free and open-source Handbrake 0.96 video transcoder is an example of a program that makes full use of the computational resources available-- in other words, it'll keep all available cores saturated. For this test I used Handbrake 0.95 to transcode a standard-definition episode of Family Guy to the "iPhone & iPod Touch" presets, and recorded the total time (in seconds) it took to transcode the video.
Video transcoding is one of the things that really makes good use of a multi-core processor. Thus the 8-core FX CPUs turn in better results than the 4-core 2500, with the stock-clocked FX-8350 being 25% faster than its Intel competition. x264 HD Benchmark 5.0Tech ARP's x264 HD Benchmark comprises the Avisynth video scripting engine, an x264 encoder, a sample 1080P video file, and a script file that actually runs the benchmark. The script invokes four two-pass encoding runs and reports the average frames per second encoded as a result. The script file is a simple batch file, so you could edit the encoding parameters if you were interested, although your results wouldn't then be comparable to others.
Video transcoding applications show the AMD FX-8350 processor to its best advantage, keeping all eight cores busy. Still, it's telling that at stock clock speeds the 8350 is only marginally faster than the four-core 2500K, which is also running at a lower clock speed. SPECviewperf 11 testsThe Standard Performance Evaluation Corporation is "...a non-profit corporation formed to establish, maintain and endorse a standardized set of relevant benchmarks that can be applied to the newest generation of high-performance computers." Their free SPECviewperf benchmark incorporates code and tests contributed by several other companies and is designed to stress computers in a reproducible way. SPECviewperf 11 was released in June 2010 and incorporates an expanded range of capabilities and tests. Note that results from previous versions of SPECviewperf cannot be compared with results from the latest version, as even benchmarks with the same name have been updated with new code and models. SPECviewperf comprises test code from several vendors of professional graphics modeling, rendering, and visualization software. Most of the tests emphasize the CPU over the graphics card, and have between 5 and 13 sub-sections. For this review I ran the Lightwave, Maya, and Seimens Teamcenter Visualization tests. Results are reported as abstract scores, with higher being better. LightwaveThe lightwave-01 viewset was created from traces of the graphics workloads generated by the SPECapc for Lightwave 9.6 benchmark. The models for this viewset range in size from 2.5 to 6 million vertices, with heavy use of vertex buffer objects (VBOs) mixed with immediate mode. GLSL shaders are used throughout the tests. Applications represented by the viewset include 3D character animation, architectural review, and industrial design. MayaThe maya-03 viewset was created from traces of the graphics workload generated by the SPECapc for Maya 2009 benchmark. The models used in the tests range in size from 6 to 66 million vertices, and are tested with and without vertex and fragment shaders. State changes such as those executed by the application- including matrix, material, light and line-stipple changes- are included throughout the rendering of the models. All state changes are derived from a trace of the running application. Siemens Teamcenter Visualization MockupThe tcvis-02 viewset is based on traces of the Siemens Teamcenter Visualization Mockup application (also known as VisMockup) used for visual simulation. Models range from 10 to 22 million vertices and incorporate vertex arrays and fixed-function lighting. State changes such as those executed by the application- including matrix, material, light and line-stipple changes- are included throughout the rendering of the model. All state changes are derived from a trace of the running application.
The SPECviewperf suite is a good example of a real-world test of applications that would normally be the province of a high-end workstation: the individual tests comprise code and models from real applications, running scripts that do real work. The 2500K wins decisively here, even beating the overclocked FX-8350 in every test. SPECapc LightwaveSPECapc (Application Performance Characterization) tests are fundamentally different from the SPECviewperf tests. While SPECviewperf tests incorporate code from the various test programs directly into the benchmark, the SPECapc tests are separate scripts and datasets that are run against a stand-alone installation of the program being benchmarked. SPECapc group members sponsor applications and work with end-users, user groups, publications and ISVs to select and refine workloads, which consist of data sets and benchmark script files. Workloads are determined by end-users and ISVs, not SPECapc group members. These workloads will evolve over time in conjunction with end-users' needs and the increasing functionality of PCs and workstations. For this test, I ran the SPECapc "Lightwave" benchmark against a trial installation of Newtek's Lightwave 3D product. The benchmark, developed in cooperation with NewTek, provides realistic workloads that simulate a typical LightWave 3D workflow. It contains 11 datasets ranging from 64,000 to 1.75 million polygons and representing such applications as 3D character animation, architectural review, and industrial design. Scores for individual workloads are composited under three categories: interactive, render and multitask. The benchmark puts special emphasis on processes that benefit from multi-threaded computing, such as animation, OpenGL playback, deformations, and high-end rendering that includes ray tracing, radiosity, complex textures and volumetric lighting. The test reports three scores: Animation (multitasking), Animation (interactive), and Rendering. The numeric scores represent the time it took to complete each section of the benchmark, in seconds, so lower scores are better. I've found the SPECapc Lightwave 3D test to be an excellent indicator of overclock stability. In many cases, overclocked systems that will make it through every other benchmark here will crash in this test. 
Now, these results are interesting, and also show how much difference benchmark configuration can have on results. In the Lightwave portion of the SPECviewperf benchmark in the previous section, the Intel Core i5 2500K beat the AMD FX CPUs decisively. Here, however, it wins in only one of the Interactive section of the benchmark. In the Multitasking and Rendering section, the AMD processors win even at stock clock speeds. BlenderBlender is an open-source, free content creation suite of 3D modeling, rendering, and animation capabilities. Originally released in 2002, it's available in versions for Mac OS X, Windows, Linux, and several Unix distributions. It supports rigid and soft-body objects and can handle the draping and animation of cloth, as well as the rendering and animation of smoke, water, and general particle handling. Our Blender test renders multiple frames of an animation of a rotating chunk of ice, with translucency and reflections. Rendering of this model uses ray-tracing algorithms and the program reports the rendering time for each of the animation's 25 frames. The results are a summation of the rendering time for all frames and the lower the score, the better. 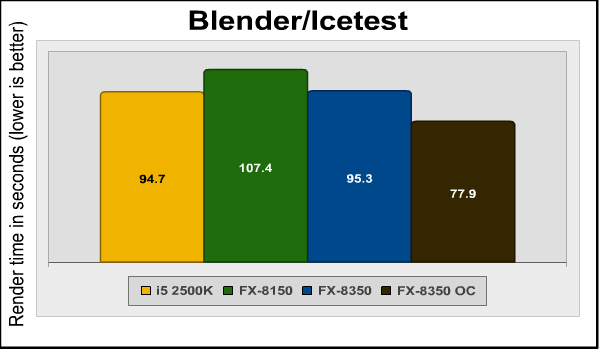
Another win for the Core i5 2500K, although the FX-8350 virtually ties it at stock clock speeds. The overclocked FX-8350 wins overall. Piledriver Core PerformanceAs we saw in our original FX-8150 review, and indeed in this review, the FX CPU's weakness is in its per-core performance; or, more succinctly, instructions per clock cycle. Think of how you'd make a car faster: you could add more horsepower, or make it lighter, the idea in both cases being to increase the horsepower-per-pound ratio. Adding horsepower is easy: just make the engine bigger or add a turbo or supercharger. Making the car lighter, on the other hand (while staying within safety regulations), is both complex and expensive. It's the same with processors. You can increase performance by increasing the instructions a core can execute per clock cycle, or by increasing the clock frequency and adding more cores, and the idea in either case is to increase the number of instructions executed per unit of time. Modern superscalar processors are insanely complex: x86 instructions must be broken down into microcode; pipelines must be managed, along with on-chip caches; branch prediction and speculative execution must be optimized, and there's even more that only processor architects could hope to understand. The point is that increasing instructions per clock is hard, but simply ramping up the clock speed (and adding cores) is a lot easier. This is the route AMD has taken with its FX series CPUs. Still, AMD says that they've made a number of architectural improvements in the Piledriver core over the previous Bulldozer core: 
To test these improvements without considering core count or clock speed, I locked both my FX-8150 and FX-8350 at 3.6GHz and disabled turbo mode. I then ran some benchmarks to compare per-core performance at the same clock speed. Handbrake and Blender were both run only on a single core.
As you can see, the Piledriver cores are faster than the Bulldozer cores. If the percent improvement doesn't seem that dramatic, keep in mind that it's about the same level of improvement that we saw in the transition from Sandy Bridge to Ivy Bridge in the Intel world. Of course, Bulldozer is starting from a much lower base: as we noted in our FX-8150 review, the Bulldozer cores provide about the same performance overall as the much older Thuban cores in AMD's Phenom II X6-1100T processor. So while AMD has made progress, they still have a long way to go. The Piledriver cores in the FX-8350 benefit from the same new instructions we saw introduced in the FX-8150. Specifically, these are:
The problem with introducing new instructions is that they don't benefit existing programs: new programs must be specifically coded to use them. And as our tests with the FX-8150 and modified versions of the x264HD benchmark showed, substantial performance increases are possible if programs are coded to use these new instructions. The FMA (fused multiply-add) instructions in particular can help video transcoding applications, but these new instructions have yet to achieve any broad penetration in the program market. Each Bulldozer/Piledriver module shares L2 cache between its two integer cores, so if a multi-threaded process can be spread among modules so that (for example) two threads each execute on separate modules rather than in the same module, each will get twice as much L2 cache as it would otherwise, potentially increasing performance. Microsoft has released hotfixes for Windows 7 that supposedly addressed this issue, but they didn't seem to have any measurable effect on performance. Windows 8 may improve this...we'll see.
|
|||||||||||||||||||||||||||||||||||||||||||||||||||||||||||||||||||||||||||||||||||||||||||||||||||||||||||||||||||||||||||||||||||||||||||||||||||||||||||||||||||||||||||||||||||||||||||||||||||||||||||||||||||||||||||||||||||||||||||||||||||


| 8350 Stock | 8350 OC | |
| AIDA64 Queen | 1.0 | 1.23 |
| AIDA64 Photoworxx | 1.0 | 1.01 |
| AIDA64 AES | 1.0 | 0.93 |
|
AIDA64 ZLIB |
1.0 | 1.25 |
| AIDA64 Hash | 1.0 | 1.25 |
| CINEBENCH Single Core | 1.0 | 1.19 |
| CINEBENCH Multi Core | 1.0 | 1.24 |
| Passmark CPU Marks | 1.0 | 1.24 |
| PCMark 7 Pro Productivity | 1.0 | 1.13 |
| PCMark 7 Pro Creativity | 1.0 | 1.04 |
| PCMark 7 Pro Computation | 1.0 | 1.08 |
| Handbrake 0.96 | 1.0 | 1.22 |
| x264HD Pass 1 | 1.0 | 1.18 |
| x264HD Pass 2 | 1.0 | 0.99 |
| SPECviewperf Lightwave | 1.0 | 1.11 |
| SPECviewperf Maya | 1.0 | 1.09 |
| SPECviewperf TCVIS | 1.0 | 1.12 |
| SPECapc Lightwave Interactive | 1.0 | 1.08 |
| SPECapc Lightwave Multitasking | 1.0 | 1.14 |
| SPECapc Lightwave Rendering | 1.0 | 1.23 |
| Blender/Icetest | 1.0 | 1.22 |
| Average Performance Improvement | 14% | |
The FX-8350 can boost its clock speed to 4.2GHz under normal use, and my 5GHz overclock represents a 19% boost, so a 14% performance improvement isn't too bad although I'd hoped for some more.
Piledriver Final Thoughts
I think that many people judge the AMD FX series processors from a flawed premise: that since these are the top-end AMD CPUs, they should be compared against the top-end Intel CPUs. This might have been a valid criterion last year, when the newly-introduced FX-8150 was more expensive than Intel's competing processors, but since then AMD has wised up and priced the FX-8350 very attractively. Of course, Intel could erase this advantage overnight by lowering the price on their CPUs, but they haven't done so when the price of the FX-8150 dropped, and I don't think they'll do it now.
AMD's new Vishera CPUs, represented by this top-of-the-line FX-8350, offer incremental performance and overclocking improvements over the previous generation. The Piledriver cores have some IPC improvements and the fabrication process has been refined, making higher overclocks possible. There's something kinda cool about running your octo-core desktop machine at 5GHz.
AMD's using clock speed and cores to compete in performance with Intel's superior IPC, and to some degree it's working. Let's compare the FX-8350's benchmark scores with the Intel Core i5-2500K.
| Stock clocked performance results | Core i5 2500K score | FX-8350 score | FX-8350 % Diff |
| CINEBENCH single | 1.5 | 1.10 | -27% |
| CINEBENCH multi | 5.71 | 6.85 | +20% |
| SPECviewperf Maya | 15.53 | 10.64 | -31% |
| SPECviewperf TCVIS | 7.44 | 5.32 | -28% |
| SPECviewperf LightWave | 29.33 | 26.04 | -11% |
| SPECapc multitasking (lower is better) | 1238 | 1161 | +6% |
| SPECapc interactive (lower is better) | 545 | 610 | -12% |
| SPECapc rendering (lower is better) | 809 | 665 | +18% |
| AIDA64 Queen | 35072 | 35302 | +1% |
| AIDA64 PhotoWorxx | 59857 | 45076 | -25% |
| AIDA64 Zip | 217 | 328 | +50% |
| AIDA64 AES | 440842 | 305179 | -30% |
| AIDA64 Hash | 2599 | 4110 | +58% |
| PCMark 7 Pro Productivity | 3757 | 3410 | -9% |
| PCMark 7 Pro Creativity | 5442 | 5041 | -7% |
| PCMark 7 Pro Computation | 6689 | 6468 | -3% |
| Handbrake (times in secs, lower is better) | 162.3 | 121.4 | +25% |
| x264Bench HD Pass 1 | 51.8 | 57.3 | +11% |
| x264Bench HD Pass 2 | 11.0 | 14.9 | -35% |
| PassMark CPUMark | 7489 | 15259 | +103% |
| Blender/icetest rendering time (lower is better) | 94.7 | 95.3 | -1% |
In Benchmark Reviews' previous test of the FX-8150, it scored overall 2.2% slower than the Core i5-2500K. With this particular mix of benchmarks, the FX-8350 scores an overall 3.5% higher, so that's progress, albeit of the incremental variety. But remember this is testing against the Core i5-2500K, rather than its successor Core i5-3750K, which is doubtless faster. I'll spare you another giant chart and tell you that across the benchmarks I ran, the FX-8350 was, on average, just over 10% faster than the FX-8150. Again, this is in line with the performance improvement we saw when Intel moved from its Sandy Bridge architecture to Ivy Bridge.

What makes the FX-8350 more competitive than the FX-8150 is its introductory MSRP. When the FX-8150 was introduced, its MSRP was $269.99, which was a good $50 more than the Core i5-2500K was selling for at the time. And many e-tailers were selling the FX-8150 for significant markups-- I saw prices over $300 in the first weeks after its introduction. Now we have the FX-8350 offering better performance and overclocking, but at an MSRP of only $199.00. So the top-end FX CPU goes from being slightly slower but significantly more expensive than the 2500K to being slightly faster and $20 cheaper.
AMD touts their position as the sole eight-core desktop processor, and rightly so. While having eight cores on your desktop is possible with an Intel Xeon CPU, some of which will work in consumer motherboards, you'll pay thousands of dollars for the privilege. However, you should think about what benefits having eight cores will really bring. The big win is for applications that perform easily parallelizable tasks, such as video or audio transcoding or advanced rendering applications, whose work can be divided into an arbitrary number of threads and processed in parallel. Note the big wins the FX-8350 had in x264Bench HD, SPECapc rendering, Handbrake, and CINEBENCH multi-core rendering. To match or exceed the performance of the FX-8350 in these benchmarks would require a much more expensive Intel Core i7-2700K or 3770K CPU.
The other advantage of multiple cores is simply to let your system perform more tasks without bogging down. Here the benefit (once you get past four or so cores) is less evident. For example, a modern game might have separate threads for main game logic, AI, and preparing scenes for the video card to render, but since each thread only runs on one core, each thread is still constrained by AMD's lower core performance. And developer tools haven't been quick to incorporate support for AMD's new instructions, which is a pity since their use can substantially increase performance.
Of course, it's not all about CPU performance. For one thing, computers are fast enough now. As a reviewer for Benchmark Reviews, I maintain top-end Intel and AMD systems for test beds. By any benchmark my Intel Core i7-3960 six-core Sandy Bridge Extreme based system is much faster than my AMD FX-8350 system. But I can honestly say that I never notice any performance difference when using the AMD system...nothing I do, including gaming, is noticeably slower on the AMD box. Of course anyone who buys a Sandy Bridge Extreme system for gaming is simply throwing money away, but the point remains.
And there are advantages to the 990FX platform over Intel's LGA1155 platform, most notably the 42 (38 available, 4 used for communications with the SB950) PCI-E lanes you get as compared to the paltry 24 available on a Sandy Bridge or Ivy Bridge system. Intel's using PCI-E lanes as a product differentiator between its very expensive LGA2011 systems and its mainstream LGA1155 systems, and this means that unless you buy an expensive LGA1155 motherboard with a PLX chip, you may discover that not all of your USB 3 and SATA 6 ports are available at the same time.
But even these rationalizations don't need to be made right now, because although the FX-8350 certainly doesn't threaten Intel's performance lead, it does offer a very competitive price/performance ratio in the mid-range CPU market. The FX-8350 is more than enough CPU for any consumer or even hard core gamer. There's no longer any need to "make excuses" for AMD.
AMD FX-8350 Conclusion
Benchmark tests should always be taken with a grain of salt. It's difficult to try and isolate the performance difference a single component in a computer system makes, especially when it's necessary to compare across different manufacturers and platforms. Complicating the matter is the fact that benchmarks change, a manufacturer may change the technical details of a product, and the retail price may change as well. So please use this review as just one piece of information, and do your research before making a buying decision.

The AMD FX-8350 CPU doesn't offer dramatic performance gains over last year's FX-8150, but its much lower introductory MSRP really levels the playing field between AMD and Intel. Especially in today's economy, builders are looking for the most bang for the buck, and that's where AMD is winning with this CPU.
Intel partisans can proudly point out that their CPUs provided much better single core performance, and that's certainly true; but what's also true is that even the lower AMD single core performance is more than fast enough in most situations. Enthusiasts will appreciate the 990FX platform's extra helping of SATA 6 ports and especially PCI-E lanes, and the ease and variety of overclocking mechanisms is an added bonus.
If you're the kind of enthusiast whose idea of a fun weekend is tweaking your system, you'll probably have more fun with an AMD box. And we already know that Intel's forthcoming Haswell CPUs will require yet another new socket (LGA1150), while there's at least one more generation of FX processors (Jackhammer) that will work in the same AM3+ socket used by Bulldozer and Piledriver, so remember that any new LGA1155 motherboard you buy now will probably be obsolete in less than a year.
The AMD FX-8350 is offered in OEM (FD8350FRW8KHK) and retail box (FD8350FRHKBOX) kits for $199.99 (Newegg | Amazon). On a pure performance level, right now AMD offers a better bang-for-the-buck in the $200 CPU market than does Intel. If your AMD rig already sports an FX-8150, there's no reason to upgrade; but if you're thinking about upgrading from an earlier AMD or Intel system, an FX-8350-based system should definitely be on your short list.
Pros:
+ Eight cores and 5GHz on your desktop computer
+ Officially supports DDR3-1866 memory
+ Better performance than Intel on multithreaded tasks
+ An FX system has 38 usable PCI-E lanes as opposed to the 24 lanes of a Sandy Bridge system
+ Excellent price/performance ratio, finally competitive with Intel in the $200 CPU range
Cons:
- Single core performance still lags far behind Intel- Few programs use new FX instructions like fused multiply-add, so the full performance potential remains untapped
Ratings:
-
Performance: 8.50
-
Construction: 9.00
-
Overclock: 9.75
-
Functionality: 8.50
-
Value: 9.0
Final Score: 8.95 out of 10.
Quality Recognition: Benchmark Reviews Silver Tachometer Award.
Benchmark Reviews invites you to leave constructive feedback below, or ask questions in our Discussion Forum.
Related Articles:
- nMedia System ICETANK CPU Cooler
- XFX Radeon R7770 Black Edition Video Card
- AMD A8-3850 Lynx APU Processor
- WD VelociRaptor 300GB SATA HDD WD3000HLFS
- Mionix Naos 5000 USB Gaming Laser Mouse
- OCZ 64GB SATA 2.5" Solid State Drive OCZSSD64GB
- ASUS ENGTX580 GeForce GTX 580 Video Card
- SteelSeries Sensei Pro Laser Gaming Mouse
- AMD Radeon HD 6850 Barts Video Card
- CyberPower CP1500AVRLCD 1500VA 900W LCD UPS

Comments
the threading and core parking updates can make a bit of a difference to benchmarks especially in lightly threaded situations
The extra performance is not Earth shattering, but it is good enough to consider buying into. I will not be selling my i7-2600k system anytime soon, but I can see an upgrade to this new FX-8350 happening within a few months.
Thanks for the review David.
When we review motherboards, processors, and the like, test systems are built, a fresh copy of Win 7 is installed, and we're good to go. Since Windows 7 will run for 30 days without requiring an activation code, it's easy to create fresh installations as needed. After the review is done, test systems are generally torn back down and the parts saved for future tests/comparisons.
Windows 8 requires a valid activation code just to install it-- you can't skip this step as you can with Win 7. Then it's locked down to the system it was installed on.
Right now that means we'd have to buy a new copy of Windows 8 for every video card, motherboard, or CPU we test. This isn't viable, and we're trying to figure out what to do about it.
'cause I just looked at their review and they used a different motherboard, different memory, different hard drive, and different video card, as well as an almost completely different set of benchmarks.
The only two benchmarks we have in common are PCMark 7 Pro and Handbrake. You can't compare the Handbrake results since we used different input files with different settings.
PCMark 7 Pro tests the entire system, not just the processor (as I specifically mention in my review), so it's not surprising that with different hardware they get different results. Our Creativity scores were virtually equal (less than 0.5% difference); our Computation score was much better (6468 vs. 5083) and our Productivity score was less.
Which proves precisely nothing, except that you have no idea whatsoever what you're talking about.
it's silly for you to make claims without a single modicum of proof to support the argument. As the author points out, you can't compare completely different computer systems and expect the same benchmark score. Perhaps these in-depth technology reviews require a level of understanding you lack.
SPECS.DDR3 GSKILL 2133MHZ.. PHENOM 3.9-4.2TURBO. 3 SSDS-RAID0
My personal philosophy for CPU reviews is to run a LOT of benchmarks, since different benchmarks show different things.
The reviews I've read on other sites so far seem to have all reached similar conclusions: faster than Piledriver, competitive in most uses with midrange Intel CPUs.
The 8150 came out claiming native 1866 support, which to most implies one can fill the DRAM slots and run 1866, after untold complaints from people trying to run just 4x4GB (16GB total) of 1866, the advertising was changed to reflect 1866 at 1 DIMM Per Channel. AMD's BIOS and Kernel Guide for Developers reflects the same info (and that was based on 4GB DIMMs)....
I ask about the DRAM as AMD has been notorious for having weak Memory Controllers, (i.e. the initial 965 in general, couldn't carry 1600 DRAM until the C3 revision), so the CPU itself, primarily it's Memory Controller, does have a major say in what DRAM (frequency, density, total) it can run.
I, and I know of many others, would love to give this CPU a try, and see how it would do with the 8 cores....if it can support a sufficient amount of DRAM of a high frequency to run multiple VMs and applications. If in fact it runs 1866 as 'native' as AMD claims would be nice to see it run 32GB of same and if it CAN run faster DRAM.
Also of note: Would be interesting to see how the 8350 stands straight up to a 2500K with both OCed - most 2500Ks will run easily stable at 4.7 or better - vs the 5.0 of the 8350, keeping in mind of course the 2500K is now almost 2 years old, or better yet vs the 3570K (generally will run 4.5-4.6 with few problems or heat), which as of today at both the Egg and Tiger is about $5 less than the 8350
Newegg "$15 off w/ promo code EMCJNHD27, ends 11/1"
#newegg.com/Product/Product.aspx?Item=N82E16819116504&Tpk=3570K
As far as memory frequency if there's nothing to be concerned about between 1600 and 1866, then why not test at the CPU's true 'native' freq of 1333? Regardless, my question was how about large amounts of DRAM at high freq, i.e. can it handle 32GB @ 1600, 1866, 2133, 2400 etc. I originally brought up the question as the testing was done with 8GB, not the 16 you have loaded currently. I know most of my customers, look for 16GB to start and even systems that are planned primarily for gaming, those folks want 8GB min to start....and when looking to enthusiast systems, most want to get the most out of the system they can, whether it be gaming, rendering video, imaging work, GIS with large data sets, VMs where higher freqs = greater MTs (Mega Transfers per sec) or higher bandwidth. Maybe it's just me, but when I pull my DRAM out of one of my systems 2133 or 2400 and put in 1600 or even 1866 and run that in a like amount, I can 'see' a difference, especially when I start opening up say Win8 in a VM and play with images and be working with GIS or video in Win7
Here at Benchmark Reviews we have had occasion to test high frequency memory, and we've never found any quantifiable real-world difference in performance other than on synthetic memory benchmarks. If you can suggest a real-world application that benefits, with some numbers to back it up (rather than your 'feel'), we'd be interested to here about it.
I guess our thoughts as far as real world computing or quantifiable examples differ, I look to utilizing the cores of multiprocessor CPUs as an example, which is why I mentioned opening Win8 in a VM and rendering a video, while at the same time being in Win7 and running GIS, where as you talk about running a single app or benchmark at a time (i.e. how many of those 8 cores were actively doing anything in any one of the benchmarks, ever consider running multiple benchmarks at the same time?...might be surprised what you find). Further I said I could ?see? a difference when using faster DRAM, as in, things get done faster, not ?feel? as you imply somewhat sarcastically.
Again, if you can suggest some real world tests that will show the advantage of high speed memory, we're all ears.
Performance is NOT a warm fuzzy feeling you get, it's a quantifiable result. Anyone with an understanding of DDR3 memory will tell you that clock speed isn't important in contrast to latency. I even wrote a long in-depth technical article about: bit.ly/PoNdE8
Stop commenting, and start reading about the technology behind these items. You're asking us to run DDR3-2800 for the sake of a CPU test, which doesn't make sense to anyone who understands the pipeline architecture of a PC. Even if we wanted to run such a ridiculous test, finding compatible hardware components that consistently performed to this level would be extremely difficult.
As far as the technology goes, I'm rather comfortable with my knowledge, which is one of the reasons I didn't ask you to test with 2800 as you claim, in fact for 2800 the 3770K is about the only CPU that can carry 2800, so it's ridiculous for you to claim I said that (yet both you and David seem to delight in twisting what people say here). I simply asked if faster sets were looked at, one reason being you all tested the 8150 with 1866 sticks, so why drop to 1600 when you have a newer more powerful CPU (and in fact the 8150 had better bench results running with 1866 that it does here running with more DRAM 8GB vs 4GB in the original test/review), yet only using 1600 here.
Also in reading the reviews here, as long as you brought up reading about the technology here, in the review on the 1866 16GB Ares, it states as a CON the DRAM XMP profile doesn't set the specified speed and timings, which as you should know, the DRAM itself doesn't actually set things, it provides information in the SPD and it is up to the BIOS to take in and implement that info (i.e. it's not the RAMs fault), in the same review it's said it's not as cost effective as buying two 8GB sets, which may be considered a con-but most DRAM manufacturers recommend against mixing two sets or more, even of the same exact model - the XMP programming is done by the set which will differ between 2 and 4 stick sets, often leaving one to have to manually set up the sticks (in particular the advanced/secondary timings like tRFC (which can be a bear for most all users). There's also other DRAM reviews that have questionable items
Another good example is: earlier you commented "That wouldn't be a part of any CPU review, since it's more of a motherboard feature/limitation. The CPU can operate with any frequency, but the motherboard needs to support the speed and density first"
Which I also differed with and explained, and you failed to reply to. According to that statement you imply an entry level socket 1155, I3 can run 32GB of 2800 DRAM...if the motherboard supports it...I disagreed and again explained myself, Could you also explain your premise to that statement? Just curious.
For example, as you point out, in my FX-8150 review I used DDR3-1866 memory on the AMD processor and DDR3-1600 memory on the Intel processor. The idea was to show each CPU in the best light with its highest officially supported memory frequency.
Wow, you should have seen the comments I got on that. For example, one commenter "Jim Reece" said "I'll give you that you did your best to cripple the 2500K", because I didn't run 1866 DRAM with it. He also took me to task for using a 2500K as the comparison (AMD's stated performance target) rather than a 2600K or 2700K, apparently under the impression that I have every Intel CPU ever made in a box here or something.
In the end this commenter was so disgusted with me, certain that I was simply a shill for AMD, that he said "No need to reply, I'm gone, I'll stick with sites that ACTUALLY perform reviews that are objective rather than w/ bias."
But you know what? He came back. Not only did he come back, he applied to be a reviewer here. After missing several promised dates to complete his first review, he informed us that he wouldn't be a "good fit" because he's a "straight shooter" (and, as he informed us a year or so ago, we're biased) and launched into a bizarre screed attacking several of our other reviews on technical points, all of which were wrong.
We hope he's gone for good this time.
#memory.dataram.com/products-and-services/software/ramdisk
You can select how much of drive you use while retaining programs on it.
Windows recommends using a Flash Drive that can double the size ofyour RAM minus any programs U want to keep onit
Just been reading your benchmark test on the new trinity APU's (very good article), I used the A10 in a recent mini-itx build (Bit_fenix prodigy).
Ive had a request to build a rig for someone on a tightish budget, my first thought given the money available was to put in a AMD Piledriver FX-4 Quad Core 4300 and a 1gb 7850 gpu - total price: 210gbp, then I thought what about the A8-5600k crossfired with a HD6670 at approx: 134gbp.
I haven't been able to find any benchmarks unfortunately, I think its a pretty relevant question at the moment.
Many Thanks
Joel
Thanks,
- Aaron
If you do run apps that can spawn a lot of threads, well, 8 cores rocks. But aside from transcoding and rendering, there aren't a lot of apps that can really leverage this power.
If I get a 2x4GB DDR3 1866MHz memory kit paired with the FX-8350 (working in dual-channel of course), will each module actually work at 1866MHz or what? Is it really much of an advantage to buy DDR3 1866MHz memory kits to be used on the AMD platform?
Thanks!
That said, in general high speed memory kits are more for racking up high benchmark scores than any noticeable improvement in performance. You'll be lucky to see an extra FPS or two. With 1600MHz memory being the standard these days-- and cheap as well-- there's little real-world reason to pay more for faster memory.