| MSI Radeon HD 4850 Video Card R4850-512M |
| Reviews - Featured Reviews: Video Cards | |||||||||||||||||||||||||||||||||||||||||||||||||||||||||||||||||||||||||||||||||||||||||||||||||||||||||||||||||||||||||||||||||||||||||||||||||||||||||||||||||||||||||||||||||||||||||||||||||||||||||||||||||||||||||||||||||||||||||||||||||||||||||||||||||||||||||||||||||||||||||||||||||||||||||||||||||||||||||||||||||||||||||||||||||||||||||||||||||||||||||||||||||||||||||||||||||||||||||||||||||||||||||||||||||||||||||||||||||
| Written by Olin Coles | |||||||||||||||||||||||||||||||||||||||||||||||||||||||||||||||||||||||||||||||||||||||||||||||||||||||||||||||||||||||||||||||||||||||||||||||||||||||||||||||||||||||||||||||||||||||||||||||||||||||||||||||||||||||||||||||||||||||||||||||||||||||||||||||||||||||||||||||||||||||||||||||||||||||||||||||||||||||||||||||||||||||||||||||||||||||||||||||||||||||||||||||||||||||||||||||||||||||||||||||||||||||||||||||||||||||||||||||||
| Tuesday, 14 October 2008 | |||||||||||||||||||||||||||||||||||||||||||||||||||||||||||||||||||||||||||||||||||||||||||||||||||||||||||||||||||||||||||||||||||||||||||||||||||||||||||||||||||||||||||||||||||||||||||||||||||||||||||||||||||||||||||||||||||||||||||||||||||||||||||||||||||||||||||||||||||||||||||||||||||||||||||||||||||||||||||||||||||||||||||||||||||||||||||||||||||||||||||||||||||||||||||||||||||||||||||||||||||||||||||||||||||||||||||||||||
MSI Radeon HD 4850Price to performance, the Radeon HD 4850 could rightfully be considered one of the most popular video cards of all time. It's hard to imagine that ATI would have every succeeded against the green machine at a time when many were expecting the end of AMD/ATI. I imagine that it's only fair, since NVIDIA has been polishing the crown for many years now. But after they enjoyed the sweet thrill of victory with their GeForce GTX 280 launch, ATI came around to deliver an affordable graphics solution to gamers and video editors with their latest Radeon HD 4800 series graphics processor. MSI takes what ATI started, and clean up a few rough edges. There's no doubting the performance potential of any Radeon HD 4850, but taming the beast within has been another story. All too often the industry produces a product a little too hot to handle, and the RV770 GPU is one fine example. Plagued with high heat output, it takes the daring minds at MSI to calm fire with ice. Benchmark Reviews has already tested the high-performance cooling options dedicated to the Radeon HD 4870: Sapphire has their Toxic and Palit has their Sonic, but it seems that the big names have overlooked the warm-blooded 4850. In this article, Benchmark Reviews tests the MSI Radeon HD 4850 video card R4850-512M SKU- MS-V803-285.
MSI has held an interest in graphics for several years, but it's been enthusiast and overclocker motherboards that make up their popular product lines. ATI offers some of the most impressive graphics products available, and the new Radeon HD 4850 is no different. Although it still uses GDDR3 clocked at 993 (1986 MHz DDR), unlike the 4870 version that is decked out with GDDR5, the MSI R4850-512M model offers 24x custom filter anti-aliasing (CFAA) on its 625 MHz 800-core RV770 GPU. Benchmark Reviews plans to test the MSI Radeon HD 4850 graphics card against it's closest competition, and even compares CrossFireX performance in this performance review. The ATI Radeon HD 4850 GPU brings the power of graphics to gamers, setting a new standard for visual computing. Redefine the way you play and take HD gaming to the extreme with best-in-class performance. The new TeraScale graphics engine delivers an immersive, cinematic gaming experience. Add this GPU to your PC and watch Blu-ray movies and play HD content with incredible visual fidelity. Do it all with break-through efficiency that doesn't compromise performance. About the company: Micro-Star International Corporation, Ltd.
|
|||||||||||||||||||||||||||||||||||||||||||||||||||||||||||||||||||||||||||||||||||||||||||||||||||||||||||||||||||||||||||||||||||||||||||||||||||||||||||||||||||||||||||||||||||||||||||||||||||||||||||||||||||||||||||||||||||||||||||||||||||||||||||||||||||||||||||||||||||||||||||||||||||||||||||||||||||||||||||||||||||||||||||||||||||||||||||||||||||||||||||||||||||||||||||||||||||||||||||||||||||||||||||||||||||||||||||||||||


|
Product |
RADEON HD 4850 |
RADEON HD 4870 |
|
VPU Clock(MHz) |
625 |
750 |
|
Memory Size |
512MB |
512MB |
|
Memory Data Width |
256bit |
256bit |
|
Memory Type |
GDDR3 |
GDDR5 |
|
Memory Speed(MHz) |
993 |
900(3.6Gbps) |
|
Maximum Board Power(Watt) |
120 |
163 |
|
Thermal Solution |
Single Slot Fan |
Dual Slot Fan |
|
BUS Type |
PCI-E x 16, 2.0 |
PCI-E x 16, 2.0 |
|
DirectX10/Shader Model 4.1 |
Yes |
Yes |
|
VGA Output |
Yes, by dongle |
Yes, by dongle |
|
DL-DVI-I |
x 2 |
x 2 |
|
SL-DVI-I |
- |
- |
|
HDMI |
Yes, by dongle |
Yes, by dongle |
|
H.264/VC-1 Acceleration |
Yes |
Yes |
|
7.1 AudioSupport |
Yes |
Yes |
|
HDCP Support |
Yes |
Yes |
|
HDTV Out |
Yes |
Yes |
|
Form Factor |
ATX |
ATX |
|
Packing |
Bulk/Light/Full |
Bulk/Light/Full |
|
Board Type |
BBA |
BBA |
Closer Look: MSI 4850
The MSI HD 4850 delivers a new level of performance to the mainstream user with its 512MB of GDDR3 memory, and nominal clock speeds of 625MHz (core) and 993MHz (memory). The 4850uses the PCI-Express Gen2 interface, and features dual connectors for CrossFireX cables, allowing two or more cards to be used together on a CrossFireX compatible mainboard for even higher graphics performance.
All MSI graphics cards in the HD 4800 series incorporate the latest ATI Avivo HD Technology for enhanced Video display and feature a new generation built in hardware UVD (Unified Video Decoder) considerably reducing CPU load and delivering smooth decoding of Blu-ray and HD DVD content for both VC-1 and H.264 codecs, as well as Mpeg files. In addition to two, dual-link DVI outputs, and TV-Out, a dedicated HDMI adaptor delivers both audio and video output on a single cable for direct connection to an HDMI ready display.

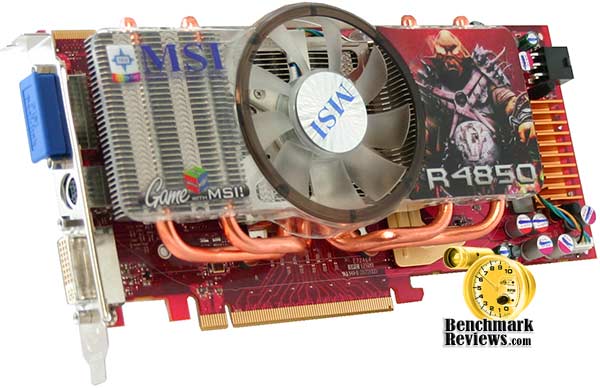
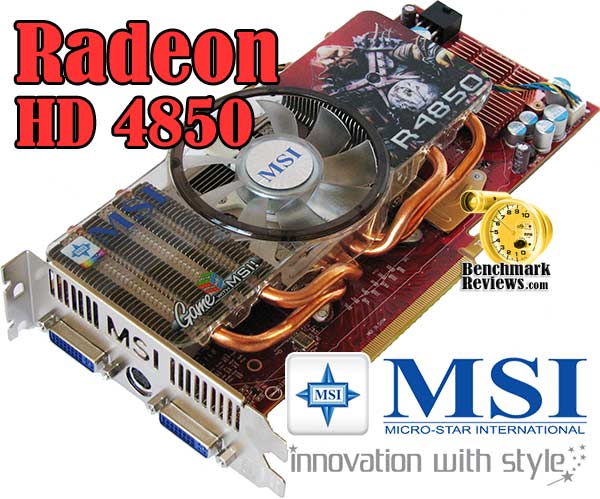
The MSI Radeon HD 4850 video card (model R4850-512M / SKU: MS-V803-285) comes in classic ATI red and offers a double-slot sized graphics solution for the PCI-Express bus. There are a few small details that seem to stand out as either interesting or unique, and I'll make sure to discuss each at length. First and foremost is the cooling.
Unlike the reference Radeon HD 4850 design, MSI emphasizes enthusiast cooling on their R4850-512M. As a result the single-height profile is replaced with a quad-heatpiped double-height cooling solution. Beyond the active cooling improvements, MSI has also given the power regulation components some attention with passive cooling heatsinks to ensure stable game play.

Cost is key. There's no question that the AMD-ATI merger has trickled down into a serious economy-of-design state of mind. Since the US economy has recently eroded like a mudslide, the financial recession has placed chipmakers on a more even playing field. This is exactly the opportunity ATI needed prove that they can still produce some of the best video cards money can buy.

The reference Radeon HD 4850 used a streamlined construction to reduce manufacturing costs. The cooling unit, for example, used a copper-embedded single-height unit. While copper is considerably expensive, the design translates into less material overall because of increased thermal conductance.
MSI adds some value to the stock Radeon design with their own custom heat-pipe filled double-decker cooling solution. This innovation may force a device from it's home on the motherboard, but I assure you that the Radeon RV770 needs every cool breeze it can get. The ATI Radeon HD 4850 reference design we tested idled over 50°C, while MSI's R4850 was a cool 35°C. Once performance supplied a full load to the RV770 GPU, the reference design simmered to nearly 83°C while the MSI 4850 barely warmed to 60°C. Overclockers know that electronics work better when they're not red-hot; and MSI knows how to keep the overclockers happy.

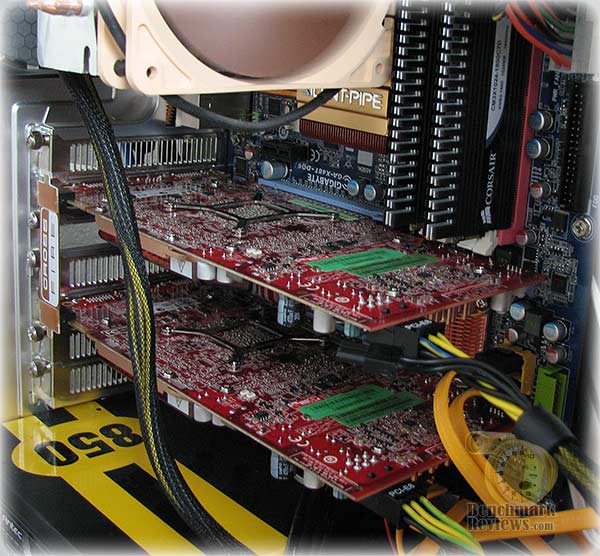
The cooling unit on the MSI Radeon HD 4850 video card is held tight to the RV770 GPU with the use of a reinforcing bracket and about a dozen screws. The double-height cooler does a very good job of cooling the R4850, but there is still a tremendous amount of heat that builds up on the PCB. If you're an overclocker, there isn't very much that can be done to help cool the unit from the reverse side of the circuit board, especially since there are no surface-mounted GDDR3 modules on this side of the Radeon HD 4850.
In our next section we detail our methodology for testing video cards. Following this we offer a cadre of benchmarks to show where the MSI Radeon HD 4850 stands against the GeForce 9800 GTX. 9800 GX2. and a couple GTX 280's. We even test the HD 4850 in a CrossFireX set... so please read on!
Testing Methodology
Benchmark Reviews has high hopes that one day we will be so giant and world famous that every combination of the graphic card available will be on-hand for our product testing... and we're getting closer! I envy the review sites that have twenty other video cards tested in stand-alone, SLI, and CrossFireX arrays for each and every review. Eventually we will be that big, and offer all of those configurations. Readers can help us grow to that size by spreading the word, but for now we'll have to make due with what our budget can afford. In this article, Benchmark Reviews is going to test and compare the MSI Radeon HD 4850 graphics card against several other closely-ranked products from within the GeForce family.
At the start of all tests, the previous display adapter driver is uninstalled and trace components are removed using Driver Cleaner Pro. We then restart the computer system to establish our display settings and define the monitor. Once the hardware is prepared, we begin our testing. The synthetic benchmark tests in 3DMark06 will utilize shader models 2.0 and 3.0. In our higher-end VGA products we conduct tests at the following resolutions: 1280x1024 (19" Standard LCD), 1680x1050 (22-24" Widescreen LCD), and 1920x1200 (24-28" Widescreen LCD). In some tests we utilized widescreen monitor resolutions, since more users are beginning to feature these products for their own computing.
Each benchmark test program begins after a system restart, and the very first result for every test will be ignored since it often only caches the test. This process proved extremely important in the World in Conflict and Supreme Commander benchmarks, as the first run served to cache maps allowing subsequent tests to perform much better than the first. Each test is completed five times, with the average results displayed in our article.
Our site polls and statistics indicate that the over 90% of our visitors use their PC for playing video games, and practically every one of you are using a screen resolutions mentioned above. Since all of the benchmarks we use for testing represent different game engine technology and graphic rendering processes, I feel that this battery of tests will provide a diverse range of results for you to gauge performance on your own computer system. Since most gamers and enthusiasts are still using Windows XP, it was decided that DirectX 9 would be used for all tests until demand and software support improve for Windows Vista.
Test System
- Motherboard: Gigabyte GA-X48T-DQ6 (Intel X48 Chipset) with version F6 BIOS
- Processor: Intel E8400 Core 2 Duo 3.0 GHz (Overclocked to 3.6 GHz)
- System Memory: Corsair PC3-14400 DDR3 1800MHz
- Audio: HT Omega Claro Plus+ AD8620BR Op Amp Sound Card
- Disk Drive: Mtron Pro 7500 32GB SATA-II SSD MSP-SATA7525
- Optical Drive: ASUS BC-1205PT SATA Blu-ray Disc Optical Drive
- Enclosure: Lian Li PC-B25B Black Aluminum Mid-Tower ATX Case
- PSU: ePower Technology EP-1200P10 xScale 1200W PSU
- Monitor: SOYO 26-Inch Widescreen LCD Monitor DYLM26E6
- Operating System: Windows XP Professional SP-3 (optimized to 16 processes at idle)
Benchmark Applications
-
3DMark06 v1.1.0 (8x Anti Aliasing & 16x Anisotropic Filtering)
- Call of Duty 4: Modern Warfare v1.7.568 (4x AA/16x Trilinear AF)
- Crysis v1.21 Benchmark (High Settings, 0x and 4x Anti-Aliasing)
- Lightsmark 2007 v1.3
- Unreal Tournament 3 v1.3 (High Quality, 16x Anisotropic Filtering)
- World in Conflict v1.0.0.9 Performance Test (Very High Setting: 4x AA/4x AF)
Video Card Test Products
| Product Series | FOXCONN GeForce 9800 GTX 9800GTX-512N | MSI Radeon HD 4850 MS-V803-285 | NVIDIA GeForce GTX 280 Reference | ZOTAC GeForce GTX 280 AMP! Edition ZT-X28E3LA-FCP | |
| Stream Processors | 128 | 800 | 128 (x2) | 240 | 240 |
| Core Clock (MHz) | 685 | 625 | 600 (x2) | 602 | 700 |
| Shader Clock (MHz) | 1713 | N/A | 1500 (x2) | 1296 | 1400 |
| Memory Clock (MHz) | 1100 | 993 | 1000 (x2) | 1107 | 1150 |
| Memory Amount | 512 MB GDDR3 | 512 MB GDDR3 | 512MB (x2) GDDR3 | 1024 MB GDDR3 | 1024 MB GDDR3 |
| Memory Interface | 256-bit | 256-bit | 256-bit (x2) | 512-bit | 512-bit |
-
FOXCONN GeForce 9800 GTX Standard OC Edition 9800GTX-512N (685 MHz GPU/1713 Shader/1100 RAM - Forceware v177.79)
-
MSI Radeon HD 4850 MS-V803-285 (625 MHz GPU/993 MHz RAM - Catalyst 8.9)
-
Gigabyte GeForce 9800 GX2 GV-NX98X1GHI-B (600 MHz GPU x2/1500 Shader/1000 RAM - Forceware v177.79)
-
NVIDIA GeForce GTX 280 Reference Product (602 MHz GPU/1296 MHz Shader/1107 MHz RAM - Forceware v177.79)
-
ZOTAC GeForce GTX 280 AMP! Edition ZT-X28E3LA-FCP (700 MHz GPU/1400 MHz Shader/1150 MHz RAM - Forceware v177.79)
Now we're ready to begin testing video game performance on the MSI MS-V803-285 Radeon HD 4850, so please continue to the next page as we start with the 3DMark06 results.
3DMark06 Benchmark Results
3DMark is a computer benchmark by Futuremark (formerly named Mad Onion) to determine the DirectX 9 performance of 3D game performance with graphics cards. 3DMark06 uses advanced real-time 3D game workloads to measure PC performance using a suite of DirectX 9 3D graphics tests, CPU tests, and 3D feature tests.
3DMark06 tests include all new HDR/SM3.0 graphics tests, SM2.0 graphics tests, AI and physics driven single and multiple cores or processor CPU tests and a collection of comprehensive feature tests to reliably measure next generation gaming performance today. Some enthusiasts may note that Benchmark Reviews does not include CPU-bound tests in our benchmark battery, and that only graphic-bound tests are included.
Here at Benchmark Reviews, we believe that synthetic benchmark tools are just as valuable as video games, but only so long as you're comparing apples to apples. Since the same test is applied in the same controlled method with each test run, I believe 3DMark is a very reliable tool for comparing graphic cards against one-another.
Using a base resolution of 1024x768 as our starting point (representative of 17" LCD monitors) the maximum settings were applied to 3DMark06, which for these tests includes 8x Anti-Aliasing and 16x Anisotropic Filtering. Low-resolution testing allows the graphics processor to plateau maximum output performance, which thereby shifts demand onto the system components to keep up. At the lower resolutions 3DMark will reflect the GPU's top-end speed in the composite score, indicating full-throttle performance with little load. This makes for a less GPU-dependant test environment, and is helpful in measuring the maximum output performance in the test results.

There doesn't seem to be any question that 3DMark06 really likes the CrossFireX pair of Radeon HD 4850 video cards. Because of the added overhead of combined graphics processors and video frame buffer memory, the light load created by the shader model 2.0 tests have a negative impact on the CrossFireX score. Another way of describing this phenomenon is comparing the combined Radeon HD 4850 video cards to a race car with only the highest gears available: it will have a faster top-end speed, but it will take longer to get there.

The ZOTAC GeForce GTX 280 AMP! Edition video card is appears to also be another high-gear example, as it is nudged out by the GeForce 9800 GX2 for SM 2.0 tests but outperforms the GX2 in the more complex HDR/SMR 2.0 tests. At our lowest test resolution of 1024x768, the ZOTAC GeForce GTX 280 AMP! Edition puts the reference NVIDIA GeForce GTX 280 a decent margin below it.
Bumping the GPU strain up a notch with 1280x1024 resolutions the scores remain relatively comparable in terms of performance ratio. More visitors to Benchmark Reviews operate at this resolution than anything else, as it represents the native resolution of 19" LCD monitors. The MSI Radeon HD 4850 keeps pace with the GeForce 9800 GTX at this resolution, in the same way the Gigabyte GeForce 9800 GX2 keep pace with the overclocked GeForce GTX 280 AMP! Edition video card. However, moving into the more advanced HDR tests there is a decisive lead over the 9800 GTX by the Radeon HD 4850, and the ZOTAC GTX 280 takes a healthy single-GPU lead over the crowd.

At the widescreen resolution of 1680x1050, the scores are practically identical in ratio to all of our previous tests. Once again, the shader model 2.0 tests put the 9800 GTX barely ahead of the HD 4850, at least until they reach the shader model 3.0 tests where everything is reversed. Twin Radeon HD 4850 video cards in a CrossFireX set are still running circles around the competition in 3DMark06, and the ZOTAC GeForce GTX 280 AMP! Edition is the most powerful single-GPU video card.
While the entire G90-series GPU family is PCI Express 2.0 compatible, there doesn't seem to be enough demand to create an immediate advantage. However, with the much higher-output GT200 GPU, the bandwidth demands raise from 6.4 GBps on the GeForce 8800 GTX to 12.8 GBps on the GTX 280. The Radeon CrossFireX set of HD 4850 video cards actually seems to work very well with our test motherboard, the Gigabyte GA-X48T-DQ6.

Finishing up the series of synthetic benchmark tests under heavy load, the FOXCONN GeForce 9800 GTX Standard OC Edition video card matches the MSI Radeon HD 4850 in the SM 2 tests, yet the Radeon HD 4850 dominates over the 9800 GTX by 32% in the more advanced shader model 3.0 tests. It would take two Sapphire Radeon HD 4850's to beat out the GeForce 9800 GX2, and both standard and ZOTAC-overclocked GTX 280 video cards.
One of NVIDIA's goals for the GT200 was to produce a GPU that doubles the performance of the 8800 GTX, but it looks like ZOTAC's goal was a little different as it nearly doubles the performance of the newer 9800 GTX. Producing 3647 HDR/SM3 points, the ZOTAC GTX 280 AMP! Edition outperforms the twin-G92 9800 GX2 by only 6%, and the Radeon HD 4850 by 41%. However, taking cost into consideration, the CrossFireX set of Radeon HD 4850's outperforms the more expensive GTX 280 by over 40% in 3DMark06.
| Product Series | FOXCONN GeForce 9800 GTX 9800GTX-512N | MSI Radeon HD 4850 MS-V803-285 | NVIDIA GeForce GTX 280 Reference | ZOTAC GeForce GTX 280 AMP! Edition ZT-X28E3LA-FCP | |
| Stream Processors | 128 | 800 | 128 (x2) | 240 | 240 |
| Core Clock (MHz) | 685 | 625 | 600 (x2) | 602 | 700 |
| Shader Clock (MHz) | 1713 | N/A | 1500 (x2) | 1296 | 1400 |
| Memory Clock (MHz) | 1100 | 993 | 1000 (x2) | 1107 | 1150 |
| Memory Amount | 512 MB GDDR3 | 512 MB GDDR3 | 512MB (x2) GDDR3 | 1024 MB GDDR3 | 1024 MB GDDR3 |
| Memory Interface | 256-bit | 256-bit | 256-bit (x2) | 512-bit | 512-bit |
Take the 3DMark06 tests at face value, because in our next section we begin real-world testing on a cadre of popular video games known for taxing the graphics processor, and the performance curve is expected change. Our first up is Crysis, so please continue on...
Crysis Benchmark Results
Crysis uses a new graphics engine: the CryENGINE2, which is the successor to Far Cry's CryENGINE. CryENGINE2 is among the first engines to use the Direct3D 10 (DirectX10) framework of Windows Vista, but can also run using DirectX9, both on Vista and Windows XP.
Roy Taylor, Vice President of Content Relations at NVIDIA, has spoken on the subject of the engine's complexity, stating that Crysis has over a million lines of code, 1GB of texture data, and 85,000 shaders. To get the most out of modern multicore processor architectures, CPU intensive subsystems of CryENGINE 2 such as physics, networking and sound, have been re-written to support multi-threading.
Crysis offers an in-game benchmark tool, which is similar to World in Conflict. This short test does place some high amounts of stress on a graphics card, since there are so many landscape features rendered. For benchmarking purposes, Crysis can mean trouble as it places a high demand on both GPU and CPU resources. Benchmark Reviews uses the Crysis Benchmark Tool by Mad Boris to test frame rates in batches, which allows the results of many tests to be averaged.
The very first thing we discovered in the low-resolution tests was how seemingly poor both of our multi-GPU products performed. The Gigabyte GeForce 9800 GX2 was matched in average frame rate by the MASI Radeon HD 4850, and the GeForce 9800 GTX edged out the CrossFireX set of 4850's. To be fair, none of these video cards will probably ever realistically see this low resolution, so the performance only illustrates how high-end GPU power can be cut short if the monitor (resolution) doesn't match it.

Low-resolution testing allows the graphics processor to plateau maximum output performance, which thereby shifts demand onto the system components. At the lower resolutions Crysis will reflect the GPU's top-end speed in the composite score, indicating full-throttle performance with little load. This makes for a less GPU-dependant test environment, and is helpful in creating a baseline for measuring maximum output performance in the next few test results.
At the 1280x1024 resolution used by 19" monitors, our results show that performance is beginning to really drop despite the small difference is pixels drawn. In terms of general performance, all of these products maintain the same performance ratio as before, except for the 9800 GX2 which seems to hold its ground.

The CrossFireX set of HD 4850's is going to soon reach it's limit, as it is in last gear and the 9800 GX2 is still shifting up the tree. The NVIDIA GeForce GTX 280 Reference Product is outperformed by the overclocked ZOTAC GeForce GTX 280 AMP! Edition with a 11% margin; which goes to show how far a 100 MHz overclock will take the GTX200 GPU.
For widescreen users, our benchmarks below indicate that the ATI Radeon HD 4850 matches the performance of NVIDIA's GeForce 9800 GTX video card, although the 4850 stops delivering post-processing effects at 8x AA and the 9800 GTX can reach 32x AA if the application supports it.

A CrossFireX set of HD 4850's beats out the GeForce 9800 GX2 by almost 13% at this lower widescreen resolution, but they can't touch the GTX 280 series... yet. Testing in high-pressure Crysis also seems to have effected both of the GeForce GTX 280 products we've tested, which are barely ahead of the GeForce 9800 GX2 dual-GPU graphics card.
Heading into the 1920x1200 resolutions produced on the SOYO DYLM26E6 used for testing, Crysis forces 2.3 million pixels to be processed by our graphical test products. Despite what 3DMark06 has reported, the CrossFireX set of Radeon HD 4850's is not king; the GeForce GTX 280 series is. If only by a small difference, the overclocked ZOTAC GTX 280 enjoys a 5% (2 FPS) lead over the GeForce 9800 GX2, which also seems to keep its own 8% (3 FPS) lead over the CrossFireX set.

At our highest widescreen resolution, the overclocked Foxconn 9800GTX-512N performs the same as MSI's R4850. At the end of our Crysis testing, neither the GeForce 9800 GTX or CrossFireX HD 4850 set could touch the single ZOTAC GTX 280 AMP! Edition video card. But before we leave Crysis, I decided to include a look at post-processing performance with 4x AA enabled at the 1680x1050 resolution; which is really about the only resolution that AA is playable with these products.

Since NVIDIA has recently reduced the price of GeForce 9800 GTX products to compete with the HD 4850, there will be some intense fighting between these two products. My professional opinion is that if these two products shared the exact same price and I only wanted to buy just one of them, my money would go to the Radeon HD 4850 over the GeForce 9800 GTX. If you want excellent bang for the buck from a multi-GPU array, my money would go to CrossFireX because of performance and widespread compatibility.
Even with a decent dose of anti-aliasing added to Crysis (at 1680x1050), the performance is still relatively decent for all products. Our Island timedemo mixes some beach and water views so it's going to be on the high side of frame rates when compared to actual game play, but as you can see every product we've tested hovers near the 30 FPS barrier for playable frame rates. It's worth noting that the reference GTX 280 produces a 3% lead over the 9800 GX2, which is minimal at best, and the 14% lead that a ZOTAC-overclocked GTX 280 AMP! Edition can deliver may not make the best argument for price.
| Product Series | FOXCONN GeForce 9800 GTX 9800GTX-512N | MSI Radeon HD 4850 MS-V803-285 | NVIDIA GeForce GTX 280 Reference | ZOTAC GeForce GTX 280 AMP! Edition ZT-X28E3LA-FCP | |
| Stream Processors | 128 | 800 | 128 (x2) | 240 | 240 |
| Core Clock (MHz) | 685 | 625 | 600 (x2) | 602 | 700 |
| Shader Clock (MHz) | 1713 | N/A | 1500 (x2) | 1296 | 1400 |
| Memory Clock (MHz) | 1100 | 993 | 1000 (x2) | 1107 | 1150 |
| Memory Amount | 512 MB GDDR3 | 512 MB GDDR3 | 512MB (x2) GDDR3 | 1024 MB GDDR3 | 1024 MB GDDR3 |
| Memory Interface | 256-bit | 256-bit | 256-bit (x2) | 512-bit | 512-bit |
In our next section, Benchmark Reviews switches to video-output only benchmarking with Lightsmark 2007. Read on to see how a blended high-demand GPU test with low video frame buffer demand will impact our test products.
Lightsmark Frame Rates
Stepan Hrbek is the mastermind behind Lightmark 2007, a program that allows you to benchmark real-time global illumination. Natural lighting makes artificial graphics life-like and real. Computers get faster, but rendering more polygons doesn't add value if lighting still looks faked, so insiders know that the next big thing is proper lighting; aka Realtime Global Illumination.
Typical workloads in real-time rendering will shift, and Lightsmark simulates it. Global Illumination renders often take hours, so is your computer fast enough for real-time?
Before Lightsmark, real-time global illumination was limited to small scenes, small resolutions, small speeds, specially crafted scenes with handmade optimizations. Lightsmark breaks all limits at once, running in reasonably sized scene (220000 triangles) in high resolutions at excellent speed. Lightsmark is comparable to lower-demand OpenGL video games, such as: Call of Duty 4, Prey, Quake 4, and Doom 3.
At the ultra-low resolution of 1024x768, Lightsmark doesn't need to work very hard to get our graphic cards to render 786,432 pixel. This resolution forces each GPU to open up performance full-throttle and react to rapidly called tasks. Demands are quick-paced, and not surprisingly, a larger hardware communication overhead means that performance suffers. The extended memory address of the CrossFireX set and GeForce GTX 280 will be put to the test in this speed-critical benchmark.

Lighting is computed fully automatically in an original unmodified scene from 2007 game World of Padman. This benchmark is not tweaked for Lightsmark, and contains all sorts of geometrical difficulties with extra rooms hidden below the floor.
This scene places medium to low demands on a graphics card processor and tests the maximum speed with which the scene can be properly displayed at each resolution. At the lower resolution, the large frame buffer does not offer the same benefits as it would at a higher resolution. Additionally, the larger video memory means a longer round-trip for information, and when the resolution is low that trip doesn't last very long and needs to be completed very quickly.

This is our first evidence that matching the video card to the rest of your hardware is just as important as matching it to the expected task. Notice from this test that Lightsmark doesn't favor the Goliath Gigabyte GeForce 9800 GX2, or the CrossFireX set of Radeon HD 4850 graphic cards. In fact, our GeForce 9800 GX2 was outperformed in every single Lightsmark test by GeForce 9800 GTX.
When we tested Crysis at 1650x1050, video frame buffer was not as critical as raw processing power. It helped, but obviously it didn't make a huge margin of difference. In Lightsmark, information is passed through the buffer and called on very quickly, and the only thing which was going to benefit this test was the appropriate ratio of graphical stream processors to video memory buffer, so that it could keep up with demands.

In terms of performance, this test offers very short but taxing graphics, and only the most nimble products with capable muscle can take advantage. This translates into trouble for anyone using new graphics hardware to render older (OpenGL) video games such as Doom 3 or Quake 4.

After all of the Lightsmark tests were complete, I'm sure these results aren't going to indicate anything in particular to most readers. As I mentioned before, the frame buffer has a whole lot to do with the speed of rendering. The larger the frame buffer, the longer it will take to complete the strobe of information. Lightsmark is meant to represent that collection of older games, which some of you might still be playing. Even Call of Duty 4: Modern Warfare runs on a proprietary game engine that Infinity Ward based off of the tried-and-true Q3 structure. So keep this in mind as you're shopping for a new video card, and don't overpower an older video game with multi-GPU graphics solutions because they will not produce the results you want.
| Product Series | FOXCONN GeForce 9800 GTX 9800GTX-512N | MSI Radeon HD 4850 MS-V803-285 | NVIDIA GeForce GTX 280 Reference | ZOTAC GeForce GTX 280 AMP! Edition ZT-X28E3LA-FCP | |
| Stream Processors | 128 | 800 | 128 (x2) | 240 | 240 |
| Core Clock (MHz) | 685 | 625 | 600 (x2) | 602 | 700 |
| Shader Clock (MHz) | 1713 | N/A | 1500 (x2) | 1296 | 1400 |
| Memory Clock (MHz) | 1100 | 993 | 1000 (x2) | 1107 | 1150 |
| Memory Amount | 512 MB GDDR3 | 512 MB GDDR3 | 512MB (x2) GDDR3 | 1024 MB GDDR3 | 1024 MB GDDR3 |
| Memory Interface | 256-bit | 256-bit | 256-bit (x2) | 512-bit | 512-bit |
In the next section we change gears and test to compare our group of video cards in Unreal Tournament 3. Please continue on to see how the Unreal Engine 3 performs with our test collection of products.
Unreal Tournament 3
Unreal Tournament 3 (UT3) is a first-person shooter and online multiplayer video game by Epic Games and is the next installment of the Unreal series after Unreal Tournament 2004. It is published by Midway Games and was released in North America for Windows on November 19, 2007.
Unreal Tournament 3 is actually the fourth game in the Unreal Tournament series and the eighth Unreal game, but it has been numbered in terms of the engine it runs on. UT3 is subsequently part of the third generation, because it runs on the Unreal Engine 3, and does not reuse any content from previous versions.
Since Unreal Tournament 3 was designed as a DirectX 9 video game with no current support expected for DirectX 10, we use Windows XP Pro (Service Pack 3) for our benchmark testing.
Beginning with the entry-level resolution of 1024x768, the benchmark scores are so close for some products that it might be time to eliminate this setting from our testing process. Nevertheless, it looks like the Unreal Engine 3 game engine doesn't care too much for the MSI Radeon HD 4850 video card, since the CrossFireX set was just barely able to keep pace with the others. Even with High Quality settings with all of the tweaks, and 16x anisotropic filtering enabled, Unreal Tournament 3 doesn't seem to strain the graphics card enough to create a noticeable difference in benchmark scores.

Tested at 1280x1024, the resolution is just beginning to create any real load on our test products. The ZOTAC GeForce GTX 280 AMP! Edition loses just a single frame per second (0.6%), and the MSI Radeon drops only 6% followed by the GeForce 9800 GTX at 5%. As the resolution increases, these scores should begin to separate more effectively. However, for now it appears that just about any graphics card can play Unreal Tournament 3 without issue.

When I tested the Honeywell HWLM2216 recently, I noticed how the 1680x1050 widescreen display resolution of this 22" LCD monitor offered very little strain over a 19" standard display LCD monitor. Comparatively, 1680x1050 produces 1.76 MP and 1280x1024 produces 1.31, so there's only a very small difference expected between performance levels. The biggest difference is in the user experience, because the widescreen monitor comes in very handy for watching multimedia video or playing large world-scape video games.

At 1680x1050 resolution, the differences are beginning to show, but I am getting the impression that only 1920x1200 will be useful for illustrating how each product performs. Although it's all still a tight race, the ZOTAC GTX 280 leads with 160 average frames per minutes, and the MSI R4850 trails behind the pack with 107 FPS. The GeForce 9800 GTX leads the HD 4850 by 16%, but the CrossFireX set of 4850's fights back with a 13% lead.

Finally arriving at 2.3 MP with a 1920x1280 resolution on our 26" SOYO DYLM26E6 test monitor, we can begin to see how the playing field has leveled out. The MSI Radeon HD 4850 still trails behind the GeForce 9800 GTX by 6%, but put another 4850 together for a CrossFireX set and they lead by 28%. The GeForce 9800 GX2 puts both G92 graphics processors to good use, and beats both the CrossFireX 4850's (by 16%) and the NVIDIA GeForce GTX 280 engineering sample (by only 4%). When everything was said and done, the overclocked ZOTAC GTX 280 AMP! Edition video card pulled off a very narrow victory.
| Product Series | FOXCONN GeForce 9800 GTX 9800GTX-512N | MSI Radeon HD 4850 MS-V803-285 | NVIDIA GeForce GTX 280 Reference | ZOTAC GeForce GTX 280 AMP! Edition ZT-X28E3LA-FCP | |
| Stream Processors | 128 | 800 | 128 (x2) | 240 | 240 |
| Core Clock (MHz) | 685 | 625 | 600 (x2) | 602 | 700 |
| Shader Clock (MHz) | 1713 | N/A | 1500 (x2) | 1296 | 1400 |
| Memory Clock (MHz) | 1100 | 993 | 1000 (x2) | 1107 | 1150 |
| Memory Amount | 512 MB GDDR3 | 512 MB GDDR3 | 512MB (x2) GDDR3 | 1024 MB GDDR3 | 1024 MB GDDR3 |
| Memory Interface | 256-bit | 256-bit | 256-bit (x2) | 512-bit | 512-bit |
Our last benchmark of the article is coming next, which puts our collection of video cards against some very demanding graphics.
World in Conflict Results
The latest version of Massive's proprietary Masstech engine utilizes DX10 technology and features advanced lighting and physics effects, and allows for a full 360 degree range of camera control. Massive's MassTech engine scales down to accommodate a wide range of PC specifications, if you've played a modern PC game within the last two years, you'll be able to play World in Conflict.
World in Conflict's FPS-like control scheme and 360-degree camera make its action-strategy game play accessible to strategy fans and fans of other genres... if you love strategy, you'll love World in Conflict. If you've never played strategy, World in Conflict is the strategy game to try.
World in Conflict offers an in-game benchmark; which records the minimum, average, and maximum frame rates during the test. Very recently another hardware review website made the assertion that these tests are worthless, but we couldn't disagree more. When used to compare video cards which are dependant on the same driver and use the same GPU architecture, the in-game benchmark works very well and comparisons are apples-to-apples.
First tested was the 1024x768 resolution in WiC, which is representative of the (very few) gamers using a 17" LCD monitor with this widescreen-preferred video game. Based on the test results charted below it's clear that WiC doesn't place a limit on the maximum frame rate (to conserve wasted power) which is good for full-spectrum benchmarks like ours, but bad for electricity bills. The average frame rate is shown in each chart, but our initial results are so close that it becomes obvious that WiC doesn't ask much from the graphics card at low resolutions. That's okay, because we've got three more to offer.

At 1024x768 the 9800 GTX was ahead by one single FPS against the MSI Radeon HD 4850, but at 1280x1024 the positions and results are exactly reversed. The CrossFireX set of HD 4850's are just a step behind the average frame rate of the GeForce 9800 GX2. Ultimately the overclocked ZOTAC GTX 280 would secure the lead with an average frame rate of 69 FPS; but a 3 FPS lead over the GeForce 9800 GTX is not exactly impressive.

Moving up a small step to 1680x1050 widescreen resolution, the trends are kept within the ratio they have operated at for the past two tests. The ZOTAC GeForce GTX 280 holds its ground and drops only 2 FPS, which results in a decidedly small lead over the 9800 GX2 by a whole 2 FPS. The Foxconn GeForce 9800 GTX is neck-and-neck with the Radeon HD 4850, and the CrossFireX setup is in-line with the 9800 GX2 and both GTX 280's.

With a balanced demand for CPU and GPU power, World in Conflict just begins to place demands on the graphics processor at the 1920x1280 resolution. I was expecting more of the same, and that is pretty much exactly what I got.
The performance decay had its hardest impact on the mid-level video cards: GeForce 9800 GTX and Radeon HD 4850, which for all intents an purposes performed exactly the same throughout our entire WiC testing. Two HD 4850's in CrossFireX configuration will yield a 46% improvement over using only one, while it matches performance with our reference NVIDIA GeForce GTX 280. The GeForce 9800 GX2 barely moved two full frames per second as it worked without effort from 0.79 MP up to 2.3 MP.

Taking a broader look at the average frame rate, there appears to be a major difference between the mid-range and high-end video card products when it comes to World in Conflict. This game offers DirectX 10 functionality, which could lend itself to taxing the CrossFireX, 9800 GX2, and GTX 280 graphics cards more appropriately. For our testing, it appears that only the mid-level GeForce 9800 GTX and MSI Radeon HD 4850 demonstrate a performance decay as the resolution is raised.
| Product Series | FOXCONN GeForce 9800 GTX 9800GTX-512N | MSI Radeon HD 4850 MS-V803-285 | NVIDIA GeForce GTX 280 Reference | ZOTAC GeForce GTX 280 AMP! Edition ZT-X28E3LA-FCP | |
| Stream Processors | 128 | 800 | 128 (x2) | 240 | 240 |
| Core Clock (MHz) | 685 | 625 | 600 (x2) | 602 | 700 |
| Shader Clock (MHz) | 1713 | N/A | 1500 (x2) | 1296 | 1400 |
| Memory Clock (MHz) | 1100 | 993 | 1000 (x2) | 1107 | 1150 |
| Memory Amount | 512 MB GDDR3 | 512 MB GDDR3 | 512MB (x2) GDDR3 | 1024 MB GDDR3 | 1024 MB GDDR3 |
| Memory Interface | 256-bit | 256-bit | 256-bit (x2) | 512-bit | 512-bit |
In our next section, we discuss electrical power consumption and learn how well (or poorly) each video card will impact your utility bill...
VGA Power Consumption
Life is not as affordable as it used to be, and items such as gasoline, natural gas, and electricity all top the list of resources which have exploded in price over the past few years. Add to this the limit of non-renewable resources compared to current demands, and you can see that the prices are only going to get worse. Planet Earth is needs our help, and needs it badly. With forests becoming barren of vegetation and snow capped poles quickly turning brown, the technology industry has a new attitude towards suddenly becoming "green". I'll spare you the powerful marketing hype that I get from various manufacturers every day, and get right to the point: your computer hasn't been doing much to help save energy... at least up until now.
To measure isolated video card power consumption, Benchmark Reviews uses the Kill-A-Watt EZ (model P4460) power meter made by P3 International. A baseline test is taken without a video card installed inside our computer system, which is allowed to boot into Windows and rest idle at the login screen before power consumption is recorded. Once the baseline reading has been taken, the graphics card is installed and the system is again booted into Windows and left idle at the login screen. Our final loaded power consumption reading is taken with the video card running a stress test using FurMark. Below is a chart with the isolated video card power consumption (not system total) displayed in Watts for each specified test product:
VGA Product Description(sorted by combined total power) |
Idle Power |
Loaded Power |
|---|---|---|
NVIDIA GeForce GTX 480 SLI Set |
82 W |
655 W |
NVIDIA GeForce GTX 590 Reference Design |
53 W |
396 W |
ATI Radeon HD 4870 X2 Reference Design |
100 W |
320 W |
AMD Radeon HD 6990 Reference Design |
46 W |
350 W |
NVIDIA GeForce GTX 295 Reference Design |
74 W |
302 W |
ASUS GeForce GTX 480 Reference Design |
39 W |
315 W |
ATI Radeon HD 5970 Reference Design |
48 W |
299 W |
NVIDIA GeForce GTX 690 Reference Design |
25 W |
321 W |
ATI Radeon HD 4850 CrossFireX Set |
123 W |
210 W |
ATI Radeon HD 4890 Reference Design |
65 W |
268 W |
AMD Radeon HD 7970 Reference Design |
21 W |
311 W |
NVIDIA GeForce GTX 470 Reference Design |
42 W |
278 W |
NVIDIA GeForce GTX 580 Reference Design |
31 W |
246 W |
NVIDIA GeForce GTX 570 Reference Design |
31 W |
241 W |
ATI Radeon HD 5870 Reference Design |
25 W |
240 W |
ATI Radeon HD 6970 Reference Design |
24 W |
233 W |
NVIDIA GeForce GTX 465 Reference Design |
36 W |
219 W |
NVIDIA GeForce GTX 680 Reference Design |
14 W |
243 W |
Sapphire Radeon HD 4850 X2 11139-00-40R |
73 W |
180 W |
NVIDIA GeForce 9800 GX2 Reference Design |
85 W |
186 W |
NVIDIA GeForce GTX 780 Reference Design |
10 W |
275 W |
NVIDIA GeForce GTX 770 Reference Design |
9 W |
256 W |
NVIDIA GeForce GTX 280 Reference Design |
35 W |
225 W |
NVIDIA GeForce GTX 260 (216) Reference Design |
42 W |
203 W |
ATI Radeon HD 4870 Reference Design |
58 W |
166 W |
NVIDIA GeForce GTX 560 Ti Reference Design |
17 W |
199 W |
NVIDIA GeForce GTX 460 Reference Design |
18 W |
167 W |
AMD Radeon HD 6870 Reference Design |
20 W |
162 W |
NVIDIA GeForce GTX 670 Reference Design |
14 W |
167 W |
ATI Radeon HD 5850 Reference Design |
24 W |
157 W |
NVIDIA GeForce GTX 650 Ti BOOST Reference Design |
8 W |
164 W |
AMD Radeon HD 6850 Reference Design |
20 W |
139 W |
NVIDIA GeForce 8800 GT Reference Design |
31 W |
133 W |
ATI Radeon HD 4770 RV740 GDDR5 Reference Design |
37 W |
120 W |
ATI Radeon HD 5770 Reference Design |
16 W |
122 W |
NVIDIA GeForce GTS 450 Reference Design |
22 W |
115 W |
NVIDIA GeForce GTX 650 Ti Reference Design |
12 W |
112 W |
ATI Radeon HD 4670 Reference Design |
9 W |
70 W |
In regard to power requirements, MSI's Radeon HD 4850 doesn't have the same hunger for electricity as we've seen some of the latest video cards crave. By using the Kill A Watt EZ model P4460 power meter by P3 International, I was able to determine that the MSI R4850 consumed identical power to that of the Sapphire Radeon HD 4850. The 4850 requires a single six-pin PCI-Express power connection to ensure that the RV770 receives enough juice to push out the frames in 3D mode. Middle-market enthusiasts and lower-end gamers will appreciate that their existing power supply may still be up to the task of feeding the Radeon HD 4850 the power it needs without an additional upgrade expense.
The downside is the lack of efficiency in the 55nm RV770. The loaded power consumption measured for this MSI Radeon HD 4850 is on the same level as a loaded NVIDIA GeForce GTX 280; something that either speaks well for NVIDIA or poorly for ATI. The idle power draw is minimal which is not uncommon since emphasis is usually placed on idle/standby mode efficiency and conservation, but still much higher than the GeForce 9800 GTX which it competes against.

Things look only a little better when two HD 4850's are combined into a CrossFireX set. At idle, the CrossFireX set consumes approximately 123 watts of power - roughly equivalent to two separate Radeon HD 4850's added together. The surprise comes under full load, which raises the power consumption to only 210 watts - on the level of a GTX 280 under full load.
Taken as a whole the idle stand-by power consumption is pretty unforgivable, especially since this the condition your equipment will be in the majority of the time. On the other hand, loaded consumption is not entirely bad... emphasis on entirely. Feel free to game without the guilt though, because you would be paying the same to your utility company with just about any other video card.
Please continue to the review conclusion in the next section, where I share my final thoughts on the RV770 graphics processor and give my opinion of the new Radeon HD 4800-series product offerings.
Radeon 4800-Series Final Thoughts
There's a lot to like about the new Radeon HD 4800 series of products. To begin with, 800 cores is nothing to scoff at; even if they aren't nearly as efficient as they sound. CrossFireX scales performance very well, and for the first time actually makes multi-card setups worth the money. The most likable part of the Radeon HD 4850 is that it sells for well under $200, forcing NVIDIA to drop the price of their GeForce 9800 GTX+ to meet with the competition. When ATI launched the Radeon HD 4870 at $300, NVIDIA had to answer back by dropping the GTX 260 to a more affordable price. But that's where everything becomes tricky, and the value of ATI's latest product comes into question.
But here's why clarifying how the value has become so tricky to define. The initial interest in a product like the Radeon HD 4850 lies in the fact that it competes head-on with the GeForce 9800 GTX. But now that they are both priced the same, value takes on a new dimension. In each and every test I conducted, the Radeon HD 4850 kept up with the GeForce 9800 GTX but never outperformed it (until 4x AA was added to Crysis). This would be the main reason why I see value becoming more of an issue outside of video game performance. The GeForce 9800 GTX+ offers HDMI, and so does the Radeon HD 4850. Both offer essentially the same exact sub-features down the line, except for when it comes to multi-card configurations; which is where the CrossFireX configuration really comes to shine.
I am very much aware that NVIDIA offers SLI just like ATI offers CrossFireX, but what I'm talking about is multi-card compatibility with motherboards. AMD Didn't exactly impress the world with Phenom, and thus the world hasn't jumped onboard to use their processors. Instead, Intel scooped up a large share of the consumer base with their P35/X38/P45/X48 chipsets (all launched within about ten minutes from each other). But here's my point: ATI still wins. All of these Intel motherboards, along with all of the AMD motherboards, offer CrossFire support exclusively. NVIDIA is left holding their own hand, because only their own chipsets will support SLI... at least until we Intel launches the X58 chipset which is expected to combine their technology with SLI in special versions of the product.

I'm not entirely sold on everything that the chipmakers would like for us to believe. I think it's sometimes worth questioning the wisdom, and in this regard I find that AMD is trying to pull one over on consumers by describing their RV770 to have 800 scalar processors. The reality is that ATI's 800 stream processor cores do not compare 1:1 against the competition, especially since the GeForce 9800 GTX can outperform the Radeon HF 4850 with only 128 shader cores. So despite what ATI would like to market, scalar processors they are not as they function exactly like vector processors would. With 800 processor cores residing in five bank location, each series of 5 processor cores process only one vector unit at a time - even if that vector doesn't need to use all five processor cores. 800 Cores are there, but they are far from the efficiency level seen by the competition.
My final thoughts on the 4800-series is where the Radeon 4850 and 4870 come up short. They're both great products just so that we're clear, but for a 55 nm process there's a lot missing from the RV770's arsenal that really should be there. I consider efficiency at the very start of this list, and even though my first lesson on the relationship between die process size and energy efficiency came from Mr. Jen-Hsun Huang, President of NVIDIA, I later researched this on my own to discover that he was correct: reduced die process does not equal increased energy efficiency. Obviously this phenomenon holds up very well against the power consumption results I've tested for this review.
ATI's memory bus architecture also has me questioning their efforts. NVIDIA can produce a 512-bit memory bus for a 1:1 ratio of memory to interface (512MB @ 512-bit), so it's just a little disappointing that ATI did not do the same for their Radeon HD 4850 and 4870 (which uses GDDR5). Perhaps if I lower my expectations on improvements towards technology, I could accept a 256-bit Radeon HD 4850, but if you're going to make GDDR5 your marketing headline then perhaps you should also do something to match the technical achievements found in competing products. Notwithstanding, memory bandwidth is far from being saturated by today's software (and hardware interface limits), and so my complaint is really more of a moot point, but it still stands to reason that AMD missed an opportunity here.
MSI R4850 Conclusion
MSI has been an enthusiast name for motherboards for so long, that perhaps they're hoping to gain a following in the graphics sector. Presentation is always the first summary I give in each product review conclusion, and the packaging for their latest 4800-series is not really so different from everyone else. An unnamed troll-looking character with battle armor looks mean enough, but I think it's time for a real mascot (not that this will really help sales). There's a good portion of marketing information in twenty-eight different languages at the back of the retail box, but not much in the way of specifications for the product inside. Consumers are getting smarter, and MSI should know that they're being sized up against the competition on store shelves.
Appearance is a whole other story because MSI really hit pay-dirt with their R4850 T2D512. It's a huge relief that they didn't clone the reference design, but it's even better that the upgraded cooling solution isn't covered in large plastic shrouds. The exposed electronic components to the rear of the card are protected by a heatsink for the power regulation components. Overall, the MSI Radeon HD 4850 is a welcome step up from the standard ATI design.
Construction is solid, but not without some concerns. If you've read any of my video card reviews, you'll know how much I dislike VGA coolers that exhaust back into the computer case. While MSI took the time to design their quad-heatpiped cooler to chill the red-hot RV770, they didn't refine it to the point where heated air is exhausted from the case. Even the connection header panel offers very little ventilation, which is evidence that room for improvement still exists. Aside from this small concern, the entire R4850 is very well suited for rougher environments.
I dislike the mentioning of competitor products in the article conclusion, but there are a few times when an exception is necessary. In terms of performance and functionality, the MSI Radeon HD 4850 is right on par with the GeForce 9800 GTX in many (but not all) applications and video games. Cooling performance is excellent, with over 25°C reduced from the reference design. On the downside, power consumption is much higher than I would have expected from ATI, who is revered as an efficiency-first company.
Value is always relative to supply and demand, along with whatever retailers think they can get from the consumer audience. At the time of this writing the MSI Radeon HD 4850 is being sold at NewEgg for $174.99 with a $20 mail-in rebate promotion available for a short time. I've found a few other sources selling around the same price, so it's a good idea to do some price shopping before you buy.
In summary, I can recommend the MSI Radeon HD 4850 MS-V803-285 to video game and overclocking enthusiasts because of the performance to value ratio and extremely effective cooling system. The 4850 comes close to the GeForce 9800 GTX in gaming performance, but never completely outperforms it. Taken into consideration, you have to look at price and sub-feature offerings. It's no surprise that CrossFire and CrossFireX are available on just about every single motherboard that fits an Intel or AMD process; the same is hardly true for the SLI. So then it's down to price. Since NVIDIA submitted to ATI's price point, both products are now offered at the same cost. At the end of this point, there's really no decisive victory to be handed out when comparing the two unless you consider price. The MSI Radeon HD 4850 is an outstanding product, and the performance is just as good as the alternative while costing less.
Pros:
+ Very good AA/AF performance for higher-end games
+ Supports DirectX 10 and Shader Model 4.0
+ 625 MHz GPU / 993 MHz GDDR3 vRAM
+ Features ATI AVIVO Technology
+ 1080p HDMI Audio and Video supported for HDCP output
+ Quiet fan under normal operation
+ Introduces new TeraScale Graphics Engine technology
+ Heat-pipe cooling unit reduces temperatures extremely well
+ Supports CrossFireX functionality
+ 24x Custom filter anti-aliasing (CFAA)
+ 5 GBps PCI Express 2.0 graphics interface
Cons:
- Less efficient power consumption than most comparable 65 nm products
- Maximum post-processing Anti Aliasing is limited to 8x
- Cooling unit occupies second PCI expansion slot
- Fragile electronic components are exposed on PCB
- Internally exhausting VGA cooler
- Kit does not include CrossFireX bridge component
Ratings:
-
Presentation: 8.50
-
Appearance: 9.25
-
Construction: 9.25
-
Functionality: 8.75
-
Value: 8.00
Final Score: 8.75 out of 10.
Quality Recognition: Benchmark Reviews Silver Tachometer Award.
Questions? Comments? Benchmark Reviews really wants your feedback. We invite you to leave your remarks in our Discussion Forum.
